


Abstract
Prior applications of machine learning to population health have relied on conventional model assessment criteria, limiting the utility of models as decision support tools for public health practitioners. To facilitate practitioners’ use of machine learning as a decision support tool for area-level intervention, we developed and applied 4 practice-based predictive model evaluation criteria (implementation capacity, preventive potential, health equity, and jurisdictional practicalities). We used a case study of overdose prevention in Rhode Island to illustrate how these criteria could inform public health practice and health equity promotion. We used Rhode Island overdose mortality records from January 2016–June 2020 (n = 1,408) and neighborhood-level US Census data. We employed 2 disparate machine learning models, Gaussian process and random forest, to illustrate the comparative utility of our criteria to guide interventions. Our models predicted 7.5%–36.4% of overdose deaths during the test period, illustrating the preventive potential of overdose interventions assuming 5%–20% statewide implementation capacities for neighborhood-level resource deployment. We describe the health equity implications of use of predictive modeling to guide interventions along the lines of urbanicity, racial/ethnic composition, and poverty. We then discuss considerations to complement predictive model evaluation criteria and inform the prevention and mitigation of spatially dynamic public health problems across the breadth of practice.
This article is part of a Special Collection on Mental Health.
Abbreviations
- ACS
American Community Survey
- CBG
Census block group
- GP
Gaussian process
- RF
random forest
- RIDOH
Rhode Island Department of Health
- SUDORS
State Unintentional Drug Overdose Reporting System
The clinical uses of machine learning algorithms have proliferated in recent years (1). More recently, epidemiologic researchers have engaged machine learning to inform public health surveillance and practice (2). Unlike clinical prediction, however, for which the analytical unit is individual patients, prediction for public health is often conducted at the population level, aggregating data geographically and temporally to facilitate population-level intervention and prevention.
In this paper, we highlight the importance of this distinction for model evaluation and illustrate the need for additional evaluation considerations using a case study of overdose prevention in Rhode Island. For clinical modeling, high predictive accuracy at the patient level is essential to inform care and avoid harm. In contrast, prediction for certain public health problems, particularly those related to population-level intervention and prevention, demands additional considerations, such as a health authority’s capacity to intervene and a jurisdiction’s demographic composition, to supplement spatiotemporal accuracy and inform practice.
Prior applications of machine learning to population health have relied primarily on conventional model assessments (e.g., model accuracy and precision) (3). While necessary for model-building and -tuning, using these metrics alone to assess performance may present challenges to practitioner interpretation and deployment of predictions in applied practice. As such, we argue that complementary evaluation criteria tailored to the intended use of predictions for public health prevention and policy decision support are needed to facilitate translation for nonspecialist practitioners.
Tailoring predictive model evaluation for public health practice
An established set of loss and error functions—e.g., mean squared error, R2, area under the receiver operating characteristic curve, or F-score—that describe a given model’s accuracy, precision, or recall typically are used for model evaluation (4). While these metrics can and should inform model-building, optimizing performance using standard metrics alone may offer insufficient information for practitioners in the applied interventional context with respect to area-level disease and injury prevention.
For example, if the spatial distribution of a preventable injury death within a jurisdiction has most sharply peaked in several distinct geographic areas, any reasonably accurate predictive model should identify those areas as high-risk. However, if cases are concentrated in these areas, the mean squared error or R2 would primarily evaluate how precisely a model predicts the event count in these few highest-risk areas rather than how well it informs intervention deployment (and specifically, which areas should be prioritized for intervention) in the context of prevention.
To bridge the gap between modeling and practice, this article outlines a framework with which to evaluate population-level predictive models for public health intervention (Table 1). Such practice-based evaluation frameworks have been utilized in other domains, such as law enforcement (5), but the integration of data science with public health intervention remains an emerging research area (6). We have identified 4 considerations for predictive models to become effective public-health decision support tools:
1) implementation capacity, or the level of intervention dissemination that is feasible across a jurisdiction;
2) preventive potential, or the possible public health benefits of intervention dissemination;
3) health equity, or the allocation of resources proportionate to need across geography and sociodemographic characteristics; and
4) jurisdictional practicalities, or site-specific constraints unique to a public health authority.
Considerations Regarding Evaluation of Predictive Models for Public Health Practice and Application to Overdose Prevention
| Consideration | Guiding Question | Case Application |
|---|---|---|
| Practitioner capacity | What capacity do authorities have to distribute prevention resources across a jurisdiction? | Established ceiling for practitioner prioritization capacity assuming neighborhood-level distribution of harm reduction interventions |
| Preventive potential | What is the preventive potential of focused intervention deployment? | Identify proportion of statewide overdose deaths captured in neighborhoods selected for intervention prioritization by models |
| Health equity | How will resources be allocated across geographic, racial/ethnic, and socioeconomic lines? | Assessed neighborhoods selected by the model using geographic, racial/ethnic, and socioeconomic metrics for practitioner consideration |
| Jurisdictional practicalities | How will resources be deployed within subjurisdictions? | Presented “unconstrained,” “lightly constrained,” and “fully constrained” scenariosa for practitioner consideration |
Abbreviation: CBG, Census block group.
a “Fully constrained” denotes a fixed proportion of CBGs selected across municipalities; “lightly constrained” denotes at minimum 1 CBG selected per municipality, with the remainder unfixed; and “unconstrained” denotes no fixed selection by municipality.
These considerations correspond to 4 guiding questions to which epidemiologic researchers and practitioners can jointly respond when utilizing predictive analytics for population prevention to concretize predictive modeling for practitioners and facilitate decision support. We apply our framework to a case study of overdose prevention in Rhode Island.
Case study: predictive analytics for overdose prevention
Unintentional drug overdose remains a leading cause of accidental death in the United States (7), with marked recent increases following the introduction of illicitly manufactured synthetic opioids into US drug markets and disruptions associated with the coronavirus disease 2019 (COVID-19) pandemic (8–10). Despite substantial investment in overdose response across levels of government (11), adequate public health responses continue to be constrained by scarce resources (12). Moreover, decisions about where to allocate finite prevention resources at the local level typically are determined using retrospective surveillance data, with distribution based on past overdose burden. Spatial shifts in area-level overdose risk, however, complicate these decisions and offer opportunities for forecasting, since retrospective data may no longer reflect current overdose risk (13).
Building on traditional methods for “hot spot” analysis (14), advances in small-area prediction using spatiotemporal machine learning have demonstrated the feasibility of accurate community overdose risk forecasting (15). These methods offer the potential for practitioners to bolster the impact of limited resources by reaching both communities with endemically high overdose death and emerging overdose “hot spots” (16). We demonstrate here how our framework can bridge the gap between statistical performance and practical utility for practitioners.
METHODS
First, we fitted predictive models using conventional metrics and available data. Second, we assessed performance across the 4 domains described above to supplement conventional metrics and situate modeling in the context of intervention. Study procedures were approved by the Brown University Institutional Review Board (Providence, Rhode Island).
Data sources
We used 2 data sources discretized into 6-month intervals from January 1, 2016, through June 30, 2020: 1) overdose mortality data and 2) data from the US Census Bureau’s American Community Survey (ACS) (17). Data were aggregated to the level of a Census block group (CBG), the smallest geographic unit for which Census data are available. CBGs were selected because they correspond to areas with approximately 600–3,000 residents and may act as valid proxies for neighborhoods (18). We used neighborhood as our predictive unit to illustrate geographically focused distribution of overdose prevention interventions. Of the 815 CBGs in Rhode Island, we excluded 6 to which public health resources could not be distributed (e.g., military bases, airports, or marine terminals), for an analytical sample of 809 CBGs.
Overdose mortality data were obtained from the Rhode Island Department of Health’s (RIDOH) State Unintentional Drug Overdose Reporting System (SUDORS) (19). SUDORS data are maintained in collaboration with the Centers for Disease Control and Prevention to enhance state capacity for and accuracy of overdose mortality data abstraction from medical examiners’ files and death certificates, law enforcement records, and toxicology testing.
For this study, SUDORS captured all unintentional overdose deaths occurring in Rhode Island between January 1, 2016, and June 30, 2020 (n = 1,484). We defined the location of overdose as the street address nearest to where the overdose occurred and assigned each death to a CBG using a Census geocoder. When the location of the overdose was missing, invalid, or out of state (n = 161), we used the decedent’s residence for geocoding and CBG assignment when available (n = 93). Seven cases were excluded because of a missing death date, and 1 case was identified as duplicated, producing a final sample of 1,408 deaths.
ACS estimates for calendar years 2016–2019 were extracted from the US Census (17). We utilized all available CBG-level indicators—206 variables capturing demographic, social, and economic characteristics (see Web Table 1, available at https://doi.org/10.1093/aje/kwad119). For continuous variables, we took the mean of the available years due to limited change in neighborhood demographic characteristics over time.
Statistical analysis
Our primary objective was to demonstrate the use of novel evaluation criteria to optimize the neighborhood-level allocation of overdose prevention resources across Rhode Island. Hence, we do not present the optimal model for overdose prediction but rather present a case study to illustrate how our practice-oriented evaluation criteria may inform practitioner decisions. Nonetheless, our model outcome was overdose fatality counts by CBG. As such, our predictive problem was one of regression rather than classification.
We used 2 regression models: Gaussian process (GP) and random forest (RF). We selected these methods as case illustrations for 3 reasons. First, prior studies have used them to predict overdose, and, as such, they are established methods in our case study’s substantive area (15, 20). Second, both are straightforward methods that can be implemented with limited data sources (here, only ACS and SUDORS data). Third, the GP and RF methods operate differently, focusing on the spatial distribution of overdoses and CBG demographic features, respectively. Hence, they illustrate the flexibility of our evaluation criteria across modeling approaches. We intend for our evaluation considerations to be broadly applicable irrespective of machine learning approach, rather than specific to the models used here.
Prior work has demonstrated the utility of GP models for spatiotemporal prediction of overdose deaths in comparison with other anomaly detection methods in a dense metropolitan area (15). Our study builds on this work by applying GP models to overdose prediction in a low-density statewide context. Likewise, prior work has utilized RFs to identify ACS predictors of opioid overdose deaths at the neighborhood level (21). Our study builds on this work by offering an evaluation framework to facilitate the use of predictions for public health practice. All analyses were performed using Python 3.0 (Python Software Foundation, Wilmington, Delaware).
First, we used GP regression, a nonparametric, Bayesian modeling technique that learns a covariance structure from given data to capture spatial and temporal dependencies and identify anomalous patterns (22). GPs are well suited to complex problems and have been applied in public health and public safety to overcome issues of small samples, sparse or 1-dimensional data, and autoregressive data structures (23). Our GP models used CBG overdose counts from SUDORS and CBG centroid coordinates.
The properties of a given GP are determined by the mean and covariance of a real process using a kernel function specified a priori to define the given GP covariance function (24). For this study, we utilized a radial basis function kernel to model spatial correlation, in conjunction with a white kernel to model additive Gaussian noise. Given that our unit of prediction was CBGs in Rhode Island, which vary in size across rural and urban geographies, we optimized the radial basis function kernel across a range of distances between 100 m and 100,000 m using training log marginal likelihood and GP score, a GP evaluation metric similar to R2 (22).
Second, we used RF regression, a tree-based model that utilizes an a priori–defined number of nonparametric regression trees to generate predictions (25). As an ensemble of decision trees, RFs force each decision tree split to consider a random subset of predictors to produce less correlated trees and then combine those subtrees to produce a final prediction. By aggregating a host of decision trees, RFs reduce the potential for overfitting bias to which decision trees are susceptible (26). That is, an individual decision tree may produce highly accurate predictions for the data on which it was trained but will generalize poorly to unseen test data, while the ensemble can produce more accurate predictions out of sample. RFs also facilitate the computation of variable importance, which may inform public health practice and open future research questions (27). Our RF model used CBG overdose counts from SUDORS and CBG-level ACS features.
To train our RF model, we tuned hyperparameters using 5-fold cross-validation, identifying optimal values for tree depth, number of features, and number of samples per leaf. The selected set of hyperparameters was used to fit the predictive model and evaluate out-of-sample performance.
Model training and testing
We used 6-month prediction windows, established in collaboration with RIDOH as a realistic period for a nimble public health authority to adjust statewide resource deployment. Our training periods spanned January 1, 2016, through December 31, 2019. Our test period spanned January 1, 2020, through June 30, 2020.
Model evaluation for public health practice
To identify priority CBGs for overdose prevention resources, we did not need to predict with high accuracy the exact number of future overdose deaths in each neighborhood. Rather, we sought to predict the neighborhoods across Rhode Island that, if prioritized, could prevent the greatest proportion of overdose deaths statewide. As such, our primary performance metric was the proportion of all overdose deaths statewide (in the 6-month test period) that occurred in the CBGs selected by the model.
Implementation capacity.
To facilitate intervention strategy in light of resource limitations and local stakeholder priorities, we assessed performance across a range of prioritization capacities, since different interventions scale differently. Because RIDOH oversees public health activities in Rhode Island, we worked with practitioners to consider a ceiling for statewide, neighborhood-level resource distribution. Discussions between the research team and practitioners resulted in a ceiling of 20% of CBGs statewide that could be prioritized by overdose prevention organizations each year, given existing resources. For comparative purposes, we selected a range of 5%–20% of CBGs. Interventions could include, for example, community-based naloxone distribution, scalable to a higher proportion of CBGs, and mobile buprenorphine induction programs, scalable to a smaller proportion of CBGs.
Preventive potential.
To assess the potential impact of neighborhood-level interventions on overdose mortality, we identified the proportion of statewide overdose deaths that occurred in CBGs selected by the model. This was guided by the theory that, in a geographically diverse, statewide context like Rhode Island, public health authorities might maximize the impact of existing interventions by focusing those efforts on a selection of the highest-risk neighborhoods, rather than diluting resources across a larger geographic area that includes low-risk neighborhoods. This was our primary model performance metric, informed by discussions about intervention impact with public health stakeholders.
Health equity.
To ensure that models guided equitable resource distribution along lines of geography, race, and socioeconomic status, we calculated the proportion of prioritized CBGs meeting the geographic, racial, and socioeconomic classifications detailed below. As with our primary metric, we assessed performance assuming selection of 5%–20% of CBGs.
To measure the balance between urban and nonurban selected CBGs, we used data from the Rhode Island Division of Statewide Planning (28). The Rhode Island Division of Statewide Planning classifies municipalities with a population density of at least 2,500 persons per square mile and at least 50% of land developed as urban. CBGs within municipalities not meeting these criteria were classified as nonurban. Of the 809 CBGs in our sample, 343 (42.4%) were nonurban and 466 (57.6%) were urban.
Since Rhode Island largely is segregated by race between urban and nonurban municipalities—with urban municipalities being more racially diverse and nonurban municipalities more racially homogenous (28)—we assessed racial and socioeconomic equity separately by urbanicity. We classified urban CBGs with respect to their percentage of non-White residents and their multigroup entropy index (i.e., Theil’s H) (29). This index ranges from 0, meaning only 1 racial group is present, to 1.39 (equivalent to the natural log of 4, selected because we considered segregation across 4 groups: White, Black, Hispanic/Latino, and other). Majority White neighborhoods were those with entropy indices below 0.695 (50th percentile) for which the percent White was the largest percentage of residents. Majority non-White neighborhoods were those with entropy indices below 0.695 for which the percent White was the lowest. CBGs not meeting these criteria were classified as integrated. Of the 466 urban CBGs, 202 (43.4%) were majority White, 102 (21.9%) were majority non-White, and 162 (34.7%) were integrated.
For nonurban CBGs, we assessed socioeconomic status according to the proportion of the population with household income below the federal poverty line. We classified CBGs with 20% or more of the population below the federal poverty line as “poverty areas” (30). CBGs with less than 20% of the population below the federal poverty line were considered “nonpoverty areas.” Of the 343 nonurban CBGs, 36 (10.5%) were poverty areas and 307 (89.5%) were nonpoverty areas.
Jurisdictional practicalities.
Across Rhode Island, the density of CBGs varied between municipalities, with urban municipalities holding a higher density of geographically smaller CBGs and nonurban municipalities primarily consisting of geographically larger CBGs. To consider the practical dimensions of statewide public health intervention in the context of geographic diversity—through which past burden must balance with future risk and existing resources—we assessed models across 3 constraint scenarios.
The first, “fully constrained” scenario fixed the proportion of selected CBGs across municipalities. That is, each municipality in Rhode Island would receive prioritized resources to an equal proportion of its highest-risk CBGs. The second, “lightly constrained” scenario fixed the highest-risk CBG per municipality for priority and assigned the remaining CBGs irrespective of municipality. This ensured that the model selected at least 1 neighborhood per municipality, but lower-risk CBGs were not selected over higher-risk CBGs across municipalities. The constraint here is that no municipalities go without any prioritized CBGs. The third, “unconstrained” scenario selected the highest-risk CBGs irrespective of municipality. Given that the majority of overdose deaths in Rhode Island historically have occurred in the state’s urban cores, this scenario necessarily would prioritize urban CBGs. We produced comparisons of the 3 scenarios for both models across the evaluation criteria.
RESULTS
Overdose mortality
Between January 1, 2016, and June 30, 2020, 1,408 unintentional overdose deaths occurred in Rhode Island. During this period, the median number of overdose deaths per CBG was 1 (range, 0–21). The rate of overdose death was higher in urban CBGs than in nonurban CBGs (Figure 1).
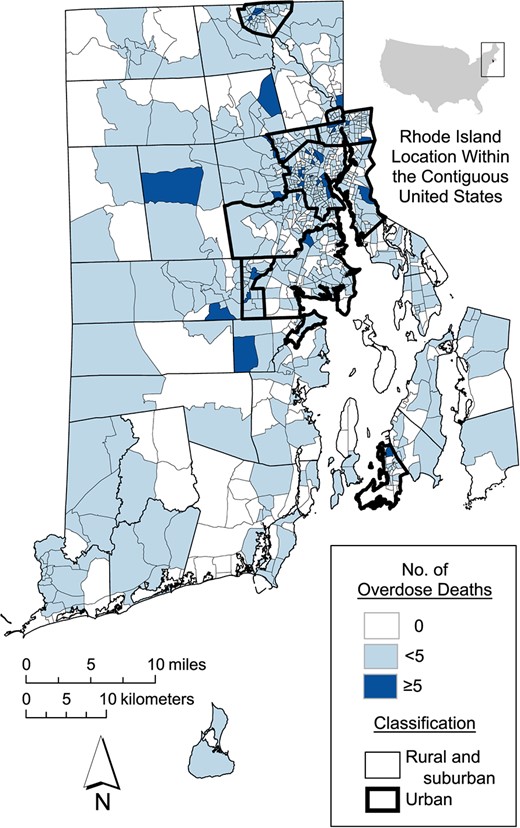
Numbers of overdose deaths in Rhode Island by US Census block group, January 1, 2016–June 30, 2020.
Preventive potential
Table 2 presents the preventive potential, our primary metric, for both models across a 5%–20% range of implementation capacities for each of the jurisdictional practicality scenarios. Assuming 20% implementation capacity, the proportion of statewide overdose deaths captured in the 20% of CBGs prioritized by the GP model over the 6-month forecasting period ranged from 30.0% in the fully constrained scenario to 33.2% in the unconstrained scenario. At the lowest assessed implementation capacities, the unconstrained scenario predicted the larger proportion of statewide overdose deaths, while at higher capacities, the lightly constrained scenario was superior.
Assessment of the Preventive Potential (Percentage of Statewide Overdose Deaths Captured) of 2 Machine Learning Models, Rhode Island, January 1–June 30, 2020a
| Machine Learning Model | ||||||||
|---|---|---|---|---|---|---|---|---|
| Gaussian Process | Random Forest | |||||||
| Constraint Scenario | 5% of CBGs | 10% of CBGs | 15% of CBGs | 20% of CBGs | 5% of CBGs | 10% of CBGs | 15% of CBGs | 20% of CBGs |
| Fully constrainedb | 7.5 | 17.7 | 26.2 | 30.0 | 10.2 | 19.3 | 25.1 | 33.2 |
| Lightly constrainedc | 7.5 | 18.7 | 26.7 | 34.2 | 10.2 | 19.3 | 28.9 | 36.4 |
| Unconstrainedd | 10.2 | 18.7 | 24.1 | 33.2 | 11.8 | 19.3 | 28.9 | 35.8 |
Abbreviation: CBG, Census block group.
a Proportion of overdoses captured in CBGs that were selected for prioritization, for each model, scenario, and implementation capacity.
b “Fully constrained” denotes a fixed proportion of CBGs selected across municipalities.
c “Lightly constrained” denotes, at minimum, 1 CBG selected per municipality, with the remainder unfixed.
d “Unconstrained” denotes no fixed selection by municipality.
For the RF model, performance over the 6-month forecasting period ranged from 33.2% of statewide overdose deaths (fully constrained) to 36.4% (lightly constrained). At the lowest assessed implementation capacity, the unconstrained scenario was superior. At the midrange implementation capacities, the unconstrained and lightly constrained scenarios performed comparably.
Health equity
Table 3 shows the performance of both models along our health equity metrics at 20% implementation capacity for the 3 jurisdictional practicality scenarios, measuring the proportion of each type of CBG prioritized for intervention. For both models, the unconstrained scenario prioritized urban CBGs and the fully constrained scenario prioritized nonurban CBGs. Within urban CBGs, both models prioritized majority non-White and integrated CBGs regardless of constraint scenario. This pattern was maximized for the GP model, which prioritized a maximum of 75.5% of the majority non-White CBGs and 29.0% of the integrated CBGs within urban jurisdictions. Within nonurban CBGs, the RF model prioritized poverty areas for all constraint scenarios, up to a maximum of 48.6% of nonurban, poverty-area CBGs for the fully constrained scenario. For the GP model, the split between nonpoverty- and poverty-area CBGs was narrower and nearly equal for the lightly constrained and unconstrained scenarios. Equity metrics across the range of implementation capacities are presented in Web Tables 2–4.
Distribution of Overdose Prevention Resources Across Census Block Groups (%) in 2 Machine Learning Models (Health Equity Assessment at 20% Implementation Capacity), Rhode Island, January 1–June 30, 2020a
| Machine Learning Model | |||||||
|---|---|---|---|---|---|---|---|
| Gaussian Process | Random Forest | ||||||
| Demographic Classification | No. of CBGs | Fully Constrainedb | Lightly Constrainedc | Unconstrainedd | Fully Constrained | Lightly Constrained | Unconstrained |
| Urban CBGse | 466 | 18.0 | 24.7 | 29.1 | 18.0 | 25.2 | 27.6 |
| Racially integrated areasf | 162 | 25.0 | 25.3 | 29.0 | 18.8 | 26.5 | 28.7 |
| Majority non-White areasg | 102 | 24.0 | 61.3 | 75.5 | 29.9 | 63.2 | 68.1 |
| Majority White areash | 202 | 9.4 | 5.7 | 5.5 | 11.4 | 5.0 | 6.2 |
| Nonurban CBGsi | 343 | 22.7 | 13.7 | 7.7 | 22.7 | 13.0 | 9.8 |
| Nonpoverty areasj | 307 | 21.5 | 14.0 | 7.8 | 19.7 | 10.4 | 7.3 |
| Poverty areask | 36 | 33.3 | 11.1 | 6.9 | 48.6 | 34.7 | 30.6 |
Abbreviation: CBG, Census block group.
a Proportion of CBGs of each type that were selected for prioritization, for each model and scenario, at 20% implementation capacity.
b “Fully constrained” denotes a fixed proportion of CBGs selected across municipalities.
c “Lightly constrained” denotes, at minimum, 1 CBG selected per municipality, with the remainder unfixed.
d “Unconstrained” denotes no fixed selection by municipality.
e CBGs with a population density of at least 2,500 persons per square mile and a minimum of 50% of land developed.
f An entropy index score not meeting the 2 criteria in footnote "g" or "h".
g An entropy index score below 0.695 for which the percentage of White residents was smallest.
h An entropy index score below 0.695 for which the percentage of White residents was largest.
i CBGs with a population density of fewer than 2,500 persons per square mile and less than 50% of land developed.
j CBGs in which less than 20% of the population has a household income below the federal poverty line.
k CBGs in which at least 20% of the population has a household income below the federal poverty line.
DISCUSSION
In this paper, we have proposed a framework with which to translate predictive analytics for public-health practitioner decision support. Key considerations included capacity for implementation, the preventive potential of an intervention, geographic and sociodemographic equity in resource allocation, and jurisdiction-specific practical or operational constraints. These model evaluation considerations are applicable to other emerging and localized public health problems.
As the uses of machine learning in public health expand, it is crucial that investigators bridge the gap between research and practice. Researchers have applied predictive analytics to public health problems across infectious disease outbreaks (31), occupational health (32), and injury prevention (33). Prior applications, however, have relied on traditional metrics to assess performance, making it difficult for practitioners to utilize algorithms for policy decision supports. Our criteria can supplement traditional metrics to help integrate models into practice.
We start by asking, “What capacity do authorities have to distribute prevention resources?”. Capacity assessment is integral to public health intervention (34). To facilitate capacity assessment, we assessed performance across a range of prioritized neighborhoods, from 5% to 20%. This ceiling (20%, or 162 CBGs) was determined through discussions with practitioners at RIDOH. When transporting this metric to other jurisdictions and public health problems, allocation thresholds and geographic units necessarily would differ. For example, a municipal health authority may use zip codes as an analytical unit and have capacity to scale to a smaller percentage of the total area. Ultimately, these decisions must be made collaboratively with stakeholders.
Likewise, our case study demonstrates that resource allocation based on predictive models may offer a value added to preventive resource allocation by other means. Both predictive models used in our demonstration achieved approximately 35% overdose preventive potential at 20% targeting capacity. This represents as much as 1.75 times more overdose deaths prevented than what could be captured assuming naive uniform resource allocation across Rhode Island. A currently ongoing randomized trial aims to determine the efficacy and real-world impact of predictive modeling on population-level overdose mortality in this study setting (35). Nevertheless, our case example illustrates the feasibility of predictive models to inform public health practice.
Because health equity promotion is foundational to contemporary public health practice (36), our proposed criteria facilitate the explicit consideration of equity across places and persons. The potential threats to equity posed by machine learning are well documented (37), heightening the need for scrutiny when applied to population health. In Rhode Island, the distinction between urban and nonurban areas is relevant, so we defined equity along these sociodemographic lines. Our demonstration models selected approximately the same proportions of urban and nonurban CBGs, with a slight preference for urban areas by the GP model. Other health authorities may find urbanicity less salient, and other equity domains may need to be considered, depending on the problem at hand (e.g., sex/gender equity or equity by historical or present disease burden) (38).
We assessed the racial/ethnic distribution of predictions among urban CBGs and the socioeconomic distribution among nonurban CBGs, due to Rhode Island’s patterns of sociodemographic segregation (28). While these are not the only demographic indicators of health equity, we used these for purposes of illustration and relevance to Rhode Island’s unique demographic composition. For our case, the GP model prioritized majority non-White and integrated CBGs as compared with the RF model, while the RF model prioritized higher-poverty areas as compared with the GP model, highlighting for practitioners the relative tradeoffs in equity that different modeling strategies could produce. Regardless of the machine learning approach employed and the demographic makeup of a jurisdiction, our framework allows practitioners to assess resource distribution as a tool for fostering health equity.
Collectively, the demonstration models we presented performed well in terms of prioritizing racial/ethnic minority and economically disadvantaged CBGs. However, there is no guarantee that a given model will prioritize resources equitably. This is especially true for subjective outcome measures (e.g., in clinical care and policing) where race/ethnicity and socioeconomic factors may interact with the probability of an event’s being recorded (39). As such, the equity measures we proposed are vital for practitioners to assess whether predictive models may unfairly disadvantage certain communities.
Finally, our use of 3 constraint scenarios attends to the practical considerations of public health. Public health practice is inextricable from jurisdictional political concerns, as budgetary and resource priorities are determined in large part by political processes (40). These concerns also are closely related to equity inasmuch as how public health authorities choose to define equity and to what extent they prioritize promotion of that equity are in many respects linked to larger political processes (41). Some jurisdictions may find an unconstrained scenario most palatable, prioritizing the highest-risk geographies regardless of location or sociodemographic composition. Other jurisdictions may prefer the fully constrained scenario, prioritizing parity in resource allocation across geographic units regardless of sociodemographic composition.
In our case, public health authority in Rhode Island is centralized, with a single agency disseminating resources across municipalities statewide. In contrast, public health authority in many states (e.g., Texas) is decentralized, with local governments controlling policy and programming (42). Regardless of governance structure, however, the metrics we have presented offer practitioners an array of information to guide decision-making and interpret predictive analytics in the context of intervention and prevention.
Limitations
This study had several limitations. First, our criteria assumed that predictions would be used to prioritize overdose prevention resources at the neighborhood level across Rhode Island. Should this evaluation metric be transported to another jurisdiction, the metric itself would generalize, but our assumption of consistent use of predictions by practitioners might not hold.
Second, our predictions and concomitant evaluations were limited by the data used. Any biases associated with our data would translate to our predictions and evaluations. However, we have confidence in the validity of SUDORS, which is maintained in Rhode Island by RIDOH and validated by the Centers for Disease Control and Prevention (43). While prior work identified variation in the quality of ACS estimates across the United States, particularly the rural South (44), the fact that our study was restricted to Rhode Island, a small and relatively homogeneous state in New England, and utilized data over several years imbues confidence in our use of the ACS.
Third, our criteria only provide information for practitioners to evaluate predictions and compare models. Our approach does not select the appropriate set of models to compare or the optimal loss function, which modelers would need to determine a priori in concert with practitioners. However, our evaluation criteria do apply irrespective of the modeling approach used, as long as predictive model outputs can be used to rank study units for prioritization. For example, we predicted the overdose death counts by CBG; if we instead modeled the predicted probability of overdose deaths by CBG or directly predicted the rankings of CBGs, our evaluative criteria would still hold.
Fourth, our approach is particularly useful for spatially targeted and rapidly deployed interventions such as community-based naloxone distribution and mobile street outreach, which can be allocated and changed with relative ease, using real-time surveillance data, when available. However, our considerations may offer less information for spatially diffuse interventions or temporally static interventions over a longer time horizon. For such interventions, our criteria could be adapted to consider long-run prevention potential across broader areas; different modes of equity, such as equity in disease burden and intervention receipt, may also be considered alongside our criteria. However, given how many public health problems can be addressed through short-run, targeted interventions, our criteria can still contribute concretely to injury, chronic disease, and infectious disease epidemiology.
Fifth, our criteria allow practitioners to assess the potential impact of a given intervention, but they do not account for intervention “dose,” instead assuming that practitioners will allocate responses uniformly across prioritized areas. For interventions that are not easily “dosed,” extensions of the criteria presented here may prioritize geographic areas along a gradient (e.g., high, medium, and low priority). To assess interventions for which dosing is integral, supplementary evaluative criteria should be developed.
Conclusions
In this article, we have discussed several considerations regarding prediction for public health intervention to complement machine-learning model performance assessments and have demonstrated the application of these considerations to a case study of overdose prevention. As a decision support tool, our criteria have the potential to inform the prevention and mitigation of spatially dynamic public health problems across the breadth of practice, from injury prevention to infectious and chronic disease and occupational and environmental health.
ACKNOWLEDGMENTS
Author affiliations: Center for Opioid Epidemiology and Policy, Department of Population Health, Grossman School of Medicine, New York University, New York, New York, United States (Bennett Allen, Victoria A. Jent, Magdalena Cerdá); Center for Urban Science and Progress, New York University, New York, New York, United States (Daniel B. Neill); Department of Computer Science, Courant Institute of Mathematical Sciences, New York University, New York, New York, United States (Daniel B. Neill); Robert F. Wagner Graduate School of Public Service, New York University, New York, New York, United States (Daniel B. Neill); Division of Health Policy and Management, School of Public Health, University of California, Berkeley, Berkeley, California, United States (Robert C. Schell); Division of Epidemiology, School of Public Health, University of California, Berkeley, Berkeley, California, United States (Jennifer Ahern); Center for Health Data and Analysis, Rhode Island Department of Health, Providence, Rhode Island, United States (Benjamin D. Hallowell); and Department of Epidemiology, School of Public Health, Brown University, Providence, Rhode Island, United States (Maxwell Krieger, William C. Goedel, Abigail R. Cartus, Jesse L. Yedinak, Claire Pratty, Brandon D. L. Marshall).
This study was supported by the National Institute on Drug Abuse (grants R01DA046620 and T32DA007233).
This study was based on overdose mortality data from the Rhode Island Department of Health. Access to these data requires separate permission from the Rhode Island Department of Health.
Conflict of interest: none declared.

