


Abstract
Unemployment insurance is hypothesized to play an important role in mitigating the adverse health consequences of job loss. In this prospective cohort study, we examined whether receiving unemployment benefits is associated with lower mortality among the long-term unemployed. Census records from the 2006 Canadian Census Health and Environment Cohort (n = 2,105,595) were linked to mortality data from 2006–2016. Flexible parametric survival analysis and propensity score matching were used to model time-varying relationships between long-term unemployment (≥20 weeks), unemployment-benefit recipiency, and all-cause mortality. Mortality was consistently lower among unemployed individuals who reported receiving unemployment benefits, relative to matched nonrecipients. For example, mortality at 2 years of follow-up was 18% lower (95% confidence interval (CI): 9, 26) among men receiving benefits and 30% lower (95% CI: 18, 40) among women receiving benefits. After 10 years of follow-up, unemployment-benefit recipiency was associated with 890 (95% CI: 560, 1,230) fewer deaths per 100,000 men and 1,070 (95% CI: 810, 1,320) fewer deaths per 100,000 women. Our findings indicate that receiving unemployment benefits is associated with lower mortality among the long-term unemployed. Expanding access to unemployment insurance may improve population health and reduce health inequalities associated with job loss.
Abbreviations
Extensive research has linked unemployment to a wide range of adverse health outcomes, including higher rates of death, cardiovascular disease, and mental illness (1–5). Although both selection and causation processes have been shown to underpin these associations (6–8), existing evidence is broadly supportive of the notion that job loss has a direct and determinantal impact on health (9–12). More than a decade after the Great Recession, unemployment remains a serious problem in numerous countries around the world (13). Now, with the outbreak of the COVID-19 pandemic, forceful indications of a global economic downturn have resurfaced. Among other major consequences, the pandemic has caused unprecedented job losses, with unemployment rates reaching as high as 13% in the United States and Canada during the initial phase of lockdown (14, 15). Mass layoffs, in turn, have triggered a dramatic surge in the number of people applying for unemployment insurance. Despite rapidly growing demand for social protection, strict eligibility criteria have prevented many of these individuals from successfully qualifying for unemployment benefits (15, 16). This is particularly true in the United States and Canada, where established unemployment insurance programs provide most workers with little to no protection (13). To help address this problem, governments have relaxed program rules and temporarily extended benefit coverage to millions of workers (15–18). Although these discretionary measures are principally intended to alleviate the social and economic consequences of increasing unemployment (19), evidence suggests they might also play an important role in mitigating the public health impacts of the current labor market crisis (20–23).
There are several reasons why unemployment insurance programs might offset the adverse health consequences of job loss. By reducing income shocks, unemployment benefits shield workers from poverty, financial strain, and other forms of material hardship (24). As a supplementary source of purchasing power, unemployment benefits also improve access to health-promoting goods and services, such as food, housing, and health care (25). Beyond the material advantages afforded by income support, a perceived right to unemployment protection may diminish the psychosocial impact of job loss, including associated harms to perceived status and self-esteem (26). Finally, compensation for lost wages can shield workers from the long-term economic “scars” of unemployment and provide a favorable boost to future labor market outcomes, including higher wages and better job quality upon re-employment (27, 28).
In line with these arguments, research has shown that countries with more generous unemployment insurance systems exhibit better health outcomes and narrower health inequalities (20, 21, 29–31). Numerous studies also suggest that, among jobless workers, receipt of unemployment benefits is associated with better self-rated health (32–37). Taken as a whole, this body of literature has shed promising light on a potential policy lever for protecting the health of the unemployed. Yet, due to a nearly exclusive focus on self-reported measures of health, we still have a very limited understanding of the relationship between unemployment-benefit recipiency and objective measures of health status, including clinically meaningful indicators of morbidity and mortality.
Given the economic impacts of the current pandemic and associated policy responses, there is a pressing need to better understand the role that unemployment insurance programs can play in mitigating the adverse health consequences of job loss (38, 39). In this study, we contribute to that agenda by examining the relationship between unemployment-benefit recipiency and mortality in a large, nationally representative cohort of 2.1 million Canadians.
METHODS
Data and sample
Data were obtained from the 2006 Canadian Census Health and Environment Cohort, a nationally representative cohort of 6.5 million Canadians belonging to the 20% of households that completed the mandatory 2006 Census long form on May 16, 2006. Census records were linked to the Canadian Mortality Database covering the period between May 16, 2006, and May 16, 2016. The response rate for the 2006 Census was 93.5%. The linkage rate for the 2006 Canadian Census Health and Environment Cohort was 91%. Our population of interest consisted of economically active adults aged 25–64 years. We excluded people who were out of the labor force (e.g., due to disability, caregiving, early retirement; n = 650,440), temporarily absent from work (n = 111,170), without a history of employment (n = 6,115), or self-employed (n = 317,320).
Measures
The main outcome variable was all-cause mortality. Measurement began on census day (i.e., May 16, 2006) and continued over a 10-year follow-up. The endpoint was death or censoring on the last day of follow-up (i.e., May 16, 2016). We were unable to identify loss to follow-up from emigration out of Canada. Emigrants, therefore, are treated as survivors. The main exposure variables were employment status and unemployment-benefit recipiency. Employment status was measured using a single item that asked respondents to describe their main labor-force activity on census day. We distinguished between those who were employed and those who were unemployed (i.e., jobless and actively seeking work). Among the unemployed, we further distinguished between recipients and nonrecipients of unemployment benefits. Benefit status was determined on the basis of whether respondents received personal income from the federal Employment Insurance (EI) program during the preceding calendar year (i.e., 2005). For approximately 75% of respondents who consented to a linkage between their census and tax records, income—including EI recipiency—was measured using official tax records. We relied on self-reported income data for the remaining sample. We provide a detailed description of the EI program in Web Appendix 1 (available at https://doi.org/10.1093/aje/kwab144).
Whereas employment status was measured on census day (i.e., May 16, 2006), benefit status was measured over the preceding calendar year (i.e., 2005). As a result of this time lag, we could not accurately determine the benefit status of the short-term unemployed (i.e., those who were unemployed on census day but had worked at some point during the 20-week period between January 1 and May 16, 2006). To avoid any resulting misclassification bias, we removed these individuals from the study (n = 62,485). Our analytic sample thus consisted of 1) those who were employed on census day and 2) those who were unemployed on census day and had not held a job during the preceding 20 weeks. The latter group—composed of the long-term unemployed—was further decomposed to distinguish between 2a) those who reported receiving EI in 2005 and 2b) those who did not report receiving EI in 2005.
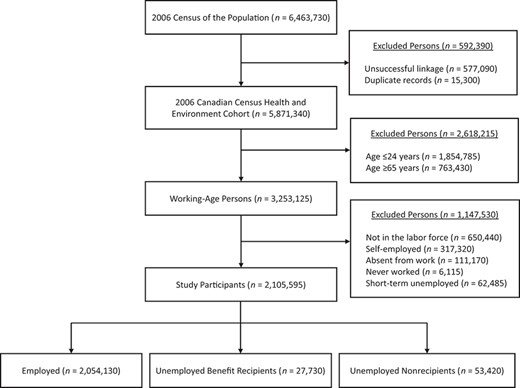
Flowchart of persons included in the study cohort, 2006 Canadian Census Health and Environment Cohort. Sample sizes are randomly rounded to the nearest 5, per Statistics Canada rules.
Because of the strict criteria that workers must meet to qualify for unemployment insurance, benefit recipients and nonrecipients differ in some important respects. We therefore collected information on the following covariates: age (continuous), sex (male or female), marital status (married/cohabitating, single, or divorced/separated/widowed), household size (continuous), immigrant status (Canadian-born or foreign-born), urbanicity (urban or rural), region (Eastern, Central, Western, or Northern), pretransfer household income (quartiles based on the preceding calendar year), education (postsecondary degree, some postsecondary, secondary degree, or less than secondary), home ownership (owner or renter), occupational status (National Occupational Classification), the number of weeks worked during the previous calendar year (continuous), and whether a majority of those weeks were worked on a full-time basis (≥30 hours vs. <30 hours per week). Although census records do not contain information on a broad suite of health indicators, we controlled for the presence of physical and mental activity limitations at home (none, sometimes, or often) and at work (none, sometimes, or often). The latter variables are described in detail in Web Appendix 2.
Statistical analysis
Analyses were stratified by sex (40). We began by calculating age-standardized mortality rates per 100,000 person-years for each study group. We used the direct method of standardization, taking the 5-year age distribution of the 2006 Canadian population as the reference. Next, we examined time-varying relationships between employment status, unemployment-benefit recipiency, and mortality using flexible parametric survival analysis. Flexible parametric survival analysis is similar to the standard Cox proportional hazards model with the exception that the former approach makes use of restricted cubic splines to relax the proportional hazards assumption and provide a more flexible framework within which to model complex survival functions (41–44). We selected this framework after formal testing and visual inspection of Schoenfeld residuals indicated that the proportional hazards assumption was not met.
Descriptive Characteristics of the Study Sample of Economically Active Adults Aged 25–64 Years (n = 2,105,595), Canadian Census Health and Environment Cohort, 2006
| Variable | Employed, % | Unemployed Benefit Recipients, % | Unemployed Nonrecipients, % |
|---|---|---|---|
| Age range, years | |||
| 25–34 | 23.5 | 27.6 | 29.9 |
| 35–44 | 30.1 | 27.5 | 29.7 |
| 45–54 | 30.7 | 26.5 | 25.7 |
| 55–64 | 15.7 | 18.4 | 14.7 |
| Sex | |||
| Men | 53.0 | 55.5 | 50.9 |
| Women | 47.0 | 44.5 | 49.1 |
| Marital status | |||
| Married or cohabitating | 73.1 | 68.4 | 55.4 |
| Single | 16.6 | 20.0 | 30.4 |
| Divorced, separated, widowed | 10.3 | 11.6 | 14.2 |
| Household size, no. | |||
| 1 | 10.9 | 11.4 | 14.1 |
| 2 | 29.0 | 28.3 | 26.3 |
| 3 | 20.9 | 25.8 | 22.6 |
| ≥4 | 39.2 | 34.5 | 37.0 |
| Immigrant status | |||
| Canadian born | 78.0 | 79.7 | 65.9 |
| Urbanicity | |||
| Urban | 78.5 | 65.1 | 82.9 |
| Region | |||
| Eastern Canada | 6.7 | 25.4 | 7.8 |
| Central Canada | 61.4 | 57.5 | 67.7 |
| Western Canada | 30.9 | 16.7 | 23.8 |
| Northern Canada | 0.9 | 0.4 | 0.8 |
| Household income, quartile | |||
| 4 (top) | 29.1 | 6.5 | 8.7 |
| 3 | 27.8 | 12.3 | 10.7 |
| 2 | 25.3 | 20.0 | 14.1 |
| 1 (bottom) | 17.8 | 61.2 | 66.5 |
| Educational level | |||
| Postsecondary degree | 24.6 | 13.2 | 22.7 |
| Some postsecondary | 39.9 | 38.5 | 34.6 |
| Secondary degree | 23.1 | 24.6 | 22.8 |
| Less than secondary | 12.4 | 23.7 | 19.9 |
| Home ownership | |||
| Owner | 77.5 | 68.2 | 48.4 |
| Occupation | |||
| Professional | 19.5 | 7.2 | 7.0 |
| Managerial | 11.5 | 4.6 | 3.5 |
| Skilled, technical, supervisory | 28.6 | 24.8 | 11.2 |
| Semiskilled | 31.5 | 34.9 | 18.4 |
| General | 8.9 | 16.7 | 8.8 |
| Data not available | 0.0 | 11.8 | 51.1 |
| Weeks worked in previous yeara | 46.1 | 24.0 | 15.0 |
| Hours worked in previous year | |||
| Full time | 85.1 | 88.8 | 73.1 |
| Part time | 14.9 | 11.2 | 26.9 |
| Activity limitations at home | |||
| None | 93.7 | 90.3 | 84.0 |
| Sometimes | 5.0 | 7.1 | 10.6 |
| Often | 1.3 | 2.6 | 5.4 |
| Activity limitations at work | |||
| None | 92.8 | 90.4 | 87.7 |
| Sometimes | 4.9 | 6.6 | 7.4 |
| Often | 2.3 | 3.0 | 4.9 |
a Values are expressed as means.
Average Follow-up, Number of Deaths, and Age-Standardized Mortality Rates by Employment and Benefit Status Among Economically Active Adults Aged 25–64 Years (n = 2,105,595), Canadian Census Health and Environment Cohort, 2006
| Study Group | Person-Years | Average Follow-Up, years | No. of Deaths | ASMR |
|---|---|---|---|---|
| Men | ||||
| Employed | 10,760,875 | 9.88 | 31,795 | 295 |
| Unemployed: benefit recipients | 140,710 | 9.76 | 830 | 515 |
| Unemployed: nonrecipients | 262,105 | 9.71 | 1,795 | 704 |
| Women | ||||
| Employed | 9,584,100 | 9.93 | 16,850 | 280 |
| Unemployed: benefit recipients | 131,835 | 9.90 | 300 | 265 |
| Unemployed: nonrecipients | 260,935 | 9.87 | 830 | 370 |
Abbreviation: ASMR, age-standardized mortality rate per 100,000 person-years.
We used flexible parametric survival analysis to estimate adjusted survival curves, survival differences (i.e., absolute differences in survival probabilities), and hazard ratios. We estimated 2 complementary models. In model 1, unemployed individuals who reported receiving benefits (hereafter, “unemployed benefit recipients”) and unemployed individuals who did not report receiving benefits (hereafter, “unemployed nonrecipients”) were each compared with a reference group of employed individuals. In model 2, employed individuals were excluded from the analysis and unemployed benefit recipients were compared with a reference group of unemployed nonrecipients. In the latter model, we combined flexible parametric survival analysis with propensity-score matching to better account for potential confounding in the association between unemployment-benefit recipiency and mortality. As noted earlier, substantial differences in the underlying attributes of benefit recipients and benefit nonrecipients render a straightforward comparison of these 2 groups somewhat problematic (32). Propensity score matching is a useful technique when, as in the present study, there is limited overlap in the baseline distribution of covariates between study groups (45–47). Unlike traditional regression methods, propensity score methods provide a convenient and transparent set of tools with which to improve covariate balance in observational settings. Researchers can apply these tools in concert with simple diagnostic tests to formally evaluate the degree of covariate balance achievable within a given sample. Compared with traditional regression modeling, propensity score methods also have the added advantage of not imposing functional form assumptions on covariate-outcome relationships (45, 46).
In model 2, we used kernel matching on the propensity score to balance unemployed benefit recipients and unemployed nonrecipients across the full set of covariates. The technique involved matching unemployed benefit recipients with a weighted average of unemployed nonrecipients, using weights that are inversely proportional to the distance between a given pair of recipient and nonrecipient observations (48). The matching procedure was restricted to the region of common support. The default bandwidth of 0.06 was used (results were not sensitive to this choice) (49). To evaluate the quality of the balancing procedure, we calculated standardized differences for all covariates before and after matching, using a conservative threshold of 5% or less to indicate sufficient balance (50). Using this propensity score–matched sample, we estimated the average treatment effect on the treated (i.e., the average effect of receiving unemployment benefits on mortality) among unemployed benefit recipients.
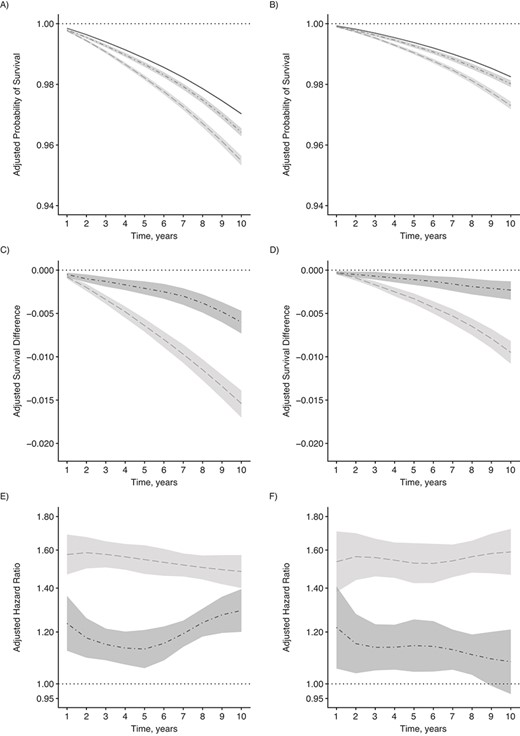
Adjusted survival curves, survival differences, and hazard ratios for all-cause mortality, 2006 Canadian Census Health and Environment Cohort. A and B) Probabilities of survival among the employed (solid line), unemployed benefit recipients (dash-dotted line), and unemployed nonrecipients (dashed line) for men (A) and women (B). C and D) Survival differences comparing unemployed benefit recipients (dash-dotted line) and unemployed nonrecipients (dashed line) with the employed reference group for men (C) and women (D). E and F) Hazard ratios comparing unemployed benefit recipients (dash-dotted line) and unemployed nonrecipients (dashed line) with the employed reference group for men (E) and women (F). Estimates are presented with corresponding 95% confidence intervals and adjusted for age, marital status, household size, immigrant status, urbanicity, region, pretransfer household income, education, home ownership, occupation, labor market history, and activity limitations. Hazard ratios are plotted on a log scale.
Covariate Balance Before and After Matching in Unemployed Men Aged 25–64 Years (n = 42,582), Canadian Census Health and Environment Cohort, 2006
| Variable | Unemployed Benefit Recipients, % | Unemployed Nonrecipients, % | |||
|---|---|---|---|---|---|
| Before Matching | Bias | After Matching | Bias | ||
| Age range, years | |||||
| 25–34 | 21.7 | 29.0 | 16.7 | 21.8 | 0.2 |
| 35–44 | 27.3 | 28.4 | 2.5 | 27.5 | 0.4 |
| 45–54 | 29.1 | 25.8 | 7.3 | 29.0 | 0.3 |
| 55–64 | 21.9 | 16.8 | 13.1 | 21.8 | 0.3 |
| Marital status | |||||
| Married or cohabitating | 63.6 | 50.2 | 27.4 | 62.6 | 2.1 |
| Single | 26.3 | 38.2 | 25.7 | 26.6 | 0.8 |
| Divorced, separated, or widowed | 10.1 | 11.7 | 4.9 | 10.8 | 2.1 |
| Household size, no. | |||||
| 1 | 14.5 | 17.0 | 6.9 | 15.2 | 1.9 |
| 2 | 29.2 | 24.3 | 11.3 | 28.8 | 1.1 |
| 3 | 22.4 | 19.6 | 6.9 | 22.3 | 0.2 |
| ≥4 | 33.8 | 39.1 | 11.0 | 33.7 | 0.2 |
| Immigrant status | |||||
| Foreign born | 14.5 | 25.4 | 27.6 | 14.7 | 0.3 |
| Urbanicity | |||||
| Rural | 45.9 | 30.2 | 32.7 | 45.4 | 0.9 |
| Region | |||||
| Eastern Canada | 30.5 | 8.0 | 59.6 | 31.9 | 3.8 |
| Central Canada | 53.6 | 60.6 | 14.2 | 52.0 | 3.2 |
| Western Canada | 14.0 | 28.1 | 35.2 | 14.3 | 0.7 |
| Northern Canada | 1.9 | 3.3 | 8.9 | 1.8 | 0.8 |
| Household income, quartile | |||||
| 4 (top) | 4.8 | 8.4 | 14.7 | 5.0 | 0.8 |
| 3 | 10.4 | 9.3 | 3.8 | 11.0 | 1.9 |
| 2 | 18.4 | 12.5 | 16.4 | 18.7 | 0.9 |
| 1 (bottom) | 66.4 | 69.8 | 7.3 | 65.3 | 2.3 |
| Education | |||||
| Postsecondary degree | 8.1 | 18.2 | 30.2 | 8.5 | 1.0 |
| Some postsecondary | 39.1 | 32.8 | 13.3 | 40.6 | 3.0 |
| Secondary degree | 21.5 | 20.3 | 2.7 | 21.4 | 0.1 |
| Less than secondary | 31.3 | 28.6 | 5.8 | 29.5 | 3.8 |
| Home ownership | |||||
| Owner | 66.5 | 45.5 | 43.2 | 66.1 | 0.8 |
| Occupation | |||||
| Professional | 4.3 | 6.0 | 7.9 | 4.1 | 1.0 |
| Managerial | 3.5 | 3.8 | 1.9 | 3.2 | 1.5 |
| Skilled, technical, or supervisory | 30.5 | 14.4 | 39.5 | 31.3 | 2.0 |
| Semiskilled | 33.5 | 16.9 | 38.9 | 32.4 | 2.5 |
| General | 17.2 | 10.3 | 22.7 | 17.4 | 2.3 |
| Data not available | 10.1 | 48.6 | 50.8 | 11.7 | 3.7 |
| Weeks worked in previous yeara | 23.0 | 14.6 | 50.8 | 22.6 | 2.6 |
| Hours worked in previous year | |||||
| Full time | 92.9 | 79.2 | 40.4 | 92.3 | 1.8 |
| Activity limitations at home | |||||
| No | 90.2 | 84.1 | 18.4 | 89.6 | 2.0 |
| Sometimes | 6.8 | 10.0 | 11.6 | 7.1 | 1.0 |
| Often | 2.9 | 5.8 | 14.2 | 3.3 | 1.9 |
| Activity limitations at work | |||||
| No | 90.1 | 87.1 | 9.5 | 89.5 | 2.0 |
| Sometimes | 6.6 | 7.6 | 3.8 | 6.9 | 1.3 |
| Often | 3.3 | 5.3 | 10.0 | 3.6 | 1.5 |
a Values are expressed as means.
The baseline hazard function for each flexible parametric survival model was estimated via restricted cubic splines with 2 interior knots placed at the 33rd and 67th percentiles of uncensored survival time. Provided that a sufficient number of knots are used, restricted cubic spline functions can fit a wide range of complex, underlying failure-time distributions (51). Thus, estimates obtained from flexible parametric survival models are generally robust to different specifications of the baseline hazard function (52, 53). We conducted sensitivity analyses to assess the impact of varying the number and placement of knots. In line with previous literature, we found that model results were robust to different specifications of the baseline hazard function. Model estimates and corresponding 95% confidence intervals were calculated using sampling and bootstrap weights provided by Statistics Canada.
RESULTS
We identified 2,105,595 individuals whose census records were successfully linked to the mortality database (Figure 1). Table 1 presents a description of the study cohort. Unemployed individuals exhibited a less favorable socioeconomic profile than did their employed counterparts. For example, the proportion of individuals in the highest quartile of household income was 29.1% among the employed, 6.5% among unemployed benefit recipients, and 8.7% among unemployed nonrecipients. Among the unemployed, we also observed important differences between benefit recipients and their nonrecipient counterparts. For example, benefit recipients worked more weeks during the preceding year and were more likely to have worked full time, to have been born in Canada, to be men, and to reside in Eastern Canada. Furthermore, although benefit recipients were less likely to be in the highest quartile of household income, they were also less likely to be in the lowest quartile of household income and much more likely to own their home. These patterns are similar to those reported in other Canadian surveys (36).
Covariate Balance Before and After Matching in Unemployed Women Aged 25–64 Years (n = 38,570), Canadian Census Health and Environment Cohort, 2006
| Variable | Unemployed Benefit Recipients, % | Unemployed Nonrecipients, % | |||
|---|---|---|---|---|---|
| Before Matching | Bias | After Matching | Bias | ||
| Age range, years | |||||
| 25–34 | 32.8 | 31.5 | 2.6 | 33.0 | 0.6 |
| 35–44 | 29.1 | 32.2 | 6.6 | 29.3 | 0.5 |
| 45–54 | 24.1 | 24.7 | 1.4 | 23.8 | 0.7 |
| 55–64 | 14.1 | 11.7 | 7.2 | 13.9 | 0.5 |
| Marital status | |||||
| Married or cohabitating | 73.5 | 60.1 | 28.8 | 73.1 | 0.9 |
| Single | 13.9 | 23.8 | 25.4 | 14.2 | 0.6 |
| Divorced, separated, or widowed | 12.5 | 16.1 | 10.2 | 12.7 | 0.6 |
| Household size, no. | |||||
| 1 | 7.2 | 9.4 | 8.1 | 7.5 | 1.3 |
| 2 | 26.1 | 25.0 | 2.5 | 25.8 | 0.8 |
| 3 | 27.6 | 22.6 | 11.5 | 27.7 | 0.2 |
| ≥4 | 39.1 | 43.0 | 7.8 | 39.0 | 0.1 |
| Immigrant status | |||||
| Foreign born | 21.6 | 31.5 | 22.6 | 22.6 | 2.2 |
| Urbanicity | |||||
| Rural | 33.5 | 23.9 | 21.1 | 32.2 | 2.7 |
| Region | |||||
| Eastern Canada | 22.5 | 8.0 | 41.3 | 23.1 | 1.6 |
| Central Canada | 55.2 | 62.5 | 14.8 | 54.5 | 1.4 |
| Western Canada | 21.3 | 27.5 | 14.6 | 21.4 | 0.3 |
| Northern Canada | 1.0 | 2.0 | 8.4 | 1.0 | 0.1 |
| Household income, quartile | |||||
| 4 (top) | 8.0 | 8.4 | 1.3 | 7.9 | 0.5 |
| 3 | 13.9 | 10.7 | 9.6 | 14.0 | 0.3 |
| 2 | 20.7 | 13.9 | 18.0 | 20.3 | 1.1 |
| 1 (bottom) | 57.4 | 67.0 | 19.8 | 57.9 | 0.9 |
| Education | |||||
| Postsecondary degree | 16.3 | 20.8 | 11.6 | 16.6 | 1.0 |
| Some postsecondary | 38.4 | 35.4 | 6.1 | 39.2 | 1.7 |
| Secondary degree | 26.4 | 23.0 | 7.8 | 26.2 | 0.4 |
| Less than secondary | 19.0 | 20.8 | 4.5 | 18.0 | 2.6 |
| Occupation | |||||
| Professional | 10.0 | 6.9 | 11.2 | 10.0 | 0.1 |
| Managerial | 5.5 | 2.7 | 13.9 | 5.8 | 1.5 |
| Skilled, technical, or supervisory | 19.7 | 9.5 | 29.0 | 19.4 | 0.9 |
| Semiskilled | 35.3 | 19.1 | 36.9 | 35.2 | 0.4 |
| General | 16.0 | 9.2 | 20.3 | 15.2 | 2.3 |
| Data not available | 13.6 | 52.5 | 90.8 | 14.5 | 2.2 |
| Home ownership | |||||
| Owner | 70.0 | 51.2 | 39.0 | 69.4 | 1.3 |
| Weeks worked in previous yeara | 23.3 | 13.9 | 54.8 | 23.0 | 1.4 |
| Hours worked in previous year | |||||
| Full time | 84.1 | 66.4 | 42.0 | 84.9 | 1.9 |
| Activity limitations at home | |||||
| No | 90.3 | 85.0 | 16.1 | 90.2 | 0.5 |
| Sometimes | 7.3 | 10.1 | 10.0 | 7.3 | 0.1 |
| Often | 2.4 | 4.9 | 13.1 | 2.5 | 0.7 |
| Activity limitations at work | |||||
| No | 91.3 | 89.4 | 6.3 | 90.1 | 1.3 |
| Sometimes | 6.0 | 6.5 | 1.7 | 6.3 | 1.0 |
| Often | 2.7 | 4.1 | 8.0 | 2.8 | 0.8 |
a Values are expressed as means.
Table 2 reports information on person-years, average follow-up time, number of deaths, and age-standardized mortality rates per 100,000 person-years. Average follow-up time was 9.9 years. Over the 10-year study, a total of 34,420 men and 17,980 women were recorded as deceased.
Figure 2 presents adjusted survival curves, survival differences, and hazard ratios from model 1, in which unemployed benefit recipients and unemployed nonrecipients were each compared with a reference group of employed individuals. Supporting information is presented in Web Tables 1–6. Mortality was lower among employed individuals relative to those who were unemployed at cohort inception. Among the unemployed, those who reported receiving benefits had lower mortality than those who did not report receiving benefits. Compared with the employed, being unemployed and receiving benefits (compared with being employed) was associated with 600 (95% confidence interval (CI): 460, 730) more deaths per 100,000 men and 230 (95% CI: 130, 34) more deaths per 100,000 women over the 10-year follow-up. By contrast, being unemployed and not receiving benefits was associated with 1,540 (95% CI: 1,390, 1,700) more deaths per 100,000 men and 950 (95% CI: 820, 1,080) more deaths per 100,000 women. Reported hazard ratios reflected these patterns. For example, compared with the employed, mortality at 1 year of follow-up was 24% higher (95% CI: 12, 36) among unemployed men receiving benefits and 22% higher (95% CI: 6, 41) among unemployed women receiving benefits. By contrast, mortality was 58% higher (95% CI: 47, 69) among unemployed men not receiving benefits and 54% higher (95% CI: 38, 71) among unemployed women not receiving benefits.
In Tables 3 and 4, we demonstrate how the kernel-matching procedure affected the balance of covariates between benefit recipients and nonrecipients. Standardized differences were below our conservative threshold of 5% after matching, indicating a satisfactory level of balance. Density plots depicting the distribution of propensity scores before and after matching are presented in Web Figures 1 and 2. A small number of benefit nonrecipients whose scores fell outside of the region of common support were excluded from the matched analysis (n = 19 men, n = 5 women).
Figure 3 presents adjusted survival curves, survival differences, and hazard ratios from model 2, in which unemployed benefit recipients were compared with a reference group of matched benefit nonrecipients (employed individuals were excluded from this model). Supporting information is presented in Web Tables 7–12. Mortality was consistently lower among unemployed individuals who reported receiving unemployment benefits relative to matched nonrecipients. For example, mortality at 2 years of follow-up was 18% lower (95% CI: 9, 26) among men receiving benefits and 30% lower (95% CI: 18, 40) among women receiving benefits. For men, the association between benefit recipiency and mortality was strongest after 5 years of follow-up and decreased thereafter. For women, the association was strongest after 3 years of follow-up, and more or less persisted over time. Over the 10-year follow-up, receipt of unemployment benefits was associated with 890 (95% CI: 560, 1,230) fewer deaths per 100,000 men and 1,070 (95% CI: 810, 1,320) fewer deaths per 100,000 women.
DISCUSSION
We examined whether receiving unemployment benefits is associated with lower mortality among the long-term unemployed. Using a national census cohort of approximately 2.1 million Canadians, we reproduced the widely reported association between unemployment and mortality (5, 6, 10, 12, 54, 55). Importantly, however, we found that mortality was significantly lower among unemployed individuals who reported receiving unemployment benefits, compared with matched nonrecipients. This finding is consistent with prior literature on the public health consequences of unemployment insurance (20–24), including research documenting a positive association between unemployment-benefit recipiency and self-rated health (32–37). The present study contributes to that body of work by providing a novel line of evidence indicating that unemployment-benefit recipiency is associated with reduced mortality.
Our findings are also in line with a larger body of research stressing the role of socioeconomic conditions—and the policies that shape them—as fundamental drivers of population health (56, 57). Loss of income and material hardship are well-established risk factors for illness (58–60). Evidence that benefit recipiency is associated with lower mortality may reflect the capacity of income support to buffer the socioeconomic impacts of job loss (24, 25, 32). Unemployment is also associated with substantial nonpecuniary costs, including lower levels of perceived status and self-esteem (26). As an institutional expression of the right to social protection, it is possible that unemployment insurance coverage diminishes the psychosocial consequences of job loss (26). This hypothesis is particularly interesting in light of emerging evidence that more punitive forms of income support (e.g., means-tested welfare) do not provide a similar health advantage (34, 35, 61).
Another possible explanation for our findings pertains to the role of unemployment insurance in mitigating the long-term “scars” of unemployment (28, 62). Job loss is a strong marker for future socioeconomic disadvantage (62). By contrast, unemployment-benefit recipiency has been shown to promote favorable labor market trajectories, including higher wages and better job quality (27). The association between benefit recipiency and lower mortality, therefore, might reflect the cumulative socioeconomic advantages afforded to benefit recipients relative to their nonrecipient counterparts.
Our study has important limitations. We were unable to rule out the possibility of confounding bias resulting from the endogenous relationship between benefit coverage and health status. By definition, individuals who qualify to receive unemployment benefits are expected to exhibit better baseline health characteristics than are nonrecipients. Although we incorporated an extensive set of control variables, it is possible that residual or unmeasured sources of confounding have influenced our results. One notable constraint in this regard was the limited information available on respondents’ baseline health status and health behaviors.
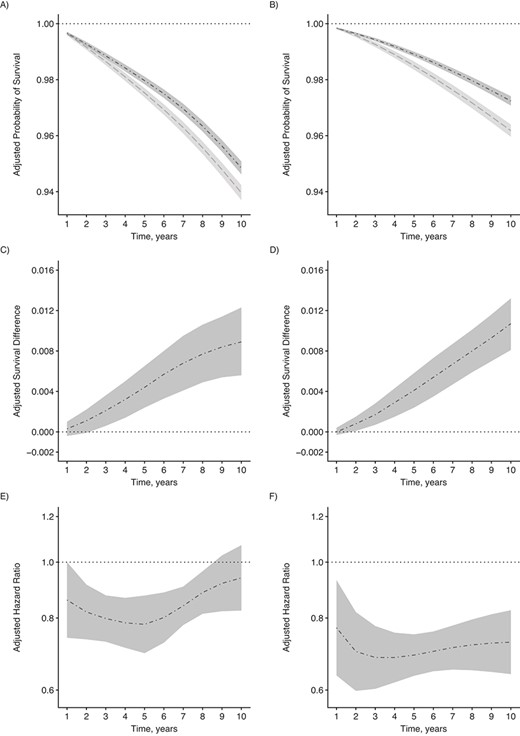
Adjusted survival curves, survival differences, and hazard ratios for all-cause mortality, 2006 Canadian Census Health and Environment Cohort. A and B) Probabilities of survival among unemployed benefit recipients (dash-dotted line) and propensity score–matched unemployed nonrecipients (dashed line) for men (A) and women (B). C and D) Survival differences, comparing unemployed benefit recipients (dash-dotted line) with the reference group of propensity score–matched unemployed nonrecipients for men (C) and women (D). E and F) Hazard ratios comparing unemployed benefit recipients (dash-dotted line) with the reference group of propensity score–matched unemployed nonrecipients for men (E) and women (F). Estimates are presented with corresponding 95% confidence intervals and adjusted for age, marital status, household size, immigrant status, urbanicity, region, pre-transfer household income, education, home ownership, occupation, labor market history, and activity limitations. Hazard ratios are plotted on a log scale.
A second important limitation concerns sampling bias arising from differential probabilities of nonresponse and linkage. We addressed this issue by applying a sampling weight accounting for differential nonresponse and linkage rates according to characteristics such as age, education, and income. However, there remains a possibility of bias resulting from unobserved differences between respondents who were successfully integrated into the study cohort and those who were not.
Third, although we matched respondents on employment characteristics based on the previous calendar year, we lacked information on respondents’ labor market history before 2005. Our inability to account for pre-2005 characteristics represents an important source of unobserved confounding. A related problem is that our data did not permit us to identify the specific time at which current unemployment spells began. Prior evidence suggests that unemployment duration differs between benefit recipients and nonrecipients (63). These differences are another source of unmeasured confounding potentially biasing our results.
Fourth, we excluded certain portions of the economically active population from our analytic sample, which introduces the potential for selection bias. For example, because of a lack of accurate information on their benefit status, we excluded individuals who were unemployed on census day but had worked at some point during the preceding 20 weeks. Our findings, therefore, may not be generalizable to the short-term unemployed, whose underlying characteristics are known to differ from those of the long-term unemployed (64). A threat to internal validity also arises from the exclusion of the short-term unemployed. Specifically, by imposing this restriction on the analytic sample, we introduced the potential for collider-stratification bias—a form of selection bias that may have resulted in a distorted association between unemployment-benefit recipiency and mortality (65, 66).
A fifth methodological consideration is that, due to an absence of repeated measures, we adopted an intention-to-treat approach that did not account for employment and benefit transitions over the follow-up period. However, we hypothesize that unemployment benefit coverage is related to health in part due to the impact of coverage on later labor market outcomes (27, 28, 63). In this sense, a strength of our intention-to-treat approach is its suitability for estimating the net real-world impact of receiving unemployment benefits as a form of treatment. Another issue stemming from our measurement of benefit status concerns the mandatory 2-week waiting period preceding initial benefit payments. As a result of this waiting period, benefit recipients who lost their jobs at the end of December 2005, began collecting EI payments in 2006, and did not receive any EI income in 2005 were misclassified as benefit nonrecipients. We were unable to identify these individuals and address any resulting bias.
Finally, we relied on self-reported measures of employment status and, for a portion of the sample, self-reported measures of benefit recipiency. Prior research suggests that social desirability bias contributes to underreporting of unemployment and government assistance (67). Resulting measurement error may have biased our results.
CONCLUSIONS
Our findings indicate that receiving unemployment benefits is associated with lower mortality among the long-term unemployed. Unemployment remains a persistent challenge in many jurisdictions throughout the world, and large and growing segments of the working population remain outside the proverbial reach of established unemployment insurance systems (13). The COVID-19 pandemic has highlighted the pressing nature of this problem and the urgent need for policy action to address it (23, 38, 39, 68). Beyond alleviating the social and economic consequences of increasing unemployment, the results of the present study suggest that expanding access to unemployment benefits may improve population health and reduce health inequalities associated with job loss.
ACKNOWLEDGMENTS
Author affiliations: Institute for Work & Health, Toronto, Ontario, Canada (Faraz Vahid Shahidi); Division of Epidemiology, Dalla Lana School of Public Health, University of Toronto, Toronto, Ontario, Canada (Abtin Parnia); and Department of Sociology, University of Toronto, Toronto, Ontario, Canada (Abtin Parnia).
The study was supported with funding from the Canadian Institutes of Health Research, the Institute for Work & Health, and the Social Sciences and Humanities Research Council.
The authors thank Dr. Arjumand Siddiqi, Dr. Peter Smith, and Dr. Patricia Louie for their feedback on early drafts of the manuscript.
In accordance with the Statistics Act of Canada, the data underlying this article cannot be shared publicly. This is to ensure the privacy of individuals that participated in the study. Researchers may request access to the data by submitting an application to the Canadian Research Data Centre Network. Information about the application procedure can be found at the following link: https://crdcn.org/research.
The funding organizations played no role in the design and conduct of the study; in the collection, management, and analysis of the data; or in the preparation, review, and approval of the manuscript.
Conflict of interest: none declared.

