


Abstract
In the United States, hepatitis C virus (HCV) transmission is rising among people who inject drugs (PWID). Many regions have insufficient prevention intervention coverage. Using modeling, we investigated the impact of scaling up prevention and treatment interventions on HCV transmission among PWID in Perry County, Kentucky, and San Francisco, California, where HCV seroprevalence among PWID is >50%. A greater proportion of PWID access medication-assisted treatment (MAT) or syringe service programs (SSP) in urban San Francisco (established community) than in rural Perry County (young, expanding community). We modeled the proportion of HCV-infected PWID needing HCV treatment annually to reduce HCV incidence by 90% by 2030, with and without MAT scale-up (50% coverage, both settings) and SSP scale-up (Perry County only) from 2017. With current MAT and SSP coverage during 2017–2030, HCV incidence would increase in Perry County (from 21.3 to 22.6 per 100 person-years) and decrease in San Francisco (from 12.9 to 11.9 per 100 person-years). With concurrent MAT and SSP scale-up, 5% per year of HCV-infected PWID would need HCV treatment in Perry County to achieve incidence targets—13% per year without MAT and SSP scale-up. In San Francisco, a similar proportion would need HCV treatment (10% per year) irrespective of MAT scale-up. Reaching the same impact by 2025 would require increases in treatment rates of 45%–82%. Achievable provision of HCV treatment, alongside MAT and SSP scale-up (Perry County) and MAT scale-up (San Francisco), could reduce HCV incidence.
An estimated 3.5 million individuals are infected with hepatitis C virus (HCV) in the United States (1), with annual mortality rates greater than for HIV (2). In the United States, over 80% of HCV transmission occurs among people who inject drugs (PWID) (3).
Harm-reduction services for PWID, such as medication-assisted treatment (MAT) and syringe service programs (SSPs), can reduce the risk of HCV acquisition (4, 5). All-oral direct-acting antivirals (DAAs) cure HCV in 8–12 weeks (6, 7). Modeling from non-US settings (8–13) has shown that scaling harm-reduction up alongside treatment with DAAs could substantially reduce the HCV burden. This is crucial for achieving the World Health Organization (WHO) and US National Academies of Sciences, Engineering, and Medicine (NASEM) (14) HCV elimination targets of reducing HCV incidence by 90% by 2030 (14–16).
The availability of harm-reduction services (17–19) varies across the United States, with some cities having established SSPs (20, 21) while other settings have none (17, 18, 22). PWID demographics and their associated HCV transmission patterns (23, 24) also vary geographically. Most large cities have established PWID populations (25) and stable HCV infection rates, while rural settings have an expanding younger demographic of PWID (22) with increasing HCV transmission (24). This expansion is particularly acute in Appalachia, where the prevalence of injecting and rate of new HCV infections have increased 3-fold between 2006 and 2012 (24, 26).
In this study, we modeled the epidemic situation among PWID in San Francisco (California) and Perry County (Kentucky), capturing differences in harm-reduction availability, HCV epidemiology, and injecting-drug-use dynamics. In line with WHO and the US National Academies of Sciences, Engineering, and Medicine HCV-elimination strategies (14, 15), we projected the required scale-up of harm-reduction interventions and HCV treatment to decrease HCV incidence in these settings by 90% by 2030 and 2025.
METHODS
Model description
We developed 2 deterministic HCV transmission models among PWID (see Web Figures 1–4, available at https://dbpia.nl.go.kr/aje), one for each setting. The models differed in several ways due to differences in data availability.
The modeled PWID populations at both sites were stratified by risk status (high risk defined as sharing works (syringes/cottons/cookers) in past 6 months), intervention status (on MAT and/or SSP or neither), and HCV-infection status. PWID demographics differed between the sites, with the Perry County model stratifying by injecting duration (in years, <3 and ≥3) and the San Francisco model stratifying by age (in years, 15–24, 25–29, 30–49, and ≥50). Both models incorporated time-varying rates of initiating injecting, with PWID leaving due to injecting cessation (unaffected by MAT status) or mortality (drug-related or not). Injecting cessation is via temporary cessation in the San Francisco model (if relapse does not occur) but not in the Perry County model, due to insufficient data. Due to the long timeframe associated with HCV disease progression and mortality (27), we assumed no additional mortality due to HCV complications or the impact of HIV coinfection on disease progression, with the former confirmed by PWID mortality studies in North America (28, 29).
In both settings, individuals initiate injecting as low or high risk and as HCV-susceptible without harm reduction. PWID can transition between risk and intervention states over time. HCV transmission occurs at a per capita rate, dependent on chronic HCV infection prevalence (RNA-positive), with transmission risk reduced if PWID are on harm-reduction interventions (5) but increased if they are high risk or young/new. Mixing between PWID to form transmission contacts ranges from random to fully like-with-like, either by age or duration of injecting and risk status.
Once infected, some individuals spontaneously clear infection (30, 31), moving to the previously infected group, while the remainder develop chronic HCV infection. Chronic HCV infection is lifelong unless treated, which typically results in cure (sustained viral response). We assume all PWID have equal access to treatment irrespective of disease stage because we are modeling to maximize prevention benefits. Cured individuals are susceptible to reinfection at the same level as for primary infection, independent of age, injecting risk, and intervention status. Those not cured remain chronically HCV infected but can be retreated.
Web Appendices 1 and 2 give further model details.
Model parameterization and calibration
Most model parameters for Perry County and San Francisco are context-specific. Exceptions were the efficacy of MAT and SSP, assumed to individually reduce transmission risk by 50% and 56%, respectively (5), with efficacies multiplied if PWID access both. Both models assumed no HCV treatment at baseline because local experts suggest that treatment for active PWID was negligible before DAAs became available. Model parameters are given in Tables 1–3, with most parameters having uncertainty distributions assigned to them (usually 95% confidence intervals). These distributions were randomly sampled to give 5,000 parameter sets for each setting, with this variability being propagated to the model projections. For each sampled parameter set, unknown model parameters (see below) were estimated through model calibration to data using a nonlinear least squares algorithm in MATLAB (MathWorks, Natick, Massachusetts), giving a large number of baseline model fits for each setting. This model calibration was checked to ensure it accurately fit the data.
Shared Model Parameters (Natural History and Intervention-Related Parameters) and Uncertainty Bounds for Perry County, Kentucky, and San Francisco, California
| Parameter | Mean | 95% CI | Point Estimate | Range | Distribution | References |
|---|---|---|---|---|---|---|
| Prevention Intervention Effectiveness Parameters | ||||||
| Relative risk of acquiring HCV while on MATa | 0.5 | 0.4, 0.63 | Log-normal | (5) | ||
| Relative risk of acquiring HCV while on SSPa | 0.44 | 0.24, 0.80 | Log-normal | (5) | ||
| HCV Treatment and Clearance Parameters | ||||||
| SVR rate, % | 85–95 | Uniform | (7) | |||
| Duration of treatment, weeks | 12 | N/A | (7) | |||
| Treatment start yearb | 2017 | N/A | ||||
| Average proportion of infections that clear spontaneously | 0.22–0.29 | Uniform | (30) | |||
Abbreviations: CI, confidence interval; HCV, hepatitis C virus; MAT, medication-assisted treatment; N/A, not applicable; SSP, syringe service programs; SVR, sustained viral response.
a The relative risk of acquiring HCV while on MAT + SSP is the product of relative risk for MAT and SSP.
b The treatment number per year is varied depending on scenario.
Model Parameters and Calibration Data With Uncertainty Bounds for Perry County, Kentucky, Primarily Using Data From the Social Networks Among Appalachian People Study, Begun in 2008
| Parameter | Mean | 95% CI | Point Estimate | Range | Distribution | Source | Notes |
|---|---|---|---|---|---|---|---|
| PWID and HCV-Related Parameters | |||||||
| HCV seroprevalence among PWID injecting <3 years, % | 36.0 | 22.9, 50.8 | Normal | Analysis of SNAP data | Used to calibrate HCV transmission risk per year (among low-risk PWID not on MAT/SSP and injecting <3 years (rate = 0.23, 95% CrI: 0.14, 0.39)) | ||
| HCV seroprevalence among PWID injecting ≥3 years, % | 55.8 | 50.4, 61.3 | Normal | Analysis of SNAP data | |||
| HCV seroprevalence among all PWID, % | 53.3 | 48.2, 58.3 | Normal | Analysis of SNAP data | |||
| HCV incidence per 100 person-years | 18.3 | 14.9, 22.4 | Normal | Analysis of SNAP data | |||
| Population size of PWIDa | 560–840 | Uniform | Analysis of SNAP data | Estimated 700 PWID from analysis of SNAP data. Used to calibrate the rate that individuals initiate injecting per year to fit the sampled population size in 2009 and scale up in injecting after 1990. | |||
| Fold increase in number of individuals initiating injecting between 1990 and 2000. | 8 | Analysis of SNAP data | Used to calibrate the increase in initiation rate of injecting between 1990 and 2000 | ||||
| Overall duration of injecting, years | 5–25 | Uniform | Young expanding population of injectors, so uncertainty in duration of injecting—wide range assumed | ||||
| Overall drug and nondrug mortality rate per year, % | 1.0 | Poisson | Analysis of SNAP data | ||||
| Rate ratio for acquiring HCV if injecting <3 years vs. ≥3 years | 2.2 | 1.4, 3.6 | Log-normal | Analysis of SNAP data | |||
| High-Risk Parameters | |||||||
| Percentage of PWID who are at high riskb in 2009, % | 14.5 | 13.0, 16.2 | Normal | Analysis of SNAP data | |||
| Rate that PWID move from high to low-risk per year | 0.47 | 0.3, 0.6 | Normal | Analysis of SNAP data | |||
| Rate ratio for acquiring HCV if high riskb compared with if low risk | 3.2 | 2.1, 5.0 | Log-normal | Analysis of SNAP data | |||
| Proportion of PWID doing like-with-like mixing by risk status (0 means random mixing and 1 means full like-with-like mixing) | 0–0.5 | Uniform | No data, so wide range assumed | ||||
| Proportion of PWID doing like-with-like mixing by duration of injecting (0 means random mixing and 1 means full like-with-like mixing) | 0.4–0.8 | Uniform | Analysis of SNAP data | Fitted to give 87.3% of PWID injecting ≥3 years with PWID injecting ≥3 years | |||
| Intervention Parameters | |||||||
| Year MAT started in Perry County | 1990–2000 | Uniform | |||||
| Rate of leaving MAT/SSP per 100 person-yearsc | 132–352 | Uniform | Analysis of SNAP data | Gives 3.5–9 months on MAT/SSP | |||
| Coverage of MAT in 2009, % | 4.7 | 3.8, 5.8 | Normal | Analysis of SNAP data | Used to find the recruitment rate onto MAT | ||
Abbreviations: CI, confidence interval; CrI, credibility interval; HCV, hepatitis C virus; PWID, people who inject drugs; SNAP, Social Networks Among Appalachian People; MAT, medication-assisted treatment; SSP, syringe service programs.
a The range for PWID population size is within 20% of the estimated 700 PWID.
b High risk is defined as sharing works (syringes/cottons/cookers) in the past 6 months.
c The recruitment rate onto SSP calibrated for the different intervention scenarios—no SSP at baseline in Perry County.
Model Parameters and Calibration Data With Uncertainty Bounds for the Analyses for San Francisco, California, Using Data from the National HIV Behavioral Surveillance (United States), Urban Health Study (United States), and UFO Study (San Francisco)
| Parameter | Mean | 95% CI | Point Estimate | Range | Distribution | Source | Notes |
|---|---|---|---|---|---|---|---|
| PWID- and HCV-Related Parameters | |||||||
| HCV antibody prevalence in 1999 among those aged 15–29 years, % | 60.8 | 53.9, 67.5 | Normal | (35) | |||
| HCV antibody prevalence in 1999 among those aged 30–49 years, % | 93.4 | 92.1, 94.6 | Normal | (35) | |||
| HCV antibody prevalence in 1999 among those ≥50 years old, % | 96.3 | 94.3, 98.7 | Normal | (35) | Used to calibrate HCV transmission risk per year (among low-risk PWID not on MAT/SSP in those aged <30 years (rate = 0.39, 95% CrI: 0.26, 0.58) and in those aged ≥30 years (rate = 0.14, 95% CrI: 0.08, 0.28)) | ||
| HCV incidence per 100 person-years in 2001 among those aged <30 years | 25.1 | 18.7, 32.9 | Normal | (32) | Used to calibrate HCV transmission risk per year (given above) | ||
| Proportion of PWID that start injecting during age range 15–24 years | 0.7586 | N/A | (34) | Little uncertainty so point estimate used. Calibrated to data on age of first injection from UHS (34) and size estimates. | |||
| Proportion of PWID that start injecting during age range 25–29 years | 0.1247 | N/A | (34) | Little uncertainty so point estimate used. Calibrated to data on age of first injection from UHS (34) and size estimates. | |||
| Proportion of PWID that start injecting during age range 30–49 years | 0.1167 | N/A | (34) | Little uncertainty so point estimate used. Calibrated to data on age of first injection from UHS (34) and size estimates. | |||
| No. of years in age group 15–24 years | 7.2 years | N/A | UHS data (34) | PWID aged 15–24 years stay <10 years in first age group because, on average, enter at age older than 15 | |||
| No. of years in age group 25–29 years | 5.0 years | N/A | UHS data (34) | ||||
| No. of years in age group 30–49 years | 20.0 years | N/A | UHS data (34) | ||||
| Population size of PWID aged 15–29 years | 3,052–8,048 | Uniform | (25) | ||||
| Population size of PWID aged ≥30 years | 10,988–28,970 | Uniform | (25) | ||||
| Percentage of ≥30 years old PWID aged 30–49 years (%) | 42.5–52.9 | Uniform | (25) | Population size estimates (25) and reanalysis of UHS data to get proportion of those aged ≥30 years who are 30–49 years old. Used to calibrate the rate that individuals initiate injecting per year. | |||
| Overall drug and nondrug related mortality rate per year, % | 0.91 | Poisson | (65) | ||||
| Temporary cessation rate per year for those aged 15–29 years | 0.16 | 0.1, 0.2 | Uniform | (36) | |||
| Relapse rate to injecting per year for those aged 15–29 years | 0.56 | 0.4, 0.7 | Uniform | (36) | |||
| Relapse rate to injecting per year for those aged ≥30 years | 0.30 | 0.2, 0.6 | Uniform | (36) | |||
| Years prior to 2017 when decrease in PWID initiation rate started | 10–30 | Uniform | Recruitment into injecting thought to have dropped in past, but uncertain, so large range | ||||
| Percentage of mixing being like-with-like by age among those aged <30 years,% | 54–62 | N/A | Range used to determine proportion of PWID doing like-with-like mixing by age (0 means random mixing and 1 means full like-with-like mixing) (0.0004–0.46) | ||||
| High-Risk Parameters | |||||||
| Percentage of PWID who are high riska before 2002, % | 61.1 | 58.7, 63.5 | Normal | Analysis of UFO data | |||
| Percentage of PWID who are high riska after 2002,% | 48.3 | 43.9, 52.6 | Normal | Analysis of UFO data | |||
| Rate that PWID move from high to low risk per year | 1.6 | 1.3, 1.9 | Normal | Analysis of UFO data | |||
| Rate ratio for acquiring HCV if high riska compared with if low risk | 1.6 | 1.3, 2.1 | Log-normal | Analysis of UFO data | |||
| Proportion of PWID doing like-with-like mixing by risk status (0 means random mixing and 1 means full like-with-like mixing) | 0–0.5 | Uniform | No data so wide range assumed | ||||
| Intervention Parameters | |||||||
| Year MAT started in San Francisco | 2000 | Point estimate | Coverage low before 2000 (UFO Study data) | ||||
| Rate leave MAT/SSP per year | 1.0 | 0.7, 1.6 | Normal | (37) | This gives 0.99 years (7.5–18 months on MAT/SSP) | ||
| Coverage of MAT in 2004,% | 2.6 | 1.8, 3.7 | Normal | Analysis of UFO data | Used to find the recruitment rate onto MAT | ||
| Coverage of MAT in 2015,% | 12.2 | 10.3, 14.4 | Normal | Analysis of UFO data | Used to find the recruitment rate onto MAT | ||
| Coverage of SSP in 1997 among those aged 15–29 years,% | 70.6 | 52.5, 84.9 | Normal | Analysis of NHBS data | UHS data from 1997 has similar coverage to NHBS data from 2012, with NHBS data used to give coverage by age. Used to find the recruitment rate onto SSP for different age groups. | ||
| Coverage of SSP in 1997 among those aged 30–49 years,% | 86.0 | 81.0, 90.1 | Normal | Analysis of NHBS data | UHS data from 1997 has similar coverage to NHBS data from 2012, with NHBS data used to give coverage by age. Used to find the recruitment rate onto SSP for different age groups. | ||
| Coverage of SSP in 1997 among those aged ≥50 years,% | 88.1 | 83.7, 91.6 | Normal | Analysis of NHBS data | UHS data from 1997 has similar coverage to NHBS data from 2012, with NHBS data used to give coverage by age. Used to find the recruitment rate onto SSP for different age groups. | ||
Abbreviations: CI, confidence interval; CrI, credibility interval; HCV, hepatitis C virus; MAT, medication-assisted treatment; NHBS, National HIV Behavioral Surveillance; PWID, people who inject drugs; SSP, syringe service programs; UHS, Urban Health Study.
a High risk is defined as sharing works (syringes/cottons/cookers) in the past 6 months.
Perry County, Kentucky
The Perry County model was parameterized primarily using data from the Social Networks Among Appalachian People (SNAP) study, analyzed for this project (Table 2) (22). This ongoing longitudinal study of PWID from Perry County started in 2008, initially recruiting through respondent-driven sampling. See Web Appendix 1 for details.
The time-varying number of individuals initiating injecting annually and their cessation rate were calibrated to give the estimated PWID population size for Perry County in 2009 (560–840; analysis for this project gives an estimate of 700, and we include 20% variance for uncertainty), while assuming an 8-fold increase in the number of individuals initiating injecting over 1990–2000 (Web Figure 5), consistent with other data (26).
Based on SNAP data, we assumed 14.5% of PWID were high risk (reported sharing works in last 6 months), with an increased HCV-acquisition risk (3.2-fold). Movement of PWID from low to high risk was estimated through model calibration while assuming the rate that PWID transition from high to low risk was 0.47 per year. SNAP data suggested that MAT coverage was 4.7% in 2009, but there was no SSP. The recruitment rate onto MAT was derived through calibration to this MAT coverage, while assuming stable coverage and a mean duration on MAT of 6 months based on SNAP data. We assumed PWID injecting for <3 years had greater HCV-acquisition risk (2.2-fold) compared with those injecting for ≥3 years. Because SNAP data (22) suggested that 87.3% of PWID injecting ≥3 years have an injection partner that has injected ≥3 years, we assumed this same like-with-like mixing in the model. We assumed PWID inject for 5–25 years.
The baseline HCV-transmission rate (among low-risk PWID not accessing harm-reduction and injecting for ≥3 years) was estimated through model calibration to the HCV seroprevalence among those injecting <3 years in 2009 (36.0%). SNAP data on HCV seroprevalence in those injecting ≥3 years in 2009 and HCV incidence over 2008–2015 (PWID injecting <3 years or ≥3 years) were used for model validation.
San Francisco, California
The San Francisco model was parameterized with data from the UFO Study (32, 33) (young adult PWID, aged <30 years, enrolled in prospective follow-up since 2000), the National HIV Behavioral Surveillance (NHBS) System for PWID (17, 18, 21, 34), and the Urban Health Study (UHS) (35) (Table 3). See Web Appendix 2 for details.
The age individuals start injecting came from Urban Health Study and NHBS data (17, 34), while the temporary cessation rate (cessation incidence 16% per 100 person-years) for PWID aged <30 years and injecting relapse rates (incidence of relapse 56 per 100 person-years for those aged 15–29 years and 30 per 100 person-years for those aged ≥30 years) came from UFO data (36). The temporary cessation rate of PWID aged ≥30 years, permanent cessation rate, and time-varying number of individuals initiating injecting annually were estimated through calibrating the model to the estimated number of PWID aged <30 years (approximately 6,000) and ≥30 years (approximately 20,000) in San Francisco for 2007 (25) and the proportion aged ≥30 years (34).
Time-varying recruitment rates onto MAT and SSP were estimated through calibrating a submodel to the changing coverage of MAT and SSP, while assuming a duration on MAT/SSP of 1.0 year (37). Based on UFO data, we assumed MAT started in 2000 and then increased to 2.6% coverage by 2004 and 12.2% by 2015. SSP started in 1989 (20) and was assumed to scale up to high coverage (83.7% obtained needles from a SSP in last month) by 1997 (20) and then remain stable (17, 18).
Based on UFO data, we assumed 61.1% of PWID were at high risk (reported sharing works in last 6 months) before 2002 and 48.3% after 2002, with an increased HCV-acquisition risk (1.6-fold per UFO data analysis). Movement of PWID from low to high risk before and after 2002 was estimated through model calibration while assuming the rate at which PWID transition from high to low risk is 1.6 annually (UFO data) (i.e., over 100% generally transition from high to low risk in a year).
We estimated baseline model transmission rates (among low-risk PWID not accessing harm-reduction) for PWID aged <30 and ≥30 years by calibrating the model to HCV incidence among PWID of <30 years for 2000–2001 (25.1 per 100 person-years) (32, 38) and HCV seroprevalence among PWID aged ≥50 years (96.3%) in 1999 (35). Estimates of HCV seroprevalence in other age groups were used for model validation. Last, because UFO data suggests that 58.0% of PWID aged <30 years have an injection partner aged <30 years, we assumed this same like-with-like mixing in the model.
All modeling was performed using MATLAB, version R2018a (MathWorks). Further information on the model parameterization and calibration is in Web Appendices 1 and 2.
Model analyses
The baseline model fits for each setting were used to estimate the impact on chronic HCV prevalence and incidence of scaling MAT up to 50% coverage and SSP coverage in Perry County up to the same level as San Francisco (84%) (“full harm-reduction”), with or without treating 20 or 50 per 1,000 PWID, at any stage of disease progression, with DAAs annually, all from 2017 onwards. For each baseline model fit, we then determined the annual HCV-treatment rate required among PWID to decrease HCV incidence by 90% by 2025 or 2030, with or without full harm-reduction.
Uncertainty analysis
To ascertain which parameters are important for determining variability in the projections across the baseline model fits, a linear regression analysis of covariance (ANCOVA) (39) was performed on the projected initial percentage of chronically HCV-infected PWID needing HCV treatment each year to reduce incidence by 90% by 2030 with full harm-reduction. The proportion of the sum of squares contributed by each parameter was calculated to determine each parameters’ importance to the variability in our projections.
RESULTS
Baseline epidemic projections and illustrative examples
For Perry County, 5,000 baseline model fits were obtained (see Figure 1, Web Appendix 3 and Web Figures 6 and 7), with 90% of these fits lying within the 95% confidence intervals of one of the validation data points (see Methods) and 33.6% lying within 2 or more.
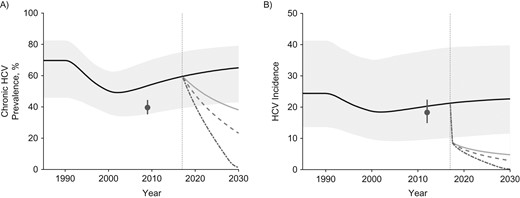
The projected impact of different intervention scenarios from 2017 to 2030 on hepatitis C virus (HCV) in Perry County, Kentucky. A) Chronic prevalence among all people who inject drugs (PWID) for 1990–2030; B) incidence among susceptible PWID for 1990–2030. Median projections for each intervention scenario applied to the baseline model fits are shown, with the 95% credibility intervals (CrIs) included only for the no-intervention scale-up scenario for the baseline model fits. Medication-assisted treatment (MAT) is assumed to start between 1990 and 1999 and is scaled up from 2017 to 50% coverage. Both syringe service programs (SSP) and HCV treatment are started in 2017, SSP scaling up to 84% coverage and treatment to either 20 per 1,000 PWID or 50 per 1,000 PWID, respectively. The gray points show chronic HCV prevalence and incidence data from the Social Networks Among Appalachian People (SNAP) study, which was not fitted but is shown for comparison. Note that the model was fitted to data on antibody prevalence among those injecting <3 years in 2009 (36.0%, 95% confidence interval: 22.9, 50.8). Incidence is estimated among susceptible PWID. In both panels the pale gray area shows the 95% CrI for the no-intervention scale-up scenario; the solid black line shows the median of model runs for the no-intervention scale-up scenario; the pale gray solid line shows the median of model for scale-up to 84% SSP and 50% MAT coverage (full harm-reduction; the dashed medium-gray line shows the median of model runs for full harm-reduction and HCV treatment of 20 per 1,000 PWID annually; the dot-dashed dark-gray line shows the median of model runs for full harm-reduction and HCV treatment of 50 per 1,000 PWID annually; the solid dark-gray dot and vertical line shows the data estimate and its 95% confidence interval from the SNAP study, and the vertical dotted gray line shows when MAT, SSP, and HCV treatment are started.
For Perry County, the model projected that chronic HCV prevalence and incidence fell from 1990 due to increasing susceptible PWID entering the population. Chronic HCV prevalence then increases after 2000 as the PWID population begins to stabilize (Figure 1). HCV chronic prevalence is estimated to be 59.5% in 2017 and, without intervention scale-up, is projected to increase to 65.0% by 2030. Similarly, from 2017 to 2030, HCV incidence is projected to increase from 21.3 to 22.6 per 100 person-years. Conversely, with full harm-reduction scale-up from 2017, HCV chronic prevalence and incidence would decrease by 35.3% (95% credibility interval (95% CrI): 12.7, 71.5) and 77.0% (95% CrI: 47.6, 92.2) by 2030, respectively. Additionally, treating 20 per 1,000 or 50 per 1,000 PWID annually with DAAs (equivalent to 3.4% or 8.3% of chronic HCV infections being treated in the first year; Web Table 1) would decrease incidence to low levels, by 86.0% (95% CrI: 60.1, 99.4) or 99.2% (95% CrI: 79.7, 100.0) over 2017–2030, respectively.
For San Francisco, 997 baseline model fits were obtained (see Figure 2, Web Appendix 3 and Web Figures 8 and 9), with 89.4% of these model fits lying within the 95% confidence intervals of one of the validation data points (see Methods) and 37.1% lying within 2.
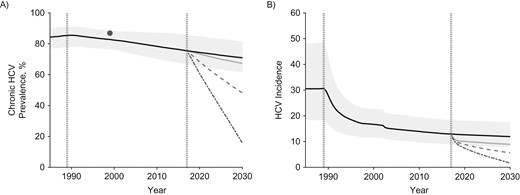
The projected impact of different intervention scenarios from 2017 to 2030 on hepatitis C virus (HCV) in San Francisco, California. A) Chronic prevalence among all people who inject drugs (PWID) for 1990–2030; B) incidence among susceptible PWID for 1990–2030. Median projections for each intervention scenario applied to the baseline model fits are shown with the 95% credibility intervals (CrIs) only included for the no-intervention scale-up scenario for the baseline model fits (no intervention scale-up). Syringe service programs (SSP) are assumed to start in 1989 and to be stable at a high coverage (84%) from 1997. Medication-assisted treatment (MAT) is assumed to scale up to 50% coverage from 2017, and HCV treatment also starts in 2017 with either 20 per 1,000 PWID or 50 per 1,000 PWID treated annually. The model was fitted to data on HCV incidence in PWID aged <30 years for 2000–2001 (25.1 per 100 person-years, 95% confidence interval (CI): 18.7, 32.9) (32, 38) and HCV seroprevalence among PWID aged ≥50 years (96.3%, 95% CI: 94.3, 98.7) in 1999 (35). Incidence is estimated among susceptible PWID. No incidence data estimate is shown for the whole PWID population because of a lack of data, whereas estimated chronic HCV prevalence for the whole population is shown in panel A; this estimate was obtained from an available HCV seroprevalence data estimate for 1999 by adjusting it for the modeled proportion of antibody-positive PWID that have chronic HCV infection. In both panels, the pale gray area shows the 95% CrI for the no-intervention scale-up scenario; the solid black line shows the median of model runs for the no intervention scale-up scenario; the pale-gray solid line shows the median of model for scale-up to 50% MAT coverage (alongside 84% SSP coverage—full harm-reduction); the dashed medium-gray line shows the median of model runs for full harm-reduction and HCV treatment of 20 per 1,000 PWID annually; the dot-dashed dark-gray line shows the median of model runs for full harm-reduction and HCV treatment of 50 per 1,000 PWID annually; the vertical dotted-gray line in 1989 shows when SSP was scaled up in San Francisco, and the vertical dotted gray line in 2017 shows the point we model scale-up of MAT and HCV treatment from; the solid dark-gray dot and vertical line in panel A show the data estimate and 95% confidence interval from the Urban Health Study.
For San Francisco, the model projects that HCV incidence decreased considerably after 1989 due to the scale-up in SSP, with chronic HCV prevalence decreasing more slowly. By 2017, HCV incidence stabilizes at 12.9 per 100 person-years, and chronic HCV prevalence is projected to be 75.5% (Figure 2). Without intervention scale-up, both are projected to remain stable until 2030. Conversely, scaling up to full harm-reduction would decrease chronic HCV prevalence by 10.7% (95% CrI: 7.0, 15.8) and incidence by 30.4% (95% CrI: 22.7, 37.4) by 2030. Additionally, treating 20 per 1,000 or 50 per 1,000 PWID (equivalent to 2.7% or 6.6% of chronic HCV infections being treated in the first year; Web Table 2) would decrease incidence by 56.3% (95% CrI: 44.9, 63.6) or 86.9% (95% CrI: 75.3, 95.7) by 2030, respectively.
Scaling up treatment to reach HCV-elimination targets
With or without full harm-reduction scale-up, a 90% reduction in incidence is possible in Perry County and San Francisco by 2030 if sufficient HCV treatment occurs (Figure 3). In San Francisco, scaling up to full harm-reduction has little impact due to existing moderate to high levels of coverage, with 8%–9% of chronically HCV-infected PWID initially needing treatment each year (1,418–1,574 treatments in first year; 56–63 per 1,000 PWID annually) to reduce incidence by 90% by 2030. Conversely, in Perry County, scaling up to full harm-reduction has more impact, with the resulting HCV-treatment rate being less than San Francisco (4.7% of chronically HCV-infected PWID initially needing treatment each year—22 treatments in first year or 26.6 per 1,000 PWID per year). However, the treatment rate is over 2-fold greater than this (12.6%–58% treated or 73.1 per 1,000 PWID per year) without full harm-reduction scale-up. To achieve the same impact by 2025, the initial required treatment rates in both sites must be increased by 45%–60% without full harm-reduction or 60%–82% with full harm-reduction (Figure 3), but the overall cumulative number of PWID needing treatment is similar (Web Tables 3 and 4). Table 4 presents all these results with 95% credibility intervals, emphasizing there is generally more uncertainty in the projected number of PWID needing treatment to reach the elimination targets than the yearly percentage needing treatment. Similar treatment numbers are needed to achieve a 90% reduction in prevalence (Web Figure 10).
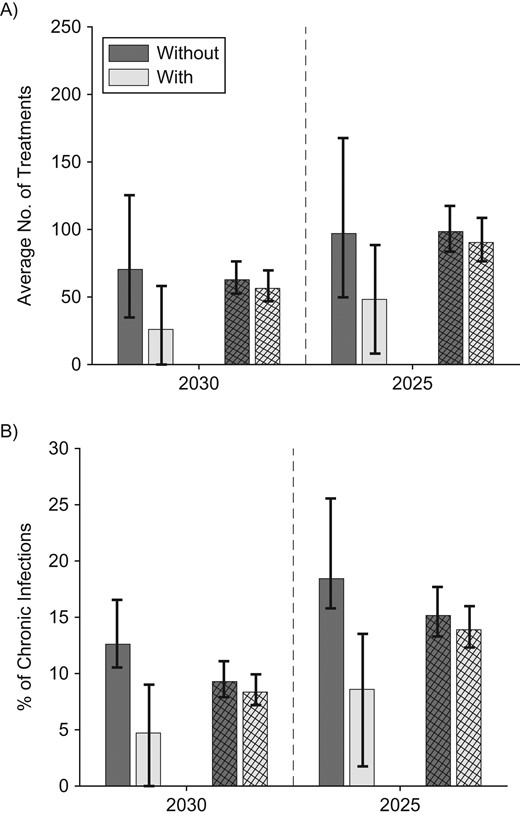
Estimated treatment required to decrease HCV incidence by 90% in Perry County, Kentucky, and San Francisco, California, by 2025 or 2030. A) Annual number needing treatment per 1,000 people who inject drugs (PWID); B) initial percentage of chronic infections requiring treatment per year. Figures show the projected number per 1,000 PWID and initial percentage of chronic infections that must be treated each year to decrease incidence by 90% by 2030 or 2025 in Perry County (solid bars) and San Francisco (striped bars), without and with full harm-reduction (50% medication-assisted treatment (MAT) and 84% syringe service programs (SSP) coverage). Bars show the median projections across all baseline model fits for Perry County and San Francisco, and whiskers show the 95% credibility intervals. The dark gray shows the number/percentage needed without MAT/SSP scale-up, and the light gray shows the number/percentage needed with MAT/SSP scale-up.
Median and 95% Credibility Intervals for the Baseline Projections, Illustrative Examples, and Treatment Scale-up Required for Reaching Elimination Targets Set by the World Health Organization/US National Academies of Sciences, Engineering and Medicine
| Perry County, Kentucky | San Francisco, California | |||
|---|---|---|---|---|
| Median | 95% CrI | Median | 95% CrI | |
| Baseline Projections | ||||
| Incidence in 2017, per 100 person-years | 21.3 | 10.2, 39.2 | 12.9 | 8.9, 18.4 |
| Prevalence in 2017, % | 59.5 | 39.0, 75.0 | 75.5 | 66.6, 85.7 |
| Treatment Rates Needed to Decrease Incidence by 90% by 2030 | ||||
| No. of PWID needing treatment each year | ||||
| Without full harm-reductiona | 58 | 30, 99 | 1,574 | 940, 2,319 |
| With full harm-reductiona | 22 | 0, 52 | 1,418 | 840, 2,092 |
| Percentage of chronically infected PWID needing treatment in the first year, % | ||||
| Without full harm-reductiona | 12.6 | 10.5, 16.5 | 9.3 | 7.9, 11.1 |
| With full harm-reductiona | 4.7 | 0, 9.0 | 8.3 | 7.2, 9.9 |
Abbreviations: CrI, credibility interval; MAT, medication assisted treatment; PWID, people who inject drugs; SSP, syringe service programs.
a Full harm-reduction is defined as 50% coverage of MAT and 84% coverage of SSP (scaled up in Perry County only).
Uncertainty analysis
For Perry County, uncertainty in the permanent cessation rate contributes to three-fourths of the variation (74%) in the projected yearly percentage of chronically HCV-infected PWID needing HCV treatment to reach the incidence target (Web Figure 11A). Uncertainty in HCV seroprevalence in 2009 and heightened transmission risk among recently initiated PWID also account for 15% and 6% of the variation, respectively. Conversely, for San Francisco, uncertainty in the HCV prevalence among PWID aged years in 1999 contributes a third (32%) to the variability in the yearly treatment percentage (Web Figure 11B). The level of like-with-like mixing according to age, sustained viral response rate, year when the rate of initiation of new injectors decreased, and HCV incidence among PWID aged <30 years in 2000–2001 contribute a further 18%, 18%, 14%, and 8%, respectively. In both settings, other parameters contribute <5% to the variation.
DISCUSSION
Aligned with the WHO’s HCV-elimination strategy, the strategy that the US National Academies of Sciences, Engineering, and Medicine recently developed for the United States sets targets to reduce HCV incidence by 90% by 2030. For 2 US settings, urban San Francisco, California, and rural Perry County, Kentucky, our model projections suggest that modest HCV treatment uptake (<20% of chronic HCV infections treated annually) could achieve this target by 2030 or 2025. With concurrent MAT (to 50% of PWID) and SSP (needed only in Perry County, to 84% of PWID) scale-up, only 5%–9% of chronically HCV-infected PWID need to be treated annually to decrease HCV incidence by 90% in both settings by 2030. Conversely, without scaling up these interventions, higher HCV treatment rates (13% annually) are needed in Perry County but not San Francisco. To achieve the same impact by 2025, HCV-treatment rates must increase by over half in both settings. Encouragingly, recent Australian data suggest that these treatment rates are achievable (21% of infected PWID treated in 2016 (40)).
With harm-reduction scale-up, achieving the HCV incidence elimination target by 2030 will initially require 1,418 annual HCV treatments among PWID in San Francisco but only 22 in Perry County (19,019 and 288 overall between 2017–2030). Although these treatment numbers for San Francisco are comparable to the 1,400 planned for 2017, and 2,100 for 2018 and 2019, by the San Francisco Department of Public Health “End Hep C SF” initiative (41), these treatment targets are for all groups—illustrating that additional treatment scale-up among PWID might be necessary. This will require expanding HCV case-finding and treatment interventions, likely involving MAT, SSP, and prison interventions. The feasibility of scaling up HCV case-finding and treatment interventions is being evaluated in the United States (42–44), with strategies planned by the “End Hep C SF” initiative (41), and in Kentucky. However, their scale-up will be a challenge; harm-reduction interventions are limited in most US settings, with about half of PWID not accessing SSP in the last year (17) and the nearest SSP being on average 37 miles away (19). Nationwide expansion of harm-reduction interventions is necessary to enable scale-up of community-based testing and treatment interventions, requiring substantial additional resources for HCV case-finding and treatment costs. This expansion will have other benefits, however (45, 46), and will reduce the number of treatments needed to achieve and maintain HCV elimination (47).
Strengths and limitations
The strength of our modeling is in undertaking detailed site-specific models. Unlike previous models evaluating the impact of HCV prevention and treatment interventions (9, 10, 48), our models incorporated the changing epidemiology of each setting. We used empirical estimates for MAT and SSP efficacy (5), and we incorporated the ways HCV transmission risk differs by other factors, improving the validity of our projections.
Despite this, our modeling is subject to limitations. First, the empirical estimates for efficacy of SSP (5) are uncertain. We used synthesized estimates for SSP from Europe instead of North America, because review-level evidence from North America suggests little protective benefit of SSP compared with a halving in risk from European studies (5). Explanations for this difference include differences in measurement of exposure to high-coverage SSP, greater confounding by indication in studies from North America (where high-risk PWID are more likely to use SSP (49)), and reduced benefit in stimulant injectors. We assumed European efficacy estimates on the basis that US SSPs could achieve the same impact as in Europe if they were designed in a similar way.
Second, empirical data availability and uncertainties contributed to uncertainty in our model projections. Specifically, although recent HCV incidence estimates were available for San Francisco (38), HCV prevalence estimates for after 2000 were unavailable (35). While our model agrees with existing data, only further data collection will confirm whether our model fully captures the current HCV epidemic in San Francisco. Additionally, limited data on PWID population size estimates (25) meant it was difficult to determine changing PWID population dynamics over time. Improved size-estimation studies are needed to better understand the changing burden of injecting, critical for assessing their intervention coverage and needs, particularly during the current opioid crisis. Importantly, even with current levels of data uncertainty, the model still projected important insights on required levels of prevention and treatment needed to eliminate HCV.
Third, we did not model HIV coinfection. While HIV prevalence among PWID is negligible in Kentucky (22), 12% of PWID were HIV-positive in San Francisco in 2012 (21). This should not have affected our projections, due to the low incidence of new infections (<1 per 100 person-years) in San Francisco (50) and low HIV-related mortality (51) because many HIV-infected PWID (66%) are on HIV treatment (21). Additionally, we did not explicitly model the consequences of HCV on mortality, because it is unlikely to substantially contribute to mortality among current PWID as found in previous mortality studies from North America (28, 52).
Fourth, we did not model men who have sex with men (MSM), who have heightened HCV risk and might overlap with PWID. This was done because recent data from the NHBS survey suggest that MSM who inject drugs probably have different injecting networks from non-MSM PWID due to differences in the primary drug injected and that transmission among MSM is frequently linked to high-risk sexual activities, unlike in PWID (53). This is supported by phylogenetic analyses from Europe suggesting a separate epidemic of HCV among MSM from that among PWID (54).
Last, we did not model the process through which HCV treatment scale-up would be undertaken or financed, which needs to be considered in future analyses.
Comparisons with other literature
Previous modeling for non-US settings has estimated the impact of scaling-up harm-reduction services, with or without HCV treatment scale-up (8–11, 13). Recent US modeling studies have considered the impact of HCV treatment among prisoners (55) and PWID in urban (48) and nonurban settings (47, 56). These have generally not accounted for local heterogeneity or used relatively simple models (47, 55). One study used a more complex network-based model, suggesting comparable treatment rates were needed in their lower-prevalence scenario (60% chronic HCV prevalence) as projected for Perry County, but higher treatment rates were needed in their high-prevalence scenario (75%) than we projected for San Francisco. The reasons that our model suggested that lower treatment rates would be needed in San Francisco are uncertain, but this could be due to the reductions in HCV incidence that resulted from high SSP availability. Our modeling complements this and other analyses by undertaking detailed site-specific modeling in 2 contrasting settings, using longitudinal data to capture changes in their HCV epidemics. This allowed us to consider whether the impact of scaling-up prevention and treatment interventions could vary across urban and nonurban locations in the United States, typifying the main epidemic types occurring. Importantly, one crucial difference between our model and many previous models (57, 58) is that we assumed a constant number being treated each year instead of a rate of treatment that decreases as chronic prevalence decreases. Previous modeling (59) has shown the limitation of this latter assumption because it results in much higher treatment rates being needed initially to compensate for large decreases in treatment as prevalence decreases.
CONCLUSIONS
Despite the existence of effective harm-reduction interventions (5), the availability of highly effective HCV treatment provides opportunities to augment MAT/SSP programs with HCV treatment as prevention strategies (60). Our modeling can guide these initiatives by projecting the HCV treatment needed to eliminate HCV infection as a public health threat (8, 9, 47). Our study reveals that modest scale-up of HCV treatment, together with MAT and SSP where needed, can reverse the expanding HCV burden in the United States, reaching elimination goals in 10–15 years. In urban areas (e.g., San Francisco) with existing moderate to high coverage of harm-reduction services, HCV treatment should be scaled up to reduce transmission. Conversely, in US settings with low coverage of harm-reduction services (19), scaling-up MAT and SSP is also necessary to reduce incidence of new and repeat infections, enhancing the impact of HCV treatment as prevention strategies. Scaling-up MAT and SSP also enables the expansion of case-finding, necessary to increase HCV treatment uptake among PWID (61–64). Field studies are required to demonstrate the feasibility and impact of these strategies, helping inform harm-reduction policy changes, thus enabling the United States to reduce HCV as a public health threat.
ACKNOWLEDGMENTS
Author affiliations: Population Health Sciences, Bristol Medical School, University of Bristol, Bristol, United Kingdom (Hannah Fraser, Jack Stone, Matthew Hickman, Natasha K. Martin, Peter Vickerman); Division of Medical Affairs, Grady Health System, Atlanta, Georgia (Claudia Vellozzi); RTI International, Research Triangle Park, Raleigh, North Carolina (Thomas J. Hoerger, Alex H. Kral, Carolina Barbosa, Jon Zibbell); Institute for Global Health Sciences, University of California San Francisco, San Francisco, California (Jennifer L. Evans); Center on Drug and Alcohol Research, Department of Behavioral Science, University of Kentucky College of Medicine, Lexington, Kentucky (Jennifer Havens, April M. Young); Department of Epidemiology, University of Kentucky College of Public Health, Lexington, Kentucky (April M. Young); Division of HIV/AIDS Prevention, Centers for Disease Control and Prevention, Atlanta, Georgia (Senad Handanagic, Lina Nerlander); Division of Viral Hepatitis, Centers for Disease Control and Prevention, Atlanta, Georgia (Susan Hariri, John W. Ward); Department of Chemistry, University of Colorado, Denver, Colorado (Alyssa Leib); Division of Infectious Diseases and Global Public Health, Department of Medicine, University of California San Diego, San Diego, California (Natasha K. Martin); Center for Public Health Research, Population Health Division, San Francisco Department of Public Health, San Francisco, California (Henry F. Raymond); Department of Internal Medicine, School of Medicine, University of New Mexico Health Sciences Center, Albuquerque, New Mexico (Kimberly Page); and Coalition for Global Hepatitis Elimination, Task Force for Global Health, Decatur, Georgia (John W. Ward).
C.V. was an employee of the US Centers for Disease Control and Prevention at the time the study began. A.L. was an employee of RTI International at the time the study began.
This study was supported by the Centers for Disease Control and Prevention (contract 200-2013-M-53964B GS-10F-0097L to RTI International) and a subcontract from RTI International to the University of Bristol. N.K.M., P.V., and M.H. were additionally supported by the National Institute for Drug Abuse (grant R01 DA037773), and N.M. was partially funded by the University of California San Diego Center for AIDS Research, a National Institutes of Health–funded program (grant P30 AI036214). P.V. and M.H. acknowledge that the research was supported by the National Institute for Health Research Health Protection Research Unit (NIHR HPRU) in Evaluation of Interventions at the University of Bristol in partnership with Public Health England (PHE). J.L.E. and K.P. were supported by the National Institute for Drug Abuse (grant 3-R01 DA016017-14), as was J.H. (grant R01 DA024598). J.S. acknowledges funding from a PhD scholarship from the Engineering and Physical Sciences Research Council.
The views expressed in this paper are solely those of the authors and not necessarily those of the Centers for Disease Control and Prevention (CDC), RTI International, the University of Bristol, the National Health Service (NHS), the National Institute of Health Research (NIHR), the Department of Health and Social Care, or Public Health England (PHE).
Conflict of interest: N.K.M. and P.V. have received unrestricted research grants from Gilead unrelated to this work, and N.K.M. has received honoraria from Merck, AbbVie, and Janssen. M.H. has received honoraria unrelated to this work from Merck, Abbvie, and Gilead. H.F. has received an honorarium from MSD. J.S. has received a conference attendance sponsorship from Gilead. K.P. has received research grant funding from Gilead unrelated to this work. The other authors report no conflicts.
Abbreviations
- CrI
credibility interval
- DAA
direct-acting antiviral
- HCV
hepatitis C virus
- MAT
medication-assisted treatment
- NHBS
National HIV Behavioral Surveillance
- PWID
people who inject drugs
- SNAP
Social Networks Among Appalachian People
- SSP
syringe service programs
- WHO
World Health Organization
REFERENCES

