


Abstract
The Special Supplemental Nutrition Program for Women, Infants, and Children (WIC) provides nutritional support for pregnant and postpartum women and young children. The typical food package provided to recipient families was revised in October 2009 to include more whole grains, fruits, vegetables, and low-fat milk. Little is known about whether these revisions improved nutrition among women during this critical period of the life course. We conducted a quasiexperimental difference-in-differences analysis, comparing WIC recipients (“treatment” group) before and after the WIC policy change, while accounting for temporal trends among nonrecipients (“control” group). We examined nutritional outcomes among a cohort of 1,454 women recruited during pregnancy in 2006–2011 in Memphis and surrounding Shelby County, Tennessee. We found improvements in several measures of dietary quality and nutrient intake during pregnancy, although these did not persist into the postpartum period. Results were robust to numerous sensitivity analyses. At a time when federal WIC funding is threatened, this study provides some of the first evidence of the benefits of recent WIC revisions among low-income women.
The Special Supplemental Nutrition Program for Women, Infants, and Children (WIC) is a US federal program that provides nutritional support for low-income pregnant and postpartum women and young children below the age of 5 years (1). Over a quarter of pregnant and postpartum women receive WIC benefits—roughly 3 million women annually (2)—making it among the most important public health programs targeting a critical window in the life course for maternal and child health. Participants receive vouchers or electronic cards to purchase specific combinations of foods (i.e., “food packages”) approved by the US Department of Agriculture (2). Numerous studies have examined the effects of WIC on maternal and child health, generally finding improved birth outcomes, maternal and child nutrition, and child cognitive development, although some studies have found no effects (3–15).
In response to concerns that the standard WIC food packages had not changed in over 30 years despite advances in nutrition science, the US Department of Agriculture implemented revisions in October 2009 that were intended to improve the packages’ nutritional content to prevent the development of obesity and chronic disease (16, 17). This included the provision of more whole grains, fruits, vegetables, and low-fat milk (16). Since these revisions, a handful of studies have documented increased expenditures on whole grains and decreased purchasing of refined grains and whole milk among WIC recipients (18–22). Yet it is possible that household expenditures do not subsequently translate into improved nutritional intake by mothers, because the purchases might be diverted to other family members (23). To our knowledge, only a single study has examined the effects of the revised food package on nutritional intake among WIC mothers and other caregivers, finding increased whole grain and decreased whole milk intake, although this pre/post study did not include a control group to rule out underlying temporal changes in nutrition over the study period (24). It is important to test the health effects of policy changes among intended recipients, because a few prior studies have found that some clinical interventions might be ineffectual and that safety-net programs might have unintended negative consequences (25–28).
Our study addressed this gap by testing the hypothesis that revisions to the WIC food package improved dietary quality among WIC-recipient mothers. Leveraging the natural experiment introduced by the revised WIC package—in that there was a “control group” of nonrecipients unexposed to the revised package—we employed a quasiexperimental design to estimate the effects of the policy change among WIC recipients. Outcomes included several measures of maternal nutrition both during pregnancy and postpartum, each of which represents a distinct window of opportunity for population health impact. This work provides evidence on a major US public health program that targets low-income families, and it has implications for future policy-making decisions regarding support of WIC and other safety-net programs.
METHODS
Data
Our sample was drawn from participants enrolled in the Conditions Affecting Neurocognitive Development and Learning in Early Childhood (CANDLE) study. CANDLE is a cohort study that recruited 1,503 pregnant women in Memphis, Tennessee, and surrounding Shelby County during 2006–2011 (Web Figure 1, available at https://dbpia.nl.go.kr/aje). Details on the survey methodology have been described previously (29). We used survey waves from the second trimester of pregnancy and 1 month postpartum, which included the nutritional outcomes of interest. Our sample was restricted to women for whom valid data were collected on these outcomes (n = 1,454, including 1,279 who provided responses for pregnancy outcomes and 1,177 who provided responses for postpartum outcomes).
Outcomes
Nutritional outcomes included the total and component scores of the 2010 Healthy Eating Index (HEI), as well as dietary intake (i.e., nutrient density) of fats, carbohydrates, and proteins. These were measured at 2 time points: during pregnancy and 1 month postpartum. These outcomes were obtained from the Block 2005 Food Frequency Questionnaire. The Food Frequency Questionnaire was administered during the second trimester and 1 month postpartum to elicit food and beverage intake from the previous 3 months. Interviewers were trained and recertified by registered dietitians. The Food Frequency Questionnaire was processed by Nutrition Quest to yield macro- and micronutrients, serving size, and frequency of intake. The Block Food Frequency Questionnaire is a valid and reliable method to describe nutrient intake from diet for groups and to rank individuals according to nutrient intake (30–34). Of 1,503 women who completed enrollment, we excluded respondents who reported implausibly low (<1,000) or high (>5,000) total kcal/day. Prior work recommends using an allowable energy range of 500–3500 for nonpregnant, nonlactating women, which we adapted for the increased energy needs of pregnancy (35).
The HEI is a validated measure of diet quality developed by the US Department of Agriculture (36). It is presented as a total score (range, 0–100), and it also yields separate scores for each of 12 dietary components (e.g., total vegetables, whole grain, milk). We included each of these components as outcomes to evaluate whether the revised WIC food package resulted in changes in the categories influenced by the revisions, and whether there were spillover effects in other categories. Maximum values for each HEI component ranged from 5 to 10, depending on the component. Higher values indicate healthier diets (e.g., a higher score on the refined grains component indicates reduced consumption). Of note, the HEI incorporates dietary consumption during the past 3 months; thus, the 1-month postpartum survey wave included dietary recall for the last 2 months of pregnancy.
The second set of outcomes captured dietary intake in the form of nutrient density, calculated as the proportion of diet from fats, carbohydrates, and proteins (37, 38). This formula took the form: total dietary intake (e.g., of fat) in grams × 1,000/total kcal of consumption.
Exposure
To estimate the effects of the revised WIC package on nutritional status during pregnancy, the main exposure was whether women received the revised package during pregnancy. Because the revisions were implemented in October 2009, a woman was considered to be exposed during pregnancy if her child was born after October 2009 (17, 18). WIC participation during pregnancy was assessed by self-report retrospectively during postpartum survey waves.
The CANDLE study unfortunately did not assess whether mothers also received WIC after delivery. It did, however, ask whether their children were receiving WIC. To estimate the effects of the revised package on nutritional status at 1 month postpartum, we therefore conducted 2 sets of analyses for postpartum outcomes: one analysis in which the primary exposure was WIC receipt during pregnancy, to evaluate whether nutrition effects persisted into the postpartum period, and a second analysis in which the primary exposure was whether the child was a WIC recipient, assuming concordance between the mother’s and child’s WIC status. Both of these are likely to result in some degree of misclassification, because WIC participation rates among eligible individuals are higher for postpartum women (69.2%) than for pregnant women (46.4%) and because eligible infants are more likely to receive benefits than their mothers (76.9% and 69.2%, respectively) (39).
Covariates
Covariates included mother’s age, educational attainment, marital status, race/ethnicity, receipt of Medicaid during pregnancy, sex of the child, household size, and 5 categories of household income. All models also included indicator variables for child’s birth year to account for secular trends.
Main analysis
DID rests on the assumption that the postrevision trends in the outcome variables would have been the same among WIC recipients and nonrecipients in the absence of the revision. While this counterfactual scenario is fundamentally unobservable, we conducted analyses that supported the validity of the DID assumptions. These included qualitative and quantitative assessments of prerevision parallel trends and placebo tests to evaluate possible differential compositional changes in the treatment and control groups. See Web Appendix 1, Web Figure 2, and Web Tables 1–2 for details.
Missing values for predictor variables ranged from 0% (e.g., age, child sex) to 16% for family size. Consequently, we used multiple imputation to impute missing values (see Web Appendix 1). We did not impute values for outcomes, because this is thought to add noise to the subsequent estimates (41), but we included outcomes in the imputation models of other variables to improve prediction of missing covariates.
Sensitivity analyses
We carried out additional analyses to test the robustness of our results to different modeling strategies. First, we defined the exposure as eligibility for WIC rather than receipt, similar to an intent-to-treat estimate in a randomized trial. During the study period, 50%–60% of women who were eligible for WIC actually received it (39). These women are thought to differ from eligible women who did not enroll in WIC (1, 3). This might lead to biased estimates, analogous to nonadherence in a randomized trial. We imputed eligibility using WIC formulas for eligibility based on self-reported income, household size, and Medicaid receipt, and we used this eligibility variable as the primary exposure instead of self-reported WIC receipt. This approach overcomes the challenges related to “nonadherence,” but it might introduce measurement error because income and household size are self-reported and might not correspond to the values provided to WIC staff to determine eligibility, and because CANDLE collected data only on income categories rather than a continuous income variable.
Second, we excluded women whose pregnancies included October 2009 to avoid misclassification, because we did not have information on when women began receiving WIC during pregnancy (remaining n = 1,010 for pregnancy outcomes, 955 for postpartum outcomes).
Third, we carried out the primary analysis with only complete cases (n = 976 for pregnancy outcomes; 1,049 for postpartum outcomes).
Finally, we restricted the sample to women with income less than $75,000, because these might represent a better control group for WIC-eligible women (n = 1,080 for pregnancy outcomes, 983 for postpartum outcomes).
Multiple hypothesis testing
To account for the fact that each analysis included 16 outcomes, we calculated adjusted P values using the Dubey/Armitage-Parmar method, which is a modification of the Bonferroni method that allows for correlated outcomes (42, 43).
RESULTS
Sample characteristics
About 56% of women received WIC benefits during pregnancy (Table 1), and about 40% delivered before October 2009, when the revised food packages were available. Compared with nonrecipients, WIC recipients were more likely to be black, unmarried, younger, less educated, and lower income, with worse nutritional status. Of note, DID assumes that trends (not levels) of the outcomes were similar during the prerevision period, an assumption that we validated graphically and quantitatively (see Web Appendix 1, Web Figure 2, Web Table 2).
Sample Characteristics, Conditions Affecting Neurocognitive Development and Learning in Early Childhood Study, Shelby County, Tennessee, 2006–2011
| Characteristica | No WIC in Pregnancy | WIC in Pregnancy | ||
|---|---|---|---|---|
| (n = 548) | (n = 711) | |||
| Mean (SD) | % | Mean (SD) | % | |
| Mother’s age, years | 28.9 (4.9) | 24.5 (5.1) | ||
| Mother married | 86.1 | 38.5 | ||
| Annual household income, $ | ||||
| <10,000 | 5.6 | 30.6 | ||
| 10,000–24,999 | 7.3 | 33.1 | ||
| 25,000–44,999 | 16.3 | 21.6 | ||
| 45,000–74,999 | 33.7 | 12.7 | ||
| ≥75,000 | 37.1 | 2.0 | ||
| Female child | 50.9 | 50.1 | ||
| Race/ethnicity | ||||
| Black | 33.4 | 86.8 | ||
| White/otherb | 66.6 | 13.2 | ||
| Mother’s education | ||||
| Less than high school | 4.2 | 14.2 | ||
| High school | 25.5 | 63.3 | ||
| More than high school | 70.3 | 22.5 | ||
| No. of people in household | 4.1 (1.2) | 4.7 (1.6) | ||
| Delivered before October 2009 | 36.1 | 41.6 | ||
| Child received WIC at 1 month postpartum | 21.2 | 87.2 | ||
| Outcome variables during pregnancy | ||||
| Healthy Eating Index | ||||
| Total score | 64.6 (10.3) | 57.7 (10.9) | ||
| Component 1: total vegetables | 4.0 (1.0) | 3.5 (1.2) | ||
| Component 2: dark green vegetables and legumes | 3.9 (1.4) | 3.3 (1.6) | ||
| Component 3: total fruit | 4.2 (1.2) | 4.0 (1.3) | ||
| Component 4: whole fruit | 4.2 (1.2) | 3.7 (1.5) | ||
| Component 5: whole grains | 4.8 (2.6) | 3.9 (2.4) | ||
| Component 6: milk | 6.4 (2.5) | 5.7 (2.3) | ||
| Component 7: meat and beans | 4.5 (0.7) | 4.5 (0.8) | ||
| Component 8: seafood and plant protein | 3.6 (1.4) | 2.9 (1.5) | ||
| Component 9: fatty acid ratio | 5.4 (2.4) | 4.8 (2.2) | ||
| Component 10: sodium | 3.7 (2.2) | 3.8 (2.4) | ||
| Component 11: refined grains | 7.7 (2.1) | 7.7 (2.1) | ||
| Component 12: solid fat, excess alcohol, added sugars | 12.2 (3.8) | 9.8 (3.7) | ||
| Nutrient densityc | ||||
| Protein | 38.6 (6.4) | 36.5 (5.9) | ||
| Fat | 40.0 (5.8) | 41.0 (5.4) | ||
| Carbohydrates | 127.8 (16.3) | 125.6 (16.2) | ||
Abbreviations: SD, standard deviation; WIC, Special Supplemental Nutrition Program for Women, Infants, and Children.
an = 1,454 (data on WIC receipt was missing for 195 participants). Sample characteristics were calculated using unimputed data.
b Only 1.9% of sample were Hispanic or other race/ethnicity. These were included in the “white” category to avoid unstable estimates due to small cell sizes.
c Nutrient density outcomes represent grams of each nutrient × 1,000 divided by the total kcal of dietary intake per day.
The revised food package and nutrition during pregnancy
The revised food package improved total HEI dietary quality scores among WIC recipients relative to nonrecipients (β = 2.4 points, 95% confidence interval (CI): 0.1, 4.7) (Figure 1). Improvements were also evident for the HEI component score for total fruit (β = 0.4 points, 95% CI: 0.1, 0.7) and whole grains (β = 0.5 points, 95% CI: −0.1, 1.1) (Figure 1). The revised WIC food package also led to decreased fat intake among WIC recipients relative to nonrecipients (β = −1.2 g per 1,000 kcal, 95% CI: −2.5, 0.1), although this confidence interval included the null (Figure 2).
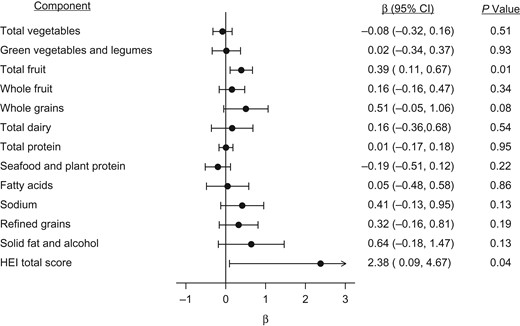
Effect of the revised food package from the Special Supplemental Nutrition Program for Women, Infants, and Children (WIC) on Healthy Eating Index (HEI) total and component scores during pregnancy (n = 1,279), in a sample drawn from the Conditions Affecting Neurocognitive Development and Learning in Early Childhood study, a cohort of women recruited during pregnancy, Tennessee, 2006–2011. Difference-in-differences analysis was conducted by carrying out multivariable linear regressions adjusting for covariates listed in Table 1. The values above represent the coefficient on the term for interaction between WIC receipt during pregnancy and whether the pregnancy occurred after the revisions to the food package were implemented in October 2009; these coefficients capture the effect of the revised WIC food package on each of the outcomes of interest. Missing values were imputed using multiple imputation using chained equations (see Web Appendix 1). The coefficient for total fruit intake remained statistically significant at P < 0.05 when using Dubey/Armitage-Parmar adjustment for multiple hypothesis testing. CI, confidence interval.
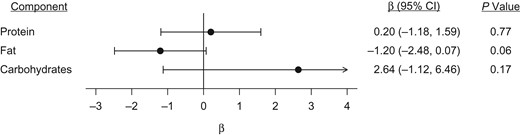
Effect of the revised food package from the Special Supplemental Nutrition Program for Women, Infants, and Children (WIC) on nutrient density during pregnancy (n = 1,279), in a sample drawn from the Conditions Affecting Neurocognitive Development and Learning in Early Childhood study, a cohort of women recruited during pregnancy, Tennessee, 2006–2011. Difference-in-differences analysis was conducted by carrying out multivariable linear regressions adjusting for covariates listed in Table 1. The values above represent the coefficient on the term for interaction between WIC receipt during pregnancy and whether the pregnancy occurred after the revisions to the food package were implemented in October 2009; these coefficients capture the effect of the revised WIC food package on each of the outcomes of interest. Nutrient density outcomes represent grams of each nutrient × 1,000 divided by the total kcal of dietary intake per day. Missing values were imputed using multiple imputation using chained equations (see Web Appendix 1). CI, confidence interval.
The revised food package and postpartum nutrition
Using WIC receipt during pregnancy as the primary exposure, we were unable to reject the null hypothesis that there was no association of the revised food package with any outcome at 1 month postpartum (Figures 3 and 4).

Effect of the revised food package from the Special Supplemental Nutrition Program for Women, Infants, and Children (WIC) on Healthy Eating Index (HEI) total score and components at 1 month postpartum (n = 1,177), in a sample drawn from the Conditions Affecting Neurocognitive Development and Learning in Early Childhood study, a cohort of women recruited during pregnancy, Tennessee, 2006–2011. Difference-in-differences analysis was conducted by carrying out multivariable linear regressions adjusting for covariates listed in Table 1. The values above represent the coefficient on the term for interaction between WIC receipt during pregnancy and whether the pregnancy occurred after the revisions to the food package were implemented in October 2009; these coefficients capture the effect of the revised WIC food package on each of the outcomes of interest. Missing values were imputed using multiple imputation using chained equations (see Web Appendix 1). CI, confidence interval.
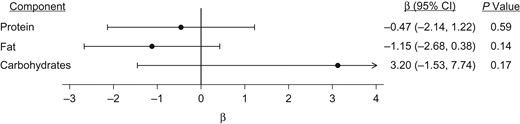
Effect of the revised food package from the Special Supplemental Nutrition Program for Women, Infants, and Children (WIC) on nutrient density at 1 month postpartum, in a sample drawn from the Conditions Affecting Neurocognitive Development and Learning in Early Childhood study, a cohort of women recruited during pregnancy, Tennessee, 2006–2011. Difference-in-differences analysis was conducted by carrying out multivariable linear regressions adjusting for covariates listed in Table 1. The values above represent the coefficient on the term for interaction between WIC receipt during pregnancy and whether the pregnancy occurred after the revisions to the food package were implemented in October 2009; these coefficients capture the effect of the revised WIC food package on each of the outcomes of interest. Nutrient density outcomes represent grams of each nutrient × 1,000 divided by the total kcal of dietary intake per day. Missing values were imputed using multiple imputation using chained equations (see Web Appendix 1). CI, confidence interval.
Using her child’s WIC receipt at 1 month of age as a proxy for a woman’s postpartum WIC receipt, we found improvements in the HEI component scores for whole fruit (β = 0.5, 95% CI: −0.02, 1.0) and refined grains (β = 0.7, 95% CI: −0.1, 1.5), although these confidence intervals included the null (Web Figures 3 and 4).
Sensitivity analyses
When we considered the treatment group to be WIC-eligible individuals (rather than actual recipients, model 1), improvements in the HEI total score, total fruits, and whole grains during pregnancy were similar to the primary models, and we also noted improvements in refined grains and protein intake (Web Table 3). When excluding women whose pregnancies included October 2009 (model 2), improvements in total fruit and fat intake during pregnancy were similar to the main models. When using complete case analysis (model 3), improvements in total fruit, whole grains, and fat intake were similar to the main models. When excluding women with income of $75,000 or more (model 4), improvements in total fruit intake during pregnancy were similar to the main models. Notably, models 2 and 4 both resulted in a 15% reduction in the sample size.
When conducting sensitivity analyses using postpartum outcomes, models using WIC eligibility instead of WIC receipt (model 1) demonstrated improvements in the HEI component score for refined grains (Web Table 4). In models excluding women whose pregnancies included October 2009 (model 2) and those with income of $75,000 or more (model 4), we were unable to reject the null hypothesis that there was no association of the revised food package with any outcomes. When using complete case analysis, the revised WIC food package was associated with decreased fat intake and increased carbohydrate intake (model 3), although these confidence intervals included the null.
Multiple hypothesis testing
After calculating adjusted P values using the Dubey/Armitage-Parmar method, improvements in total fruit intake during pregnancy remained statistically significant in our primary analysis (Figure 1). When using WIC eligibility rather than receipt as the primary exposure, improvements in the total HEI score and refined grain intake during pregnancy remained statistically significant (Web Table 3, model 1). For postpartum outcomes, no models demonstrated a statistically significant difference.
DISCUSSION
This study estimated the effects on maternal nutrition of WIC revisions that were intended to increase the consumption of whole grains, fruits, vegetables, and low-fat milk. Using a quasiexperimental design, we provide some of the first evidence that these revisions resulted in improved dietary quality among pregnant women, although these improvements might not persist at 1 month postpartum. Most findings were robust to several sensitivity tests, with increased total fruit intake most consistently demonstrated across model specifications and robust to adjustment of P values for multiple hypothesis testing.
The increase in the total HEI dietary quality score was moderate—2.4 points, or roughly 20% of a standard deviation, and the increased score for fruit represents about half a serving of fruit per week. Similarly, the decrease in fat intake of 1.2 g per 1,000 kcal (about a third of a teaspoon) is small relative to the 44 g of fat per day recommended by the US Department of Agriculture (44). Nevertheless, the revised packages themselves were only modestly changed relative to the standard WIC package. While such effect estimates might be minor at the individual level, they represent a meaningful improvement affecting the distribution of dietary habits at the population level (45). Our findings are similar to those seen among recipients of the Supplemental Nutrition Assistance Program (SNAP, or food stamps) and related dietary education programs (46, 47). Because WIC is a major US public health program that reaches over a quarter of pregnant and postpartum women (2), this suggests that the revised packages might have resulted in substantial improvements in nutrition at the population level among at-risk groups during the perinatal period. This intervention occurs at an important juncture in the life course, including the period of prenatal programming of fetal development (48). Prior work has demonstrated that maternal nutrition during pregnancy can have long-lasting effects on children’s health outcomes later in life (49, 50), and future studies should examine whether the WIC package revisions improved birth outcomes. This evidence also comes at a critical time for policy-making, when federal funding for WIC is increasingly threatened (51).
Our findings are consistent with prior work that found increased household expenditures on the categories of foods that were subject to the revised WIC guidelines (18–22), as well as a prior study using a similar quasiexperimental design that demonstrated analogous improvements in dietary quality among children who received the revised WIC packages (52). Although some prior work suggests that WIC foods might be reallocated to other household members (23), our study found that changes in purchases due to the revised package were reflected in women’s reported consumption. Prior evaluation of the WIC policy revision also documented improvements in breastfeeding, although that study was focused on the reduced provision of formula in the new package (53).
The fact that women’s improved diet did not persist into the postpartum period might be due to several factors. It might be that women have competing demands immediately after the birth of a child and are no longer as able to attend to their diet. If this is the case, interventions might be needed to provide more support for at-risk women to leverage their WIC benefits during the postpartum period. Alternatively, small effect sizes might exist, and our study might not have been powered to detect them. Because CANDLE did not directly query women about WIC receipt during the postpartum period, we imputed this variable based on WIC receipt during pregnancy and WIC receipt by the mother’s child. This might have resulted in measurement error, which would bias our findings toward or away from the null, depending on whether misclassification was also associated with the outcomes.
Notably, take-up of WIC among eligible pregnant women during our study period was 55%–60% nationally (39). To address this “nonadherence,” we imputed WIC eligibility using income, household size, and Medicaid receipt and demonstrated similar findings. Yet the larger concern is that a substantial percentage of women are not taking advantage of WIC and its resulting health benefits. Our study suggests that efforts to enroll eligible women might be worthwhile because of the potential nutritional benefits. Future studies should incorporate our findings into cost-effectiveness analyses of interventions to increase WIC take-up.
This study has several limitations. First, the CANDLE study, from which our sample was drawn, was conducted among a cohort of women in Tennessee; future studies should replicate these findings in additional cohorts and national samples to test whether results generalize to other women. Second, both outcome variables and demographic characteristics such as income, household size, and WIC receipt were self-reported and thus might suffer from typical reporting biases. For example, bias could result if WIC and non-WIC women tend to differentially misreport both outcomes and exposures (i.e., “same-source” bias). Notably, most surveys suffer from this limitation, given the challenges in linking surveys with administrative data on program participation, and prior work has suggested that estimates of program effects would be even greater if administrative linkages were possible (54). Similarly, CANDLE did not include a question on postpartum receipt of WIC; thus, our 2 analyses using WIC receipt during pregnancy and the child’s WIC receipt as proxies likely resulted in misclassification. Another limitation is that DID analyses rest on the assumption that the postrevision trends in health outcomes among WIC recipients and nonrecipients would have been the same in the absence of the revised food package. While this counterfactual scenario is fundamentally untestable, we conducted numerous placebo and parallel trends tests that suggested that DID assumptions were likely to be valid in this study due to similarities in prerevision trends between the 2 groups (see Web Appendix 1, Web Figure 2, and Web Tables 1 and 5). DID also assumes that there were no other factors that occurred at the same time as the WIC revisions that might have differentially improved nutritional outcomes among WIC recipients during the study period. To our knowledge, there were no major changes to WIC, Medicaid, the earned income tax credit, or other safety-net programs in Tennessee in or near October 2009. Similarly, the recession of 2008–2009 occurred during our study period, although prior work has found that low-income individuals were more likely to be adversely affected by the recession, which is the opposite of what we found (55).
This evaluation of revisions to a major US public health program demonstrates nutritional benefits among a high-risk population of women at an important juncture in the life course for both maternal and child health. It provides critical evidence at a time when WIC funding is under threat, and this evidence has implications for future policy-making decisions regarding support of WIC and other safety-net programs. Future work should examine the long-term effects of the revised food package on maternal and child nutrition and health later in life.
ACKNOWLEDGMENTS
Author affiliations: Department of Family and Community Medicine, School of Medicine, University of California, San Francisco, San Francisco, California (Rita Hamad, Akansha Batra); Philip R. Lee Institute for Health Policy Studies, University of California, San Francisco, San Francisco, California (Rita Hamad); Department of Obstetrics and Gynecology, School of Medicine, University of California, San Francisco, San Francisco, California (Deborah Karasek); Department of Psychiatry, Weill Institute for Neurosciences, School of Medicine, University of California, San Francisco, San Francisco, California (Kaja Z. LeWinn, Nicole R. Bush); Center for Biomedical Informatics, College of Medicine, University of Tennessee Health Science Center, Memphis, Tennessee (Robert L. Davis); and Department of Preventive Medicine, College of Medicine, University of Tennessee Health Science Center, Memphis, Tennessee (Frances A. Tylavsky).
Funding for this work was provided by the National Institutes of Health (grant K08-HL132106); the University of California, San Francisco, National Center of Excellence in Women’s Health; the University of California, San Francisco, Preterm Birth Initiative; and the Urban Child Institute.
The funders of the study had no role in study design, data collection, data analysis, data interpretation, or writing of the report.
We thank Dr. Hilary Hoynes for her comments on early drafts of the study design and manuscript.
Conflict of interest: none declared.
Abbreviations
- CANDLE
Conditions Affecting Neurocognitive Development and Learning in Early Childhood
- CI
confidence interval
- DID
difference-in-differences
- HEI
Healthy Eating Index
- WIC
Special Supplemental Nutrition Program for Women, Infants, and Children

