


Abstract
The authors performed a time-series analysis to test the association between air pollution and daily numbers of hospitalizations for headache in 7 Chilean urban centers during the period 2001–2005. Results were adjusted for day of the week and humidex. Three categories of headache—migraine, headache with cause specified, and headache not otherwise specified—were all associated with air pollution. Relative risks for migraine associated with interquartile-range increases in specific air pollutants were as follows: 1.11 (95% confidence interval (CI): 1.06, 1.17) for a 1.15-ppm increase in carbon monoxide; 1.11 (95% CI: 1.06, 1.17) for a 28.97-μg/m3 increase in nitrogen dioxide; 1.10 (95% CI: 1.04, 1.17) for a 6.20-ppb increase in sulfur dioxide; 1.17 (95% CI: 1.08, 1.26) for a 69.51-ppb increase in ozone; 1.11 (95% CI: 1.00, 1.19) for a 21.51-μg/m3 increase in particulate matter less than 2.5 μm in aerodynamic diameter (PM2.5); and 1.10 (95% CI: 1.04, 1.15) for a 37.79-μg/m3 increase in particulate matter less than 10 μm in aerodynamic diameter (PM10). There was no significant effect modification by age, sex, or season. The authors conclude that air pollution appears to increase the risk of headache in Santiago Province. If the relation is causal, the morbidity associated with headache should be considered when estimating the burden of illness and costs associated with poor air quality.
Acute and chronic exposure to urban air pollution in North America and Europe has been associated with increased respiratory symptoms, reduced lung function, and hospitalization and death from cardiac and respiratory diseases (1–5).
Headache is an important cause of morbidity in modern society. There are many self-reported triggers for migraines, including weather, fatigue, stress, food, menstruation, and infections (6, 7). There have been few studies of the effect of air pollution on headache. A daily diary study of 32 headache sufferers in Turin, Italy, revealed that the severity and frequency of headache was related to numbers of days with increased carbon monoxide and nitrogen dioxide levels (8). Reported headache was more common in a neighborhood with a pulp mill than in one without one (9). Among 29 women aged 19–27 years who were studied in an environmental chamber, headache, eye irritation, and nasal irritation were significantly worse (P < 0.05) when the women were exposed to ozone at 60–80 ppb as compared with <2 ppb (10). Between 1992 and 2000, the daily number of headache-related visits to an Ottawa, Canada, hospital emergency department increased by 4.9% (95% confidence interval: 1.2, 8.8) with each 3.9-ppb increase in sulfur dioxide level, lagged by 2 days (11). The same author also reported an increase in headache-related visits in Montreal, Canada, associated with increases in nitrogen dioxide and carbon monoxide levels (12).
We studied the association between gaseous and particulate air pollution and hospitalization for headache in Santiago Province, Chile. Santiago is densely populated and is situated in a valley surrounded by the Coastal and Andes mountains (13–15). In 2001, Kavouras et al. (16) observed that concentrations of particulate matter less than 10 μm in aerodynamic diameter (PM10) in several Chilean cities were high by US and European standards, making it easier to detect adverse effects of air pollution.
MATERIALS AND METHODS
Air pollution data
Daily air pollution data from 2001–2005 for the urban centers that make up Santiago Province were obtained from 7 monitoring stations in 7 regions: Las Condes, Cerrillos, El Bosque, La Florida, Independencia, Santiago, and Pudahuel. The Las Condes, Santiago, and Pudahuel stations measured the pollutants ozone, nitrogen dioxide, sulfur dioxide, carbon monoxide, PM10, and particulate matter less than 2.5 μm in aerodynamic diameter (PM2.5). Nitrogen dioxide was not measured in Independencia, La Florida, or El Bosque. PM2.5 was not measured in Independencia.
Headache hospitalization data
Headache was coded using the International Classification of Diseases, Tenth Revision (ICD-10). Daily numbers of hospitalizations for migraine (ICD-10 code G43), other specified headache (tension, cluster, vascular, posttraumatic, drug-related, or other specified cause; ICD-10 code G44), and headache not otherwise specified (ICD-10 code R51) were obtained from the Instituto Nacional de Estadisticas, the official source of statistical data in Chile from 2001 through 2005. Atypical facial pain and trigeminal neuralgia were not included.
Statistical methods
We assumed a Poisson distribution and used time-series analyses. A linear association between ambient air pollution and headache on the logarithmic scale was assumed (17). Natural splines were created with 1 knot for each of 15, 30, 60, 90, 120, 180, and 365 days of observation. We selected a model with the number of knots that minimized Akaike's Information Criterion, a measure of model prediction. We then maximized the evidence that the model residuals did not display any type of structure, including serial correlation using Bartlett's test (18). We also plotted model residuals against time, searching for visual signs of a pattern or correlation. Having selected the optimal model for time, we assessed the 24-hour mean values for temperature, humidity, barometric pressure, and humidex (a measure of the combined effect of temperature and humidity; Environment Canada, unpublished data, 2002 (http://www.msc-smc.ec.gc.ca/cd/brochures/humidity_e.cfm)) to determine the best weather predictors of headache. We accounted for potential nonlinear associations with headache by using natural spline functions with 4 knots. The model that minimized Akaike's Information Criterion used humidex, both on the day of the hospital admission for headache and on the day prior.
Lag times of 0–5 days were examined for the air pollutants. We also used unconstrained distributed lags as described by Schwartz (19).
In this paper, we present the increase in relative risk of headache for an interquartile-range increase in the level of each pollutant, using the optimal lags—those that maximized the observed effect size. The interquartile range, the middle 50% of the exposure data, provides a realistic estimate of day-to-day changes. It is nonparametric, so it will not be influenced by skewed data. It excludes extreme values and outliers which are unstable and infrequently seen. Results from each region were pooled using a random-effects model.
RESULTS
Regional population sizes varied more than 3-fold, from 421,000 in Independencia to 1,335,000 in La Florida (Table 1). The numbers of hospital admissions for headache varied 2- to 4-fold between Santiago and Independencia. In the total population of 5.37 million people, there was an average of 2.5 hospital admissions daily for headache, half of which had no specified cause and one-third of which were for migraine. Twenty-four-hour mean concentrations of air pollutants varied by approximately 50%–100% between regions. El Bosque had the greatest concentrations of PM10 and sulfur dioxide and the second-greatest concentration of sulfur dioxide. Las Condes had the greatest concentration of ozone.
Populations, Daily Numbers of Hospitalizations for Headache, and 24-Hour Ambient Air Pollution Concentrations in 7 Urban Centers, Santiago Province, Chile, 2001–2005
| Urban Center | Population (×105) | Daily No. of Hospitalizations, by Headache Type | Daily Air Pollution Concentration | |||||||||||||
| Not Otherwise Specified | Migraine | Specified Cause | Carbon Monoxide, ppm | Ozone, ppb | Sulfur Dioxide, ppb | Nitrogen Dioxide, ppb | PM10, μg/m3 | PM2.5, μg/m3 | ||||||||
| Mean | 1-IQR Change | Mean | 1-IQR Change | Mean | 1-IQR Change | Mean | 1-IQR Change | Mean | 1-IQR Change | Mean | 1-IQR Change | |||||
| Las Condes | 5.01 | 0.114 | 0.127 | 0.101 | 0.81 | 0.57 | 124.10 | 121.50 | 5.97 | 3.74 | 52.77 | 30.21 | 52.49 | 22.11 | 26.05 | 12.23 |
| Cerrillos | 8.92 | 0.057 | 0.095 | 0.059 | 0.94 | 1.13 | 88.52 | 56.84 | 11.17 | 8.62 | 44.43 | 32.43 | 73.16 | 41.92 | ||
| El Bosque | 9.15 | 0.104 | 0.095 | 0.077 | 1.24 | 1.22 | 81.28 | 52.92 | 11.21 | 7.25 | 77.79 | 41.06 | ||||
| La Florida | 13.35 | 0.102 | 0.138 | 0.113 | 1.27 | 1.28 | 101.41 | 78.40 | 8.97 | 5.47 | 76.77 | 36.43 | 34.22 | 18.93 | ||
| Independencia | 4.21 | 0.135 | 0.150 | 0.125 | 1.06 | 1.27 | 83.52 | 72.52 | 10.74 | 6.33 | 67.55 | 34.07 | ||||
| Santiago | 4.98 | 0.046 | 0.053 | 0.033 | 1.21 | 1.40 | 96.20 | 73.99 | 9.06 | 6.27 | 44.72 | 32.70 | 69.94 | 38.84 | 62.65 | 34.20 |
| Pudahuel | 8.08 | 0.061 | 0.086 | 0.053 | 1.09 | 1.04 | 82.73 | 50.96 | 7.21 | 4.91 | 40.13 | 22.09 | 73.58 | 42.75 | 33.62 | 23.35 |
| Combined results | 53.70a | 1.168a | 0.744a | 0.561a | 1.11b | 1.15 | 93.26b | 69.51 | 9.32b | 6.20 | 44.74b | 28.97 | 72.24b | 37.79 | 32.48b | 21.51 |
Abbreviations: IQR, interquartile range; PM2.5, particulate matter less than 2.5 μm in aerodynamic diameter; PM10, particulate matter less than 10 μm in aerodynamic diameter.
Total number summed over all 7 urban centers.
Population weighted average pollutant concentration.
The greatest and smallest regional pairwise correlation coefficients for each 2-pollutant combination are presented in Table 2. Those greater than or equal to 0.7 are identified with a footnote. The greatest positive correlations were between carbon monoxide and nitrogen dioxide and PM2.5, which is consistent with a common source, mobile combustion. Sulfur had somewhat lower positive correlations with the other pollutants, whereas ozone tended to have small and often negative correlations with other pollutants.
Minimum and Maximum Pearson Pairwise Correlations Between Air Pollutants for 7 Urban Centers, Santiago Province, Chile, 2001–2005
| Pollutant | Carbon Monoxide | Ozone | Sulfur Dioxide | Nitrogen Dioxide | PM10 |
| Ozone | |||||
| Minimum | −0.514** | ||||
| Maximum | −0.176 | ||||
| Sulfur dioxide | |||||
| Minimum | 0.418** | −0.088* | |||
| Maximum | 0.821 | 0.129 | |||
| Nitrogen dioxide | |||||
| Minimum | 0.788a,** | −0.339** | 0.416** | ||
| Maximum | 0.844a | −0.085 | 0.797 | ||
| PM10 | |||||
| Minimum | 0.512** | −0.003** | 0.387** | 0.614** | |
| Maximum | 0.835 | 0.169 | 0.839 | 0.787 | |
| PM2.5 | |||||
| Minimum | 0.729a,** | −0.310** | 0.390** | 0.716a,** | 0.712a,** |
| Maximum | 0.915a | −0.069 | 0.825 | 0.823a | 0.917a |
Abbreviations: PM2.5, particulate matter less than 2.5 μm in aerodynamic diameter; PM10, particulate matter less than 10 μm in aerodynamic diameter.
* P < 0.05; **P < 0.005.
Pearson pairwise correlation coefficient of 0.7 or greater.
Associations between headache and single pollutants
The majority of relative risks for the relation between headache and air pollution were greater than 1 for each of the 7 areas and each of the 3 headache classifications (Table 3). Of all of the relative risks calculated for each pollutant by region and by headache type, ozone had greater relative risks than the other pollutants for 14 of the 21 comparisons. Of the 3 headache types, relative risks were greater for migraine for approximately 50% of the comparisons. The 95% confidence interval excluded 1 for 15 of the 21 comparisons with ozone, 7 of the 12 comparisons with nitrogen dioxide, and 6 of the 12 comparisons with PM2.5. For other pollutants, fewer than 50% of the comparisons were significant. The number of times the 95% confidence interval excluded 1 was 22 for migraine, 9 for nonspecified headache, and 7 for specified headache. Las Condes and Santiago had the greatest numbers of significant relative risks. There were significant associations between migraine and ozone in all regions.
Relative Risk of Hospitalization for Headache Associated With an Interquartile-Range Change in Pollutant Concentrations, by Urban Center, Santiago Province, Chile, 2001–2005a
| Urban Center | Headache Type | Carbon Monoxide (1.15 ppm)b | Ozone (69.51 ppb) | Sulfur Dioxide (6.20 ppb) | Nitrogen Dioxide (28.97 ppb) | PM10 (37.79 μg/m3) | PM2.5 (21.51 μg/m3) | ||||||
| RR | 95% CI | RR | 95% CI | RR | 95% CI | RR | 95% CI | RR | 95% CI | RR | 95% CI | ||
| Las Condes | NOS | 1.128 | 1.047, 1.215 | 1.058 | 0.764, 1.464 | 1.127 | 0.993, 1.279 | 1.104 | 1.034, 1.179 | 1.129 | 1.041, 1.225 | 1.111 | 1.038, 1.189 |
| Migraine | 1.121 | 1.045, 1.202 | 1.161 | 1.007, 1.339 | 1.141 | 0.959, 1.357 | 1.136 | 1.036, 1.245 | 1.131 | 1.056, 1.211 | 1.130 | 1.056, 1.209 | |
| Specified cause | 1.144 | 0.904, 1.448 | 1.123 | 1.023, 1.232 | 1.128 | 1.005, 1.266 | 1.132 | 1.020, 1.256 | 1.115 | 0.998, 1.245 | 1.106 | 1.009, 1.212 | |
| Cerrillos | NOS | 1.120 | 0.970, 1.294 | 1.160 | 1.034, 1.301 | 1.120 | 0.967, 1.297 | 1.138 | 0.999, 1.297 | 1.059 | 0.940, 1.193 | NA | |
| Migraine | 1.107 | 1.009, 1.215 | 1.167 | 1.047, 1.301 | 1.132 | 0.994, 1.289 | 1.141 | 1.018, 1.279 | 1.106 | 1.022, 1.197 | NA | ||
| Specified cause | 1.111 | 0.943, 1.309 | 1.137 | 1.085, 1.191 | 1.128 | 0.984, 1.293 | 1.106 | 0.987, 1.240 | 1.068 | 0.988, 1.155 | NA | ||
| El Bosque | NOS | 1.032 | 0.991, 1.074 | 1.001 | 0.999, 1.003 | 1.128 | 0.925, 1.376 | NA | 1.034 | 0.949, 1.127 | NA | ||
| Migraine | 1.088 | 1.007, 1.176 | 1.134 | 1.011, 1.272 | 1.084 | 0.934, 1.258 | NA | 1.117 | 0.979, 1.275 | NA | |||
| Specified cause | 1.104 | 0.902, 1.351 | 1.061 | 0.943, 1.194 | 1.113 | 0.946, 1.310 | NA | 1.025 | 0.975, 1.077 | NA | |||
| La Florida | NOS | 1.128 | 0.983, 1.294 | 0.993 | 0.852, 1.157 | 1.129 | 0.945, 1.348 | NA | 1.056 | 0.967, 1.153 | 1.097 | 0.972, 1.238 | |
| Migraine | 1.129 | 0.992, 1.285 | 1.118 | 1.007, 1.241 | 1.070 | 0.873, 1.312 | NA | 1.133 | 0.987, 1.300 | 1.142 | 0.978, 1.333 | ||
| Specified cause | 1.069 | 0.884, 1.292 | 1.050 | 0.923, 1.195 | 1.143 | 0.849, 1.539 | NA | 1.045 | 0.913, 1.196 | 1.022 | 0.989, 1.056 | ||
| Independencia | NOS | 1.093 | 0.986, 1.212 | 1.139 | 1.039, 1.249 | 0.997 | 0.819, 1.213 | NA | 1.056 | 0.909, 1.227 | NA | ||
| Migraine | 1.037 | 0.999, 1.076 | 1.194 | 1.004, 1.419 | 1.053 | 0.979, 1.133 | NA | 1.084 | 0.990, 1.187 | NA | |||
| Specified cause | 1.021 | 0.986, 1.057 | 1.122 | 1.011, 1.245 | 0.997 | 0.743, 1.338 | NA | 1.105 | 0.988, 1.236 | NA | |||
| Santiago | NOS | 1.046 | 0.995, 1.099 | 1.123 | 1.046, 1.205 | 1.100 | 0.964, 1.256 | 1.121 | 0.978, 1.285 | 1.050 | 0.995, 1.108 | 1.071 | 1.018, 1.127 |
| Migraine | 1.111 | 1.006, 1.227 | 1.199 | 1.014, 1.418 | 1.136 | 1.026, 1.258 | 1.117 | 1.038, 1.202 | 1.058 | 1.005, 1.114 | 1.112 | 1.009, 1.226 | |
| Specified cause | 1.127 | 0.930, 1.366 | 1.183 | 1.021, 1.371 | 1.129 | 0.921, 1.383 | 1.138 | 0.876, 1.478 | 1.152 | 0.951, 1.395 | 1.096 | 1.003, 1.197 | |
| Pudahuel | NOS | 1.066 | 0.953, 1.192 | 1.117 | 1.034, 1.206 | 1.086 | 0.953, 1.237 | 1.131 | 0.977, 1.309 | 1.093 | 0.941, 1.270 | 1.050 | 0.927, 1.189 |
| Migraine | 1.074 | 0.955, 1.208 | 1.198 | 1.041, 1.379 | 1.115 | 0.953, 1.304 | 1.085 | 1.000, 1.177 | 1.049 | 1.004, 1.096 | 1.047 | 0.993, 1.104 | |
| Specified cause | 1.148 | 0.949, 1.389 | 1.153 | 0.879, 1.512 | 1.143 | 0.868, 1.506 | 1.072 | 1.012, 1.133 | 1.054 | 0.984, 1.128 | 1.129 | 0.908, 1.404 | |
Abbreviations: CI, confidence interval; NA, not applicable; NOS, not otherwise specified; PM2.5, particulate matter less than 2.5 μm in aerodynamic diameter; PM10, particulate matter less than 10 μm in aerodynamic diameter; RR, relative risk.
Results were adjusted for long-term trends, day of the week, and average humidex on the day of hospitalization and the day before. Optimal lags were 1 day for all RRs.
One-interquartile-range change in the specified pollutant.
When the regions were pooled, the relative risk estimates were greater than 1 for all pollutant-headache type combinations. Using models with a single lag structure, the 95% confidence interval excluded 1, except for the associations between PM2.5 and migraine and headache of specified cause and the association between nitrogen dioxide and headache of specified cause (Table 4). The largest risk estimate was 1.17 for the relation between ozone and migraine headache, and the second-largest was 1.13 for the relation between nitrogen dioxide and headache of specified cause. Effect sizes seen with a distributed lag structure pointed in the same direction but tended to be greater than with the single lag structure. With distributed lags, the only 95% confidence interval not excluding 1 was that for the association between migraine and PM2.5. There was no consistent effect modification of the headache-pollution associations by age, sex, or season (Table 5). Compared with younger persons, those over age 64 years had nonsignificantly larger relative risks for headaches other than migraine.
Pooled Estimates of the Relative Risk of Hospitalization for Headache Associated With an Interquartile-Range Change in Pollutant Concentrations in 7 Urban Centers, Santiago Province, Chile, 2001–2005a
| Headache Type | Lag Structure | Carbon Monoxide (1.15 ppm)b | Ozone (69.51 ppb) | Sulfur Dioxide (6.20 ppb) | Nitrogen Dioxide (28.97 ppb) | PM10 (37.79 μg/m3) | PM2.5 (21.51 μg/m3) | ||||||
| RR | 95% CI | RR | 95% CI | RR | 95% CI | RR | 95% CI | RR | 95% CI | RR | 95% CI | ||
| Not otherwise specified | Single | 1.088 | 1.025, 1.155 | 1.085 | 1.030, 1.143 | 1.094 | 1.033, 1.158 | 1.123 | 1.062, 1.188 | 1.062 | 1.018, 1.108 | 1.082 | 1.010, 1.139 |
| Distributed lags | 1.078 | 1.018, 1.138 | 1.194 | 1.074, 1.314 | 1.108 | 1.014, 1.202 | 1.185 | 1.086, 1.284 | 1.061 | 1.011, 1.111 | 1.057 | 1.003, 1.111 | |
| Migraine | Single | 1.109 | 1.056, 1.166 | 1.167 | 1.080, 1.261 | 1.104 | 1.040, 1.172 | 1.113 | 1.056, 1.173 | 1.096 | 1.042, 1.152 | 1.105 | 0.999, 1.194 |
| Distributed lags | 1.136 | 1.037, 1.235 | 1.213 | 1.123, 1.303 | 1.133 | 1.049, 1.217 | 1.186 | 1.059, 1.313 | 1.109 | 1.037, 1.181 | 1.142 | 0.982, 1.302 | |
| Specified cause | Single | 1.034 | 1.007, 1.062 | 1.118 | 1.074, 1.164 | 1.113 | 1.020, 1.215 | 1.125 | 0.982, 1.289 | 1.079 | 1.011, 1.152 | 1.090 | 0.987, 1.180 |
| Distributed lags | 1.114 | 1.026, 1.202 | 1.296 | 1.145, 1.447 | 1.125 | 1.017, 1.233 | 1.195 | 1.088, 1.302 | 1.088 | 1.010, 1.166 | 1.097 | 1.011, 1.183 | |
Abbreviations: CI, confidence interval; PM2.5, particulate matter less than 2.5 μm in aerodynamic diameter; PM10, particulate matter less than 10 μm in aerodynamic diameter; RR, relative risk.
Results were adjusted for long-term trends, day of the week, and average humidex on the day of hospitalization and the day before. Optimal lags were 1 day for all RRs.
One-interquartile-range change in the specified pollutant.
Pooled Estimates of the Relative Risk of Hospitalization for Headache Associated With an Interquartile-Range Change in Pollutant Concentrations in 7 Urban Centers, by Age, Sex, and Season, Santiago Province, Chile, 2001–2005a
| Headache Type | Category | Carbon Monoxide (1.15 ppm)b | Ozone (69.51 ppb) | Sulfur Dioxide (6.20 ppb) | Nitrogen Dioxide (28.97 ppb) | PM10 (37.79 μg/m3) | PM2.5 (21.51 μg/m3) | ||||||
| RR | 95% CI | RR | 95% CI | RR | 95% CI | RR | 95% CI | RR | 95% CI | RR | 95% CI | ||
| Not otherwise specified | Age, years | ||||||||||||
| ≤64 | 1.066 | 1.016, 1.118 | 1.028 | 0.963, 1.097 | 1.069 | 1.005, 1.137 | 1.092 | 1.042, 1.206 | 1.046 | 1.019, 1.112 | 1.073 | 1.006, 1.170 | |
| >64 | 1.092 | 1.029, 1.158 | 1.089 | 1.039, 1.141 | 1.099 | 1.042, 1.159 | 1.121 | 1.001, 1.006 | 1.065 | 1.001, 1.003 | 1.085 | 1.021, 1.149 | |
| Sex | |||||||||||||
| Male | 1.071 | 0.987, 1.162 | 1.029 | 0.906, 1.081 | 1.122 | 1.016, 1.239 | 1.040 | 0.931, 1.162 | 1.070 | 0.994, 1.152 | 1.073 | 0.956, 1.205 | |
| Female | 1.058 | 0.999, 1.121 | 1.097 | 0.991, 1.212 | 1.035 | 0.967, 1.108 | 1.083 | 1.004, 1.168 | 1.069 | 1.018, 1.122 | 1.015 | 0.939, 1.097 | |
| Season | |||||||||||||
| April–September | 1.041 | 0.970, 1.117 | 1.099 | 1.023, 1.181 | 1.044 | 0.857, 1.231 | 0.963 | 0.862, 1.064 | 1.133 | 1.025, 1.240 | 1.199 | 1.006, 1.430 | |
| October–March | 1.130 | 1.065, 1.199 | 1.009 | 0.941, 1.082 | 1.059 | 0.959, 1.170 | 1.054 | 1.013, 1.118 | 1.092 | 1.022, 1.167 | 1.092 | 0.990, 1.205 | |
| Migraine | Age, years | ||||||||||||
| ≤64 | 1.091 | 1.028, 1.158 | 1.064 | 0.981, 1.154 | 1.100 | 1.024, 1.181 | 1.072 | 0.990, 1.161 | 1.094 | 1.038, 1.153 | 1.114 | 1.015, 1.223 | |
| >64 | 1.079 | 1.007, 1.156 | 1.123 | 1.034, 1.219 | 1.110 | 1.009, 1.220 | 1.100 | 1.009, 1.199 | 1.097 | 1.008, 1.194 | 1.060 | 0.988, 1.137 | |
| Sex | |||||||||||||
| Male | 1.087 | 0.969, 1.219 | 1.151 | 1.061, 1.241 | 1.110 | 0.949, 1.298 | 1.119 | 0.958, 1.307 | 1.041 | 0.948, 1.144 | 1.120 | 0.968, 1.296 | |
| Female | 1.097 | 1.021, 1.179 | 1.058 | 0.996, 1.120 | 1.123 | 1.035, 1.219 | 1.017 | 0.925, 1.118 | 1.092 | 1.028, 1.160 | 1.127 | 1.027, 1.236 | |
| Season | |||||||||||||
| April–September | 1.132 | 1.039, 1.233 | 1.058 | 1.014, 1.102 | 1.095 | 0.996, 1.194 | 1.048 | 0.918, 1.197 | 1.149 | 1.025, 1.288 | 1.096 | 0.972, 1.236 | |
| October–March | 1.138 | 1.061, 1.221 | 1.037 | 0.944, 1.139 | 1.036 | 0.881, 1.218 | 1.140 | 1.027, 1.265 | 1.075 | 0.985, 1.173 | 1.076 | 0.945, 1.225 | |
| Specified cause | Age, years | ||||||||||||
| ≤64 | 1.084 | 1.000, 1.175 | 1.083 | 0.965, 1.216 | 1.035 | 0.941, 1.138 | 1.085 | 0.964, 1.221 | 1.063 | 0.997, 1.133 | 1.074 | 0.974, 1.184 | |
| >64 | 1.045 | 0.991, 1.101 | 1.120 | 1.010, 1.242 | 1.092 | 0.989, 1.205 | 1.132 | 1.009, 1.270 | 1.069 | 0.992, 1.151 | 1.076 | 0.993, 1.165 | |
| Sex | |||||||||||||
| Male | 1.085 | 0.939, 1.253 | 1.110 | 1.008, 1.199 | 1.122 | 0.978, 1.286 | 1.039 | 0.864, 1.249 | 1.075 | 0.970, 1.191 | 1.072 | 0.908, 1.266 | |
| Female | 1.085 | 0.979, 1.202 | 1.094 | 0.940, 1.273 | 1.091 | 0.945, 1.259 | 1.102 | 0.956, 1.270 | 1.049 | 0.971, 1.133 | 1.024 | 0.908, 1.154 | |
| Season | |||||||||||||
| April–September | 1.078 | 0.961, 1.209 | 1.109 | 0.993, 1.238 | 1.067 | 0.922, 1.235 | 1.030 | 0.886, 1.198 | 1.030 | 0.892, 1.168 | 1.019 | 0.880, 1.180 | |
| October–March | 1.066 | 0.982, 1.157 | 1.001 | 0.911, 1.093 | 0.951 | 0.769, 1.176 | 1.065 | 0.920, 1.233 | 1.097 | 0.992, 1.213 | 1.032 | 0.884, 1.204 | |
Abbreviations: CI, confidence interval; PM2.5, particulate matter less than 2.5 μm in aerodynamic diameter; PM10, particulate matter less than 10 μm in aerodynamic diameter; RR, relative risk.
Results were adjusted for long-term trends, day of the week, and average humidex on the day of hospitalization and the day before. Optimal lags were 1 day for all RRs.
One-interquartile-range change in the specified pollutant.
Associations for headache in 2-pollutant models
For migraine, the relative risk point estimates for nitrogen dioxide remained stable and statistically significant after adjustment for each of the other pollutants (Figure 1). When other pollutants were adjusted for nitrogen dioxide, their point estimates decreased and statistical significance was lost. The point estimate for PM10 remained stable despite adjustment for pollutants other than nitrogen dioxide. Carbon monoxide, sulfur dioxide, and ozone lost significance when adjusted for nitrogen dioxide or PM2.5. For both headache–not otherwise specified and headache–specified cause, the results from 2-pollutant models were similar. The relative risk point estimate for carbon monoxide remained significant when adjusted for other gases but lost significance when adjusted for particulate air pollution (Figures 2 and 3). The ozone effect remained stable and significant after adjustment for carbon monoxide, sulfur dioxide, and PM10 (Figures 2 and 3) but lost significance at P = 0.05 after adjustment for nitrogen dioxide or PM2.5. The other 2 pollutants that were significant in single-pollutant models, sulfur dioxide and PM10, lost significance when adjusted for either carbon monoxide or PM2.5. Adjusting for sulfur dioxide increased the point estimates for carbon monoxide, nitrogen dioxide, PM10, and PM2.5.
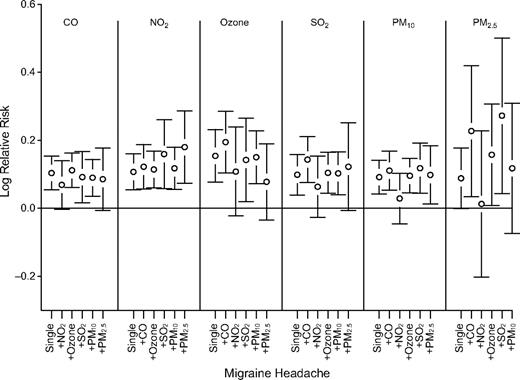
Adjusted log relative risk of hospitalization for migraine headache associated with an interquartile-range change in pollutant concentrations in 7 urban centers, Santiago Province, Chile, 2001–2005. CO, carbon monoxide; NO2, nitrogen dioxide; SO2, sulfur dioxide; PM10, particulate matter less than 10 μm in aerodynamic diameter; PM2.5, particulate matter less than 2.5 μm in aerodynamic diameter. Bars, 95% confidence interval.
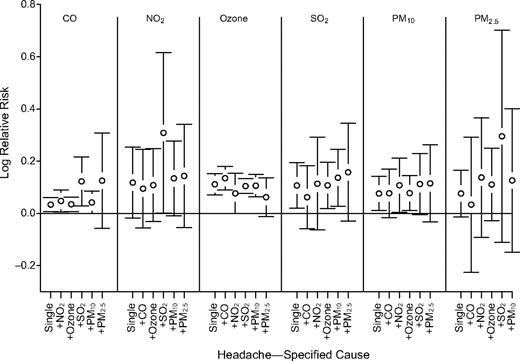
Adjusted log relative risk of hospitalization for headache from a specified cause associated with an interquartile-range change in pollutant concentrations in 7 urban centers, Santiago Province, Chile, 2001–2005. CO, carbon monoxide; NO2, nitrogen dioxide; SO2, sulfur dioxide; PM10, particulate matter less than 10 μm in aerodynamic diameter; PM2.5, particulate matter less than 2.5 μm in aerodynamic diameter. Bars, 95% confidence interval.
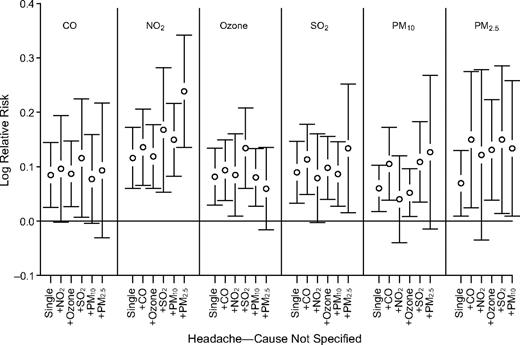
Adjusted log relative risk of hospitalization for headache not otherwise specified associated with an interquartile-range change in pollutant concentrations in 7 urban centers, Santiago Province, Chile, 2001–2005. CO, carbon monoxide; NO2, nitrogen dioxide; SO2, sulfur dioxide; PM10, particulate matter less than 10 μm in aerodynamic diameter; PM2.5, particulate matter less than 2.5 μm in aerodynamic diameter. Bars, 95% confidence interval.
DISCUSSION
Summary of findings
In this study, numbers of headaches severe enough to require hospitalization were increased on days of greater air pollution. This finding was robust in that the association was present for all 3 headache classifications and for all gaseous and particulate air pollutants tested. Migraine was the type of headache most consistently associated with individual air pollutants across regions of Santiago Province. Ozone was the pollutant most consistently associated with headache in single-pollutant models across Santiago. With the exception of ozone, the high correlations between pollutants—a result of their common source, fossil fuel combustion—made it difficult to isolate the effect of 1 pollutant from that of the others. However, for migraine, the effect of nitrogen dioxide was independent of each of the other pollutants in 2-pollutant models. Nitrogen dioxide is a good marker for mobile combustion sources or urban traffic (20). Whether nitrogen dioxide per se contributes to headache directly or is simply the best marker of exposure to other toxic pollutants cannot be determined.
Biologic plausibility of a causal relation between air pollution and headache
A causal association between air pollution and headache is biologically plausible. Nociceptive stimuli may trigger headache, and neural and vascular changes are thought to be important in the pathophysiology of headache. Sulfur dioxide and ozone are irritants, and air pollution influences neural and vascular activity.
Observed dilation of temporal arteries during migraine headaches and symptomatic improvement with administration of vasoconstrictors suggest a vascular role in headache. Increased pulsation may stimulate stretch receptors and perivascular nerves (21). A more recent central neurologic theory supported by neuroimaging is that a trigeminovascular reflex may lead to peptide release and subsequent inflammation, vasodilation, and pain (22).
The influence of air pollution on the brain is unknown, but there is evidence that air pollutants exert both vascular and neurologic effects on the cardiovascular system. Exposure to fine particulate pollution influences autonomic innervation of the heart. Acute cerebrovascular effects have not been well studied, but air pollution exposure is associated with increased risks of stroke and heart attack and influences peripheral vascular tone. Brook et al. (23) reported that exposure to concentrated urban air pollution in Toronto, Canada, increased resting brachial artery tone but did not alter the ability to respond to ischemia. Recently, O'Neill et al. (24) reported a decrease in flow-mediated vasodilatation associated with an increase in ambient sulfates among persons with diabetes.
Following inhalation, air pollutants may affect an organ by stimulating the release of mediators from the lung tissue into the circulation. Alternatively, fine particulate air pollution may penetrate the alveolar-capillary wall and travel directly to the end organ hematogenously. In a study by Nemmar et al. (25), ultrafine technetium-99m-carbon particles (similar in size to some particulate air pollution) could be detected in the systemic circulation of adult volunteers within 1 minute after inhalation. In rats, following intratracheal instillation of albumin nanocolloid particles less than 100 nm in diameter labeled with 100 μCi of technetium-99m, radioactivity was subsequently detected in several organs, including the brain (26).
Strengths and limitations of the present study
Apart from biologic mechanisms which may explain the air pollution-headache association, diagnostic misclassification may have caused an artifactual association in this study if air pollution caused sinusitis that was misdiagnosed as headache. We found evidence supporting air pollution as a risk factor for rhinitis but not sinusitis (27–31). Further, facial pain was specifically excluded from the classification of headache. Finally, to account for the observed findings, a misdiagnosis of sinusitis would have had to enter all 3 diagnostic classes of headache, since all 3 were associated with air pollution.
The relatively high level of air pollution in Chile increases the power to detect statistically significant associations and reduces the probability of false-negative results. Although there were only 2.5 hospital admissions daily in our study, the findings were based on several thousand days of observations and admissions for headache. This large sample size also contributed to the power to detect small changes. The error in estimating personal exposure from fixed-site monitors would tend to reduce the probability of detecting an effect and would bias air pollution-headache associations towards the null (32). This suggests that the magnitude of the true effect may be larger than what we measured. Fixed-site monitoring has been shown to correlate with both indoor and personal exposure. During the winters of 1988 and 1989, Rojas-Bracho et al. (33) carried out an exposure study of Santiago children aged 10–12 years. Personal, indoor, and outdoor PM2.5 concentrations were all within 5% at 69.5 μg/m3, 68.5 μg/m3, and 68.1 μg/m3, respectively. In the present daily time-series analysis, we examined the effects of day-to-day differences in air pollution, not absolute values. Therefore, even if there were significant differences between absolute concentrations of indoor and outdoor pollutants, values from fixed-site monitors would still be useful as long as personal exposure was higher on days with higher ambient pollution than on days with lower ambient pollution. There remains a question common to population-based studies of air pollution; whether the identified individual pollutants account for the majority of the observed effect or whether they are a proxy for other pollutants coming from the same source, fossil fuel combustion. Combustion particles may also coexist with pathogens from noncombustion sources. For example, diesel particles may carry aeroallergens, which may enhance the observed association between diesel exhaust and health (34). The question of how to identify independent effects of individual air pollutants could perhaps be better answered by studying headache in regions with different combinations of air pollutants.
Administrative hospital data provide a large number of observations, provide a population-based sample, and identify health outcomes with associated morbidity and financial cost. These databases lack personal information that may influence headache, but these factors would not be expected to confound the observed relation. To be a potential confounder, a factor would have to be a risk factor for the disease; in addition, day-to-day changes in the risk factor would have to be associated with day-to-day changes in the concentrations of air pollutants.
Summary
We found that in Santiago Province, acute increases in ambient air pollution were associated with increases in numbers of hospital admissions for headache. If this association proves to be causal, the morbidity from headache should be included when estimating the illness burden and economic costs of air pollution, and recommending that headache sufferers remain indoors on days with high air pollution levels may reduce morbidity. We recommend that further studies be conducted in different geographic regions to test the consistency of this finding.
Abbreviations
- ICD-10
International Classification of Diseases, Tenth Revision
- PM2.5
particulate matter less than 2.5 μm in aerodynamic diameter
- PM10
particulate matter less than 10 μm in aerodynamic diameter
Author affiliations: Division of Statistics, Health Canada, Ottawa, Ontario, Canada (Robert E. Dales, Sabit Cakmak); Departments of Medicine and Epidemiology, Faculty of Medicine, University of Ottawa, Ottawa, Ontario, Canada (Robert E. Dales); Health Research Institute, University of Ottawa, Ottawa, Ontario, Canada (Robert E. Dales, Sabit Cakmak); and Area Descontaminacion Atmosferica, Comisión Nacional del Medio Ambiente (CONAMA), Santiago, Chile (Claudia Blanco Vidal).
The authors thank Drs. Danuta Rajs Grzebien of Informacion de Salud, Ministerio de Salud, for providing mortality data and Roberto Martínez, Comision Nacional Del Medio Ambiente, Region Metropolitana, for collecting pollution data.
Conflict of interest: none declared.

