


Abstract
Limited evidence exists on the short- and long-term safety of discontinuing versus continuing chronic opioid therapy (COT) among patients with Alzheimer’s disease and related dementias (ADRD).
This cohort study was conducted among 162,677 older residents with ADRD and receipt of COT using a 100% Medicare nursing home sample. Discontinuation of COT was defined as no opioid refills for ≥90 days. Primary outcomes were rates of pain-related hospitalisation, pain-related emergency department visit, injury, opioid use disorder (OUD) and opioid overdose (OD) measured by diagnosis codes at quarterly intervals during 1- and 2-year follow-ups. Poisson regression models were fit using generalised estimating equations with inverse probability of treatment weights to model quarterly outcome rates between residents who discontinued versus continued COT.
The study sample consisted of 218,040 resident episodes with COT; of these episodes, 180,916 residents (83%) continued COT, whereas 37,124 residents (17%) subsequently discontinued COT. Discontinuing (vs. continuing) COT was associated with higher rates of all outcomes in the first quarter, but these associations attenuated over time. The adjusted rates of injury, OUD and OD were 0, 69 and 60% lower at the 1-year follow-up and 11, 81 and 79% lower at the 2-year follow-up, respectively, for residents who discontinued versus continued COT, with no difference in the adjusted rates of pain-related hospitalisations or emergency department visits.
The rates of adverse outcomes were higher in the first quarter but lower or non-differential at 1-year and 2-year follow-ups between COT discontinuers versus continuers among older residents with ADRD.
Key Points
Chronic opioid therapy (COT) discontinuers versus continuers had similar or lower rate of injury in the short and long terms.
COT discontinuers versus continuers had lower rates of opioid use disorder and opioid overdose in the short and long terms.
COT discontinuers versus continuers had no difference in pain-related hospitalisation and emergency department (ED) visit rates in the short and long terms.
Background
The use of prescription opioids for chronic pain management in older adults with Alzheimer’s disease and related dementia (ADRD) tripled from 15% in 2005 to 45% in 2015 [1, 2]. This increase is mainly because non-opioids and adjuvant analgesic tricyclic antidepressants are linked to serious adverse drug effects (e.g. renal and liver toxicity [3], gastrointestinal bleeding [4] and falls [5]). Of opioid users with ADRD, about half (43–53%) received chronic opioid therapy (COT, ≥3 months) between 2011 and 2017 [1], prompting the clinical question of whether opioids are safe when used long term in this fast-growing population.
When risks outweigh the benefits of COT, discontinuing COT for non-cancer or non-palliative patients, including those with ADRD, is recommended by current guidelines, such as the CDC Guideline for Prescribing Opioids for Chronic Pain—United States, 2016 and its revision in 2022 [6, 7]. These clinical guidelines are based on evidence derived from young adult populations or mixed young adult and older populations with healthy cognition and were generated on concerns of COT-related serious harms, including respiratory depression, opioid use disorder (OUD) and fatal and nonfatal opioid overdose (OD) [6, 7]. Yet these adverse events, largely driven by opioid abuse or misuse or the use of high opioid doses (e.g. ≥90 morphine milligrams equivalent [MME]/day) are rare among persons with ADRD [1, 8].
Today, limited evidence exists on the safety of discontinuing versus continuing COT for patients with ADRD [9]. Existing studies have primarily assessed clinical consequences after rapidly tapering or abruptly discontinuing high-dose opioids in COT users [10–15], a clinical practice that is infrequent for patients with ADRD [1]. While those prior studies have consistently shown increased risk of harms (e.g. OD) associated with opioid tapering and discontinuation, they also have substantial limitations, particularly arising from a lack of consideration of potential confounders. Among older adults, for example, individuals who receive opioids but experience opioid-related side effects (e.g. constipation, vomiting, and delirium) [16, 17] and poor pain control tend to discontinue opioid therapy [18], and these individuals may have greater risk of pain-related hospitalisation immediately following opioid treatment discontinuation.
To address the scarcity and limitations of evidence on COT risk–benefit specific to ADRD, we used a 100% Medicare nursing home (NH) sample to examine short- and long-term associations of discontinuation versus continuation of COT with key opioid-related adverse outcomes—pain-related hospitalisation and emergency department (ED) visit, injury, diagnosis of OUD and diagnosis of OD—while accounting for important confounders (e.g. opioid-related side effects and pain intensity) among older adults with ADRD.
Methods
Study source and design
We conducted a retrospective cohort study using a 100% Medicare fee-for-service NH residents linked to Medicare Parts A (inpatient encounters), B (office-based visits) and D (prescription drugs) claims and minimum data set (MDS) assessments from 1 January 2010 to 31 December 2020 [19]. MDS, a standardised clinical assessment of NH residents, is required at admission, regular intervals during medicare-covered short-term stays, and quarterly thereafter [20]. We used quarterly MDS assessments to measure important confounders, such as pain intensity and opioid-related side effects (detailed in covariates) among NH residents. This study was approved by The Ohio State University’s Institutional Review Board.
Study sample
We included NH residents aged ≥65 years who were diagnosed with ADRD and received COT, defined as having at least one episode of opioid treatment lasting 90 days [21] during a 12-month NH stay. Patients entered the cohort on the 90th day of the latest COT episode (cohort entry) were subsequently assessed whether their COT was continued or discontinued and assigned an exposure index date (detailed in key exposure) in a year after cohort entry. Patients were followed up from the assigned index date for 1 year for investigation of short-term outcomes, and a subset of patients with 2 years’ follow-up was generated for examining long-term outcomes. We divided the follow-ups into quarterly intervals to (i) capture temporal (short- and long-term) variability of the associations between COT discontinuation and adverse outcomes and (ii) facilitate adjustment for potential time-varying confounders measured from MDS quarterly assessments.
To study a population homogeneous for pain conditions, we restricted residents to individuals with chronic pain but without cancer, palliative or hospice care during the study period (from 12 months before cohort entry to the end of the 1- or 2-year follow-up). Throughout the study period, we excluded patients who had (i) no continuous enrollment in Medicare Parts A, B and D (due to lack of complete medical and prescription claims to capture key variables of interest), (ii) a Medicare Part C plan (lack of medical claims), (iii) no MDS quarterly assessment, (iv) presence of comatose symptoms and (v) no continuous NH stay. To avoid misclassification of discontinuation of COT (defined as a continuous gap of ≥90 days) among patients with long hospital stays during which no prescription drug information was available, we excluded residents with a hospital stay ≥90 days from cohort entry to the end of the follow-ups. To prevent confounding by opioid misuse or abuse (i.e. individuals with opioid misuse are likely to have their COT discontinued by clinicians and have a greater risk of subsequent adverse outcomes) [12], we excluded patients with a diagnosis of OUD or OD during 12-month pre-index period. Patients could re-enter the cohort following the end of the follow-ups if meeting the eligibility criteria. Figure 1 shows sample selection details, and Figure 2 shows a schematic diagram of the study design. The medications of interest and diagnostic and procedure codes for conditions and services considered in the sample selection are given in Supplementary Tables 1 and 2.
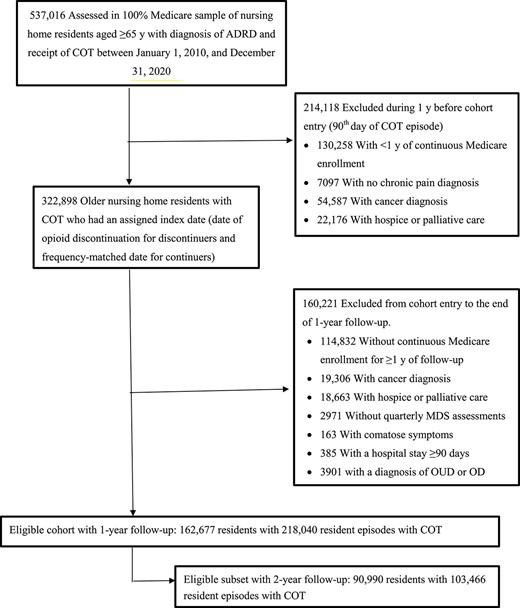
Cohort inclusion flowchart for the study sample. ADRD represents Alzheimer’s disease and related dementias.
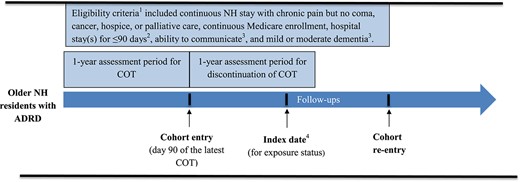
Schematic diagram of study design, including time periods for identifying cohort entry, index date for exposure status, eligibility criteria, and outcome follow-up. 1Eligibility criteria, unless otherwise noted, were applied during the study period from 12 months before cohort entry to the end of the 1-year and 2-year follow-up periods. 2Requirement of hospital stay for <90 days was applied during the period from cohort entry to the end of the 1-year and 2-year follow-up periods. 3Requirements for the ability to communicate and having mild or moderate dementia were applied during the 6 months before the index date. 4The index date, which could occur anytime during the 1-year assessment period, was defined as the date of opioid discontinuation for COT discontinuers and the frequency-matched date for COT continuers.
Key exposure
Discontinuation of COT was measured over a year following cohort entry. Patients who had no opioid fills for ≥90 consecutive days were classified as ‘discontinuers’; otherwise, they were ‘continuers.’ Using 90 days to define discontinuation allowed for identifying true discontinuers because the cut-off was three times the 99th percentile of days’ supply for opioid prescriptions (i.e. 30 days) filled by the studied patients with ADRD. For discontinuers, the index date was the date of discontinuation, defined as the date after the end of the days’ supply of the last prescription for opioids. For continuers, the index date was randomly selected by frequency matching to discontinuers’ index date to ensure a similar distribution of time between cohort entry and index date between continuer and discontinuer groups. Because patients’ opioid use may change over time, we re-assessed whether patients discontinued COT at quarterly follow-up periods and analysed it as a time-varying exposure.
Outcome measures
Adverse outcomes included pain-related hospitalisation and ED visit, injury, OUD and OD, all of which were measured using Medicare Parts A or B data (Supplementary Tables 2). Pain-related hospitalisation and ED visit were defined as encounters with a primary or secondary diagnosis of a chronic pain condition. Injurious events that led to inpatient or office-based visits were identified using a developed claims-based algorithm, which demonstrated high sensitivity (83%) compared with the traditional approach of using E-codes only [22]. OUD and OD were captured from inpatient or outpatient encounters coded with a diagnosis of opioid dependence, abuse or OD [11, 14, 23, 24]. For each outcome, we calculated rates of residents who experienced events at quarterly intervals throughout follow-ups.
Study covariates
Study covariate details are given in Supplementary Table 3. Demographic characteristics included age, sex, race/ethnicity, region of the USA, receipt of low-income subsidy, body mass index and years of living with ADRD since the first diagnosis in Medicare data. Clinical conditions, measured during the 12-month pre-index period, included a diagnosis of tobacco, alcohol or drug use disorder (excluding OUD and OD), health conditions affecting opioid treatment (e.g. cardiovascular disease) [25] and the total number of comorbidities.
We measured the following covariates 6 months before the index date to have information more proximate to the exposure. Pain management included the use of drug or nondrug pain management, use of as-needed (PRN) pain medication, receipt of physical therapy, opioid dosage, use of long-acting opioids, use of prescription nonopioid analgesics and use of adjuvant analgesics. Medication use includes use of other central nervous system (CNS) medications, use of anti-dementia drugs and polypharmacy (use of ≥5 dispensed generic drugs excluding opioids). The MDS was used to ascertain opioid-related side effects (including delirium, constipation, vomiting and dehydration), behavioural and psychological symptoms (including psychotic and disruptive behaviours) [26], pain intensity [27], physical function (measured with 9-item Activities of Daily Living scale) [28], depressive symptoms (Patient Health Questionnaire-9) [26], dementia severity (Cognitive Performance Scale and the Brief Interview for Mental Status) [29] and the ability of residents to communicate. To account for changes in clinical opioid prescribing due to implementation of new guidelines and regulations during the last decade, we adjusted for the year of the index date. We observed only a small proportion of patients with missing data on the MDS-assessed covariates (<2% at baseline and during follow-up periods) and excluded those patients from final regression analyses.
Statistical analysis
We compared baseline covariates and baseline all-cause hospitalisation, all-cause ED visit and injury between COT discontinuers and continuers using standardised mean differences (SMDs), with an SMD >0.1 indicating covariate imbalance [30]. SMDs are widely used to show characteristic differences between groups [31–33] because the statistic is not influenced by sample size and allows for comparisons in the weighted and unweighted samples [30, 34]. Potential differences in baseline variables between groups were adjusted via inverse probability of treatment weighting (IPTW). To account for confounders that changed over time (including use of adjuvant analgesics, PRN pain medication, any pain intervention or CNS medication and presence of opioid-related side effects, physical function, pain intensity and dementia severity) and acted as both a risk factor for the outcome and subsequent exposure, we calculated a stabilised IPTW in a marginal structural model at each quarter given the previous status on discontinuation of COT and previous values of the time-varying confounders and baseline covariates [35]. The stabilised IPTW was truncated at the 1st and 99th percentiles to reduce the influence of outliers on estimates.
To determine the short- and long-term safety of discontinuing COT, for each adverse outcome, we fitted a separate Poisson regression model with generalised estimating equations and stabilised IPTW to model the quarterly outcome rates between COT discontinuers versus continuers. We report the adjusted rate ratio (aRR) between exposure groups and their 95% confidence interval (CI) for each quarter and each outcome. We performed two subgroup analyses: (i) restricting the analysis for hospitalisation, ED visit and injury outcome to patients with no corresponding outcome for any cause during the 12-month pre-index period and (ii) stratifying analyses according to baseline dementia severity, pain intensity and physical function to understand whether the associations varied across these subgroups. All analyses were conducted using SAS, v9.4. Statistical significance was set at P < 0.05, and all tests were two-sided.
Results
This cohort study included 162,677 Medicare NH residents with ADRD and receipt of COT who had ≥1 year of follow-up (83.2 [8.7] years of age, 82% female), consisting of 218,040 resident episodes for studying short-term outcomes (Table 1). A sample subset of 90,990 patients with ≥2 years’ follow-up (82.6 [8.6] years of age, 80.8% female) was identified, consisting of 103,466 resident episodes for studying long-term outcomes (Supplementary Table 4). For 218,040 resident episodes with ≥1 year’ follow-up, 180,916 residents (83.0%) continued COT, whereas 37,124 residents (17.0%) subsequently discontinued COT (Table 1). Discontinuers (vs. continuers) were more likely to have received diagnoses of several clinical conditions, such as diabetes (54.8 vs. 47.5%; SMD, 0.146) and to have experienced any all-cause hospitalisation (50 vs. 29.1%; SMD, 0.434) and ED visit (41.5 vs. 23.3%; SMD, 0.392) during the 12-month pre-index period. Both groups also differed in terms of pain management at baseline. After IPTW, distributions of all measured baseline characteristics were well-balanced between continuers and discontinuers among individuals with ≥1 year of follow-up (Table 1) and those with ≥2 years of follow-ups (Supplementary Table 4).
Clinical and demographic characteristics of patients with ADRD and receipt of chronic opioid therapy (COT), overall and by continuation versus discontinuation of COT
| Characteristic | N (%)a | SDiffb | |||
|---|---|---|---|---|---|
| Overall sample (n = 162,677) | COT continuers (n = 180,916)c | COT discontinuers (n = 37,124)c | Before IPTW | After IPTW | |
| Age, years | |||||
| Mean (SD) | 83.2 (8.7) | 83.5 (8.7) | 82.6 (8.7) | 0.107 | 0.000 |
| 65–74 | 31,389 (19.3) | 33,186 (18.3) | 7,765 (20.9) | ||
| 75–84 | 52,656 (32.4) | 58,604 (32.4) | 12,685 (34.2) | ||
| ≥85 | 78,632 (48.3) | 89,126 (49.3) | 16,674 (44.9) | ||
| Female | 132,443 (81.1) | 149,648 (82.7) | 29,160 (78.5) | 0.106 | 0.009 |
| Race and ethnicity | 0.176 | 0.000 | |||
| White | 133,372 (82.0) | 150,110 (83.0) | 28,238 (76.1) | ||
| Black | 18,952 (11.7) | 20,390 (11.3) | 5,607 (15.1) | ||
| Otherd | 10,353 (6.4) | 10,416 (5.8) | 3,279 (8.8) | ||
| Receiving low-income subsidy | 143,967 (88.5) | 162,984 (90.1) | 33,378 (89.9) | 0.017 | 0.012 |
| US region | 0.116 | 0.000 | |||
| Northeast | 26,231 (16.1) | 28,505 (15.8) | 6,078 (16.4) | ||
| Midwest | 47,525 (29.2) | 54,288 (30.0) | 9,336 (25.1) | ||
| South | 71,307 (43.8) | 78,791 (43.6) | 17,657 (47.6) | ||
| West | 17,614 (10.8) | 19,332 (10.7) | 4,053 (10.9) | ||
| Body mass index | 0.050 | 0.025 | |||
| Underweight | 10,133 (6.2) | 11,132 (6.2) | 2,291 (6.2) | ||
| Normal weight | 51,558 (31.7) | 54,942 (30.4) | 11,932 (32.1) | ||
| Overweight | 47,238 (29.0) | 52,936 (29.3) | 10,630 (28.6) | ||
| Obese | 53,748 (33.0) | 61,606 (34.1) | 12,271 (33.1) | ||
| Clinical condition | |||||
| Tobacco or alcohol use disorder | 10,713 (6.6) | 10,497 (5.8) | 2,983 (8.0) | 0.088 | 0.010 |
| Mental health disorder | 124,528 (76.5) | 137,560 (76.0) | 29,657 (79.9) | 0.093 | 0.007 |
| Diabetes | 79,171 (48.7) | 85,911 (47.5) | 20,330 (54.8) | 0.146 | 0.006 |
| Cardiovascular disease | 140,529 (86.4) | 154,045 (85.1) | 33,201 (89.4) | 0.129 | 0.008 |
| Hypertension | 146,176 (89.9) | 161,108 (89.1) | 34,190 (92.1) | 0.103 | 0.006 |
| Pulmonary condition | 119,217 (73.3) | 127,906 (70.7) | 29,364 (79.1) | 0.195 | 0.012 |
| Kidney disease | 56,569 (34.8) | 58,336 (32.2) | 15,389 (41.5) | 0.192 | 0.013 |
| Liver disease | 12,741 (7.8) | 12,268 (6.8) | 3,815 (10.3) | 0.125 | 0.016 |
| Gastrointestinal tract disorder | 100,746 (61.9) | 108,011 (59.7) | 24,875 (67.0) | 0.152 | 0.016 |
| Injury | 82,544 (50.7) | 82,142 (45.4) | 21,486 (57.9) | 0.252 | 0.020 |
| Neurodegenerative disorder | 36,312 (22.3) | 38,099 (21.1) | 9,490 (25.6) | 0.107 | 0.002 |
| Drug use disorder | 2,666 (1.6) | 2,481 (1.4) | 729 (2.0) | 0.045 | 0.005 |
| BPSD | 36,887 (22.7) | 40,466 (22.4) | 8,821 (23.8) | 0.033 | 0.006 |
| Total number of comorbidities | 29.4 (12.8) | 27.5 (12.1) | 33.4 (13.4) | 0.461 | 0.020 |
| Health care use | |||||
| Any hospital stay | 59,405 (36.5) | 52,584 (29.1) | 18,576 (50.0) | 0.434 | 0.033 |
| Any ED visit | 48,069 (29.5) | 42,085 (23.3) | 15,399 (41.5) | 0.392 | 0.030 |
| Pain management | |||||
| Drug or non-drug pain intervention | 156,506 (96.2) | 176,562 (97.6) | 34,133 (91.9) | 0.256 | 0.007 |
| Any physical therapy | 112,969 (69.4) | 120,558 (66.6) | 27,476 (74.0) | 0.161 | 0.014 |
| Use of other pain medication | |||||
| Any adjuvant analgesic | 76,994 (47.3) | 88,045 (48.7) | 18,250(49.2) | 0.006 | 0.001 |
| Any prescription non-opioid | 23,797 (14.6) | 25,259 (14.0) | 5,759 (15.5) | 0.043 | 0.001 |
| Use of PRN pain medication | 64,370 (39.6) | 67,260 (37.2) | 15,742 (42.4) | 0.105 | 0.006 |
| Dosage of chronic opioid therapy | 0.305 | 0.025 | |||
| <20 MME/daily | 120,890 (74.3) | 127,332 (70.4) | 30,683 (82.7) | ||
| 20–50 MME/daily | 33,744 (20.7) | 42,864 (23.7) | 5,528 (14.9) | ||
| >50 MME/daily | 8,043 (4.9) | 10,720 (5.9) | 913 (2.5) | ||
| Use of long-acting opioid | 34,272 (21.1) | 43,477 (24.0) | 4,948 (13.3) | 0.279 | 0.021 |
| Medication use | |||||
| Use of other CNS medication | 128,226 (78.8) | 141,729 (78.3) | 29,559 (79.6) | 0.030 | 0.001 |
| Use of other ADRD medication | 56,002 (34.4) | 61,057 (33.7) | 13,587 (36.6) | 0.061 | 0.002 |
| Polypharmacy | 152,455 (93.7) | 168,657 (93.2) | 35,199 (94.8) | 0.066 | 0.002 |
| Any opioid-related side effect | 9,494 (5.8) | 11,448 (6.3) | 2,487 (6.7) | 0.015 | 0.003 |
| Dementia severity | 0.050 | 0.035 | |||
| Mild | 93,839 (57.7) | 104,659 (57.8) | 21,086 (56.8) | ||
| Moderate | 53,721 (33.0) | 58,574 (32.4) | 12,752 (34.3) | ||
| Severe | 15,117 (9.3) | 17,683 (9.8) | 3,286 (8.9) | ||
| Physical dependence | 0.094 | 0.025 | |||
| No (ADL ≤ 9) | 24,036 (14.8) | 27,310 (15.1) | 4,530 (12.2) | ||
| Mild (10 ≤ ADL ≤ 18) | 28,618 (17.6) | 31–64 (17.2) | 6,455 (17.4) | ||
| Moderate (19 ≤ ADL ≤ 27) | 66,308 (40.8) | 72,252 (39.9) | 15,879 (42.8) | ||
| Severe (ADL ≥ 28) | 43,715 (26.9) | 50,290 (27.8) | 10,260 (27.6) | ||
| Depression status | 0.076 | 0.000 | |||
| No (PHQ-9 ≤ 4) | 126,952 (78.0) | 142,093 (78.5) | 29,381 (79.1) | ||
| Mild (5 ≤ PHQ-9 ≤ 9) | 24,838 (15.3) | 27,358 (15.1) | 5,234 (14.1) | ||
| Moderate (10 ≤ PHQ-9 ≤ 14) | 8,254 (5.1) | 8,730 (4.8) | 1932 (5.2) | ||
| Severe (PHQ-9 ≥ 15) | 2,633 (1.6) | 2,735 (1.5) | 577 (1.6) | ||
| Pain statuse | 0.074 | 0.000 | |||
| No | 84,077 (51.7) | 95,137 (52.6) | 20,114 (54.2) | ||
| Mild | 25,481 (15.7) | 28,272 (15.6) | 5,733 (15.4) | ||
| Moderate | 35,658 (21.9) | 38,392 (21.2) | 7,808(21.0) | ||
| Severe | 15,634 (9.6) | 17,098 (9.4) | 3,026 (8.2) | ||
| Able to communicate | 138,106 (84.9) | 152,883 (84.5) | 31,587 (85.1) | 0.017 | 0.001 |
| Time since ADRD diagnosis, years | 0.081 | 0.007 | |||
| Mean (SD) | 4.6 (3.6) | 5.3 (3.8) | 5.0 (3.8) | ||
| Year of the index date | 0.109 | 0.000 | |||
| 2011 | 36,067 (22.2) | 30,558 (16.9) | 5,509 (14.8) | ||
| 2012 | 24,201 (14.9) | 22,636 (12.5) | 4,979 (13.4) | ||
| 2013 | 20,347 (12.5) | 24,452 (13.5) | 4,879 (13.1) | ||
| 2014 | 19,227 (11.8) | 22,702 (12.5) | 5,149 (13.8) | ||
| 2015 | 16,320 (10.0) | 21,153 (11.7) | 4,108 (11.1) | ||
| 2016 | 15,584 (9.6) | 19,896 (11.0) | 4,023 (10.8) | ||
| 2017 | 14,569 (9.0) | 18,314 (10.1) | 3,945 (10.6) | ||
| 2018 | 8,709 (5.4) | 11,130 (6.2) | 2,378 (6.4) | ||
| 2019 | 7,653 (4.7) | 10,075 (5.6) | 2,154 (5.8) | ||
Abbreviations: SDiff, standardised difference; BPSD, behavioural and psychological symptoms of dementia; PRN, pro re nata (as needed); ADL, activities of daily living; PHQ-9, Patient Health Questionnaire-9.
aClinical conditions and health care use were measured in the year and other characteristics were measured in the 6 months before index date index date (i.e. opioid discontinuation for discontinuers and frequency-matched date for continuers)
bCovariates with SDiff >0.100 represent meaningful differences between groups.
cA patient can contribute to more than one COT episode.
dIncluded Asian, Hispanic, Native American and Pacific Islander individuals.
eHad <1.2% of missing values.
Pain-related hospitalisations and ED visits
Among discontinuers, the quarterly rates of pain-related hospitalisations and ED visits were highest (9.00 and 4.54 per 1,000 residents, respectively) in quarter 1, followed by a sharp decrease during quarter 2, which persisted through quarter 8. By contrast, continuers had stable quarterly rates of hospitalisations (1.58–2.02 per 1,000 residents) and ED visits (0.91–1.12 per 1,000 residents) during follow-up quarters (Figure 3A and B). After adjustment for covariates, discontinuing (vs. continuing) COT was associated with higher rates of pain-related hospitalisations (aRR 5.05; 95% CI: 4.18–6.11; P < 0.001) and pain-related ED visits (aRR 4.96; 95% CI: 3.78–6.50; P < 0.001) in the first quarter of follow-up (Figure 4A and B). However, the associations attenuated over time, with no significant difference between COT discontinuers and continuers at 1-year and 2-year follow-up for pain-related hospitalisations (aRR 1.05; 95% CI: 0.72–1.53; P = 0.789 and aRR 0.95; 95% CI: 0.59–1.52; P = 0.830) or pain-related ED visits (aRR 1.02; 95% CI: 0.64–1.62; P = 0.947 and aRR 1.31; 95% CI: 0.63–2.04; P = 0.679) (Figure 4A and B).
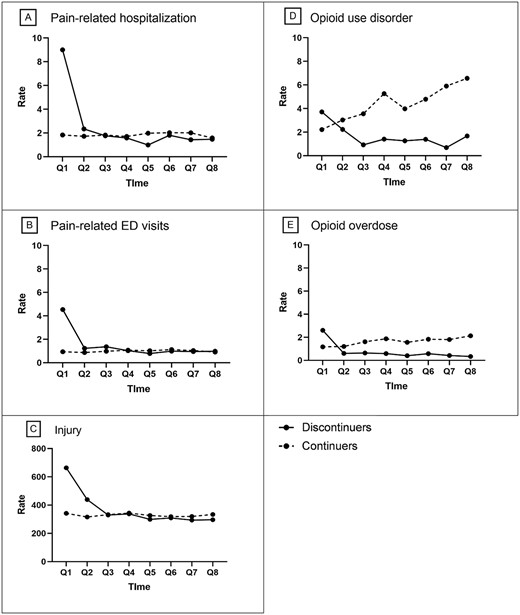
Crude quarterly rates of residents with adverse outcomes during follow-ups by residents who discontinued or continued chronic opioid therapy. The solid lines represent discontinuers, and the dashed lines represent continuers. Abbreviations: Q, quarter. Note: Rate is event per 1,000 residents. Data for quarters 1–4 were derived from the eligible sample with at least 1 year of follow-up; data for quarters 5–8, with at least 2 years of follow-up.
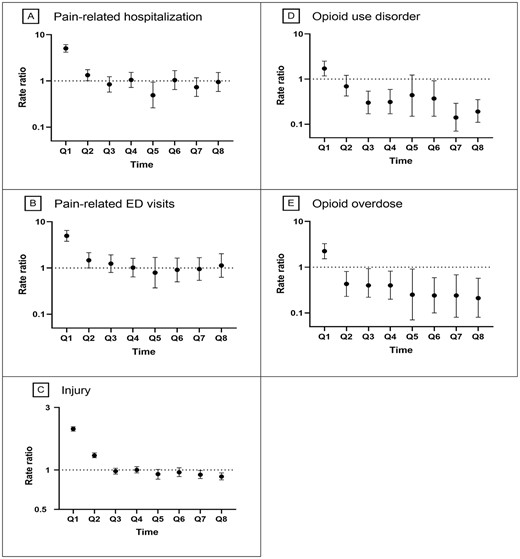
Adjusted quarterly associations of discontinuing chronic opioid therapy with adverse outcomes during follow-ups. Abbreviations: Q, quarter. Note: Data for quarters 1–4 were derived from the eligible sample with at least 1 year of follow-up; data for quarters 5–8, with at least 2 years of follow-up. We adjusted baseline variables through inverse probability of treatment weighting (IPTW) at quarter 1 and adjusted from baseline variables and time-varying confounders (including use of adjuvant analgesics, use of as needed pain medications, use of any pain intervention, use of CNS medications, presence of opioid-related side effects, physical function, pain intensity and dementia severity) through stabilised IPTW in a marginal structural model at quarters 2 through 8.
Injury
The quarterly crude rate of injury was the highest (663.62 per 1,000 residents) among discontinuers in quarter 1, followed by a sharp decline, whereas the rate was stable among continuers during all follow-ups (Figure 3C). After adjustment for covariates, discontinuing (vs. continuing) COT was associated with a higher rate of injurious events (aRR 2.06; 95% CI: 1.98–2.14; P < 0.001) in quarter 1, but the association attenuated thereafter. The adjusted rate of injury was similar (aRR 1.00; 95% CI: 0.95–1.06; P = 0.958) at the 1-year follow-up and was 11% lower (aRR 0.89; 95% CI: 0.84–0.95; P = 0.007) at the 2-year follow-up for discontinuers versus continuers (Figure 4C).
OUD and OD
COT discontinuers (vs. continuers) experienced higher rates of OUD (3.71 vs. 2.21 per 1,000 residents) and OD (2.60 vs. 1.17 per 1,000 residents) in quarter 1 but lower rates in quarter 2 and thereafter during follow-ups (Figure 3D and 3E). After adjustment for covariates, discontinuing (vs. continuing) COT was associated with higher rates of OUD (aRR 1.71; 95% CI: 1.17–2.49; P < 0.001) and OD (aRR 2.24; 95% CI: 1.53–3.27; P < 0.001) in quarter 1 (Figure 4D and E), but the associations attenuated thereafter. The adjusted rates of OUD and OD were, respectively, 69% (aRR 0.31; 95% CI: 0.17–0.59; P < 0.001) and 60% (aRR 0.40; 95% CI: 0.20–0.82; P = 0.012) lower at the 1-year follow-up, and 81% (aRR 0.19; 95% CI: 0.11–0.35; P < 0.001) and 79% (aRR 0.21; 95% CI: 0.08–0.57; P = 0.002) lower at the 2-year follow-up for discontinuers versus continuers (Figure 4D and E).
Results of subgroup analyses
We observed similar short- and long-term associations for pain-related hospitalisations for the subgroup of patients without baseline hospitalisation, pain-related ED visits among patients without baseline ED visits and injury among patients without baseline injury (Supplementary Tables 5–7). Consistent results were obtained for patients when stratified by baseline dementia severity, pain intensity and physical function (Supplementary Tables 8–10).
Discussion
In this study using national longitudinal data from older Medicare NH residents with ADRD and chronic non-cancer pain who received COT, although discontinuation of COT was associated with increased rates of all assessed outcomes in the first follow-up quarter, the associations attenuated over time. At 1-year and 2-year follow-ups, COT discontinuers (vs. continuers) had lower rates of injury, OUD and OD and had no difference in rates of pain-related hospitalisations and ED visits. The directions for the associations in subgroup analyses were consistent with those in the main analysis. Overall, our findings suggest that rates of adverse outcomes were lower or non-differential between COT discontinuers (vs. continuers) in the short and long terms.
The present research is among the first longitudinal studies to examine the short- and long-term safety of discontinuing COT among older patients with ADRD. Prior studies primarily focused on young or mixed young and older populations and used time-to-event analysis to estimate risk of harms in the short-term period (6–12 months) following tapering or abrupt discontinuing of COT [24] or high-dose opioids (≥50 MME/day) [10–15]. These studies showed that tapering or discontinuing COT was associated with increased risk of mortality [24], OD [10–12] [24], suicide [12, 13, 24], mental health crisis [10, 11] and termination of outpatient care [15]. Tapering stable COT was also associated with increased all-cause hospitalisations and ED visits, fewer primary care visits and reduced adherence to anti-hypertensive and anti-diabetic medications for comorbid chronic conditions during 1-year follow-up [36]. Our study focused on discontinuing rather than tapering COT because only 5% of residents with ADRD receiving the high-dose opioids require graduated dose reduction. This study adds to the existing literature by examining injury, a prevalent adverse outcome among patients with ADRD. Overall, our study showed that discontinuation of COT was associated with increased rates of all studied adverse outcomes in the first follow-up quarter, which is consistent with literature findings; however, the associations attenuated over time, with lower or non-differential rates in COT discontinuers versus continuers at 1-year and 2-year follow-ups.
The underlying mechanisms for our observations are not entirely clear. It is possible that patients who discontinue COT may immediately experience opioid withdrawal symptoms [37], leading to higher rates of pain-related hospitalisations and ED visits in early follow-up, which was also observed in prior studies [10, 36]. Because opioid withdrawal symptoms are temporary [37], the occurrence of these adverse outcomes among discontinuers may decrease over time as the symptoms subside. In addition, our observations could be explained by unmeasured confounders associated with COT discontinuation and adverse outcomes. Possible reasons, measured and unmeasured, for discontinuing opioids include (i) insufficient opioid effectiveness [38, 39], (ii) presence of aberrant drug-related behaviours (e.g. misuse) [38, 40, 41], (iii) opioid-related side effects (e.g. constipation, vomiting, sedation, and delirium) [38, 39], (iv) diagnosis of clinical conditions (e.g. substance use disorder) that contraindicate opioid use [38, 41], (v) availability of alternative pain therapies [42] and (vi) improved pain status [42]. All those reasons, except for the last two could lead to increased adverse outcomes during follow-ups. Although we attempted to account for most of the reasons aforementioned, the first and second reason—insufficient opioid effectiveness and aberrant drug-related behaviours—for discontinuing COT are unmeasured and may explain the increase in occurrence of adverse outcomes during early follow-up [41]. These two unmeasured reasons, however, do not seem to increase adverse outcomes in the long term likely because NH residents are closely monitored for symptoms and changes in health conditions, and these opioid-related issues may be addressed over time.
Our recent study demonstrated the benefit of discontinuing versus continuing COT in lowering the chance of experiencing worsening pain and depressive symptoms in both short and long terms among patients with ADRD and chronic non-cancer pain [31]. The present study adds evidence for clinicians weighing the risks of discontinuing versus continuing COT. Compared with continuation of COT, clinically appropriate discontinuation was associated with lower or non-differential rates of adverse outcomes in short and long terms. Because occurrences of adverse outcomes were high during the first 3 months following discontinuation of COT, clinicians should closely monitor patients who undergo discontinuation. For patients who continue COT with appropriate clinical considerations, clinical vigilance is needed to avoid injury, OUD or OD because the occurrence of these adverse outcomes increased over short and long terms.
Limitations
First, the Medicare claims data lacked information on medical notes (e.g. lack of opioid efficacy) that may justify COT discontinuation. Second, information was unavailable about whether discontinuation was initiated by patients or their providers and the clinical appropriateness of COT discontinuation. Third, Medicare prescription data do not capture self-paid prescriptions or opioids covered by non-Medicare programmes. Finally, our results can be generalised only to older NH residents with ADRD and chronic non-cancer pain who survive for ≥2 years.
Conclusions
Among older NH residents with ADRD and receipt of COT, compared with continuing COT, discontinuing COT was associated with lower or non-differential adverse outcomes in both short and long terms.
Declaration of Conflicts of Interest:
Dr. Winterstein has received research funding from Merck, Sharp and Dohme and consulting fees from Arbor Pharmaceuticals, Genetech Inc, Bayer Kg, Ipsen and Merck, Sharp and Dohme. None of these activities were related to the work described in the paper.
Declaration of Sources of Funding:
This work was supported by the National Institute on Aging [grant number R01AG073442]. The funders had no role in the design, execution, analysis and interpretation of data or writing of the study. The funder had no role in the design and conduct of the study; collection, management, analysis and interpretation of the data; preparation, review or approval of the manuscript and decision to submit the manuscript for publication.
Data Availability Statement:
Data cannot be shared publicly because data for these analyses were licensed to the authors through a data user agreement with the U.S. Centers for Medicare and Medicaid Services. Individual researchers can access the data by purchasing a licence through Research Data Assistant Center at https://resdac.org/.

Comments
Overall, the incidence rate of opioid overdose (OD) is rare (between 0.34 and 2.60 per 1000 residents over quarters) among our study NH population. Residents who receive long-term opioid use (LTOT) are not immune from OUD or OD, especially when the medications are not used as prescribed, or residents have access to diverted or illicit opioids. There is an increasing concern about diverting opioid medications or selling illicit drugs in nursing home settings [PMID: 35179452] given that a substantial proportion (16%) of patients hospitalized with OUD or OD are discharged to NHs for further care [PMID: 36209151].
We mentioned in the Discussion that our previous study examined pain intensity, physical function, and depressive symptoms as outcomes and found that discontinuing vs continuing LTOT was associated with a lower rate of worsening pain and depressive symptoms, but no difference in physical function [PMID: 37855270]. In both the previous and current studies, we refrained from including residents with hospice or palliative care because their pain treatment and expectation of pain relief differ from residents without such care.
https://www.asam.org/quality-care/definition-of-addiction
If the authors are using dependence, withdrawal or tolerance to define OUD they should know these are no longer part of the diagnostic criteria.
Furthermore, how could they overdose? If their medications are appropriately managed, overdose should be rare. Are they defining sedation as OD? Most people would prefer to be sedated rather than in agony and unable to express themselves to get relief. These are ADRD patients after all.
Secondly, the primary treatment goal for chronic pain is improving function and the second is relieving suffering, yet there was no mention of whether these patients had worse function or increased pain a year after their pain medications were stopped.
Hospital care for untreated pain did immediately increase. How much? Did these patients die?
Untreated chronic pain can cause increased confusion and surely increases suffering. Proudly reporting decreased side effects of medication without reporting changes in the primary goal of treatment is surely straining gnats while swallowing camels.