


Abstract
early mobilization after hip fracture (HF) is an important predictor of outcome, but knowledge of the consequences of not achieving the pre-fracture basic mobility status in acute hospital recovery is sparse.
we examined whether the regain of pre-fracture basic mobility status evaluated with the cumulated ambulation score (CAS) at hospital discharge was associated with 30-day post-discharge mortality and readmission.
this is a population-based cohort study.
using the nationwide Danish Multidisciplinary HF Database from January 2015 through December 2015, 5,147 patients 65 years or older undergoing surgery for a first-time HF were included. The pre-fracture and discharge CAS score (0–6 points with six points indicating an independent basic mobility status) were recorded. CAS was dichotomized as regained or not and entered into adjusted Cox regression overall analysis and stratified by sex, age, body mass index, Charlson comorbidity index, type of fracture, residential status and length of acute hospital stay. Outcome measures were 30-day post-discharge mortality and readmission.
overall mortality and readmission were 8.3% (n = 425) and 17.1% (n = 882), respectively. Mortality was 3.5% (n = 71) among patients who regained their pre-fracture CAS score compared with 11.4% (n = 354) among those who did not. Adjusted hazard ratios for 30-day mortality and readmission were 2.76 (95% confidence interval [CI] = 2.01–3.78) and 1.26 (95% CI = 1.07, 1.48), respectively, for patients who did not regain their pre-fracture CAS compared with those who did.
we found that the loss of pre-fracture basic mobility level upon acute hospital discharge was associated with increased 30-day post-discharge mortality and readmission after a first time HF.
Key points
Association between early basic mobility recovery and 30-day mortality and readmission after hip fracture surgery is sparse.
The cumulated ambulation score (CAS) is a reliable and valid basic mobility outcome measure used in national databases.
Loss of pre-fracture CAS points was associated with a 2.8 times increased risk of 30-days post-discharge mortality in an adjusted analysis.
Loss of pre-fracture CAS points was associated with a 26% increased risk of 30-days readmission in an adjusted analysis.
The CAS could be considered as an important outcome parameter in other national hip fracture databases.
Introduction
Although enhanced recovery programs [1] and increased focus on national registers for patients undergoing hip fracture (HF) surgery [2] seem to have reduced morbidity and mortality rates [3], these are still considered high [4, 5]. Positively, early mobilization within 24 h is a focus area in most national programs [2], but the optimum treatment [6] and later functional outcome [7] are still being discussed. However, except for the latest report from the Irish HF Database [8], the nationwide Danish Multidisciplinary HF Database (DMHFD) seems to be the only national database that systematically monitors the early basic mobility status of patients with HF at the time of acute hospital discharge [9]. This seems problematic as a low ambulatory level during the first postoperative days is associated with an increased risk of 30-day mortality [10] and also post-discharge at later time points, if the pre-fracture basic mobility status is not regained upon acute hospital discharge [11], in single-center studies. Thus, with the global focus of a further reduction in mortality rates after HF, it seems highly relevant to further explore the importance of the early recovery of an independent basic mobility status in large-scale population-based studies. Importantly, the post-surgery basic mobility status is a modifiable factor as indicated by an intensive acute hospital physiotherapy program [12], in comparison with well-established and non-modifiable pre-surgery predictors of mortality [13, 14]. At the same time, a 30-day readmission rate of 4.5–23.1% after HF was reported in a 2017 systematic review, with the functional status as one of the strongest predictors [15]. However, none of the studies evaluated the association between readmission and the loss of pre-fracture basic mobility status at the time of acute hospital discharge.
In this population-based cohort study, we, therefore, assessed the association between the regain of the pre-fracture basic mobility status, evaluated with the cumulated ambulation score (CAS) [10, 16], at the time of acute hospital discharge and 30-day post-discharge mortality and readmission after a first-time acute HF, while taking many non-modifiable pre-surgery predictors of mortality into account.
Methods
Data sources
The data are given in Supplementary data Appendix A.
Participants
We identified all patients 65 years or older with a first-time HF in the DMHFD operated from 1 January 2015 to 31 December 2015.
Exposures
The CAS [16], which since the year 2012 has been an obligatory pre-fracture (questionnaire) and acute hospital (objectively assessed) discharge score in the DMHFD, was used as our primary exposure. It evaluates three basic mobility activities: getting in and out of bed, sit-to-stand-to-sit in a chair with arms and indoor walking with or without a walking aid [16]. Each of the three activities is scored from 0 to 2 and cumulated to a 1-day score from 0 to 6, with six points equal to an independent basic mobility level [16] (please see Supplementary data Appendix B). The change in CAS level from pre-fracture to acute hospital discharge was dichotomized as regained versus not regained. Furthermore, we defined the severity of pre-fracture basis mobility loss with CAS points lost from 1 to 6 points, e.g. a patient with an independent pre-fracture CAS of six points but with a discharge CAS of four points was coded with a loss of two CAS points.
Variables
Data on sex (men vs. women), age (65–74, 75–84 and ≥85 years), body mass index (BMI) (<18.5, ≥18.5–25 and ≥25 kg/m2), type of fracture (femoral neck fracture vs. per- and subtrochanteric fracture), pre-fracture residential status (own home vs. 24-h care center) and length of acute hospital stay (0–5, 6–10, 11–14 and >14 days) were collected from the DMHFD. Based on Danish National Patient Register (DNPR) data from 1977 through the time preceding the HF surgery date, we computed the Charlson comorbidity index (CCI) [19] score and reported as 0 = low, 1–2 = medium and +3 = high comorbidity, for each patient.
Outcomes
Mortality within 30 days of acute hospital discharge was obtained from the Danish Civil Registration System. The post-discharge focus instead of the more often studied 30-day post-surgery design [3] was chosen to secure that the follow-up time to mortality in relation to the CAS recovery was the same for all patients. Any readmission within 30 days of discharge was obtained from DNPR.
Statistics
We tabulated characteristics of the study populations by the group of patients who regained pre-fracture CAS at discharge and those who did not. We computed 30-day mortality risk and 30-day risk of any readmission. Crude and adjusted hazard ratios (HRs) with 95% confidence intervals (CIs) were calculated using Cox proportional hazards regression models. HR was adjusted for sex, age category, BMI category, CCI category, type of fracture, residential status and length of stay (continuous). We compared patients who did not regain pre-fracture CAS at discharge with patients who did regain pre-fracture CAS at discharge. Furthermore, we compared patients with the loss of one to six CAS points to patients who did not have any loss of CAS points at discharge. All analyses were performed overall and stratified by sex, age category, BMI category, CCI category, type of fracture, residential status and length of stay. Follow-up started at the day of discharge for both readmission and mortality. For readmission analyses, patients were followed up to readmission, death or 30 days, whereas for mortality analyses, patients were followed up to death or 30 days.
The assumption of proportional hazards in the dataset were controlled visually by plotting log (cum hazard) as a function of follow-up time and found to be appropriate. All statistical analyses were performed with the use of SAS 9.4 statistical software (SAS Institute Inc., Cary, USA).
Results
During the study period, 6,033 first-time patients with acute HF from 25 hospitals in Denmark were identified, of whom 5,501 (91.2%) had a pre-fracture CAS score. Of them, 5,489 patients were alive at discharge, of whom 5,147 (93.8%) had both a pre-fracture and a discharge CAS score, forming the study group. Compared to the 5,147 patients with complete CAS data, the 879 patients not included due to missing CAS scores (logistics) were slightly more men (29.7 vs. 32.7%), older (median age 83 vs. 84 years) and sicker (CCI category high: 21.0 vs. 24.1%). Table 1 reports patient characteristics according to the regain of the pre-fracture CAS (n = 2,050) or not (n = 3,097) at the time of acute hospital discharge. Length of hospital stay reached a mean of 8.5 days for those with regained CAS compared to 9.5 days for those who did not (Table 1).
Characteristics and outcomes of patients within the 1-year nationwide cohort
| Variables | Pre-fracture CAS regained at discharge | Total, n (%) | |
|---|---|---|---|
| No, n (%) | Yes, n (%) | ||
| Total | 3,097 (60) | 2,050 (40) | 5,147 |
| Women | 2,220 (71.7) | 1,398 (68.2) | 3,618 (70.3) |
| Men | 877 (28.3) | 652 (31.8) | 1,529 (29.7) |
| Age category | |||
| 65–74 | 447 (14.4) | 653 (31.8) | 1,100 (21.4) |
| 75–84 | 1,058 (34.2) | 818 (39.9) | 1,876 (36.4) |
| 85+ | 1,592 (51.4) | 579 (28.2) | 2,171 (42.2) |
| Age in years | |||
| Mean (SD) | 84.3 (7.9) | 79.5 (8.1) | 82.4 (8.3) |
| Median (minimum–maximum) | 85.2 (65–106) | 79.3 (65–102) | 83.0 (65–106) |
| Residential status | |||
| Own home | 2,291 (74.0) | 1,788 (87.2) | 4,079 (79.3) |
| Nursing home | 641 (20.7) | 159 (7.8) | 800 (15.5) |
| Missing | 165 (5.3) | 103 (5.0) | 268 (5.2) |
| Charlson comorbidity index category | |||
| Low (0) | 1,113 (35.9) | 963 (45.7) | 2,049 (39.8) |
| Medium (1–2) | 1,267 (40.9) | 749 (36.5) | 2,016 (39.2) |
| High (3+) | 717 (23.2) | 365 (17.8) | 1,082 (21.0) |
| Body mass index category | |||
| Underweight (<18.5) | 244 (7.9) | 161 (7.9) | 405 (7.9) |
| Normal (18.5 to <25) | 1,485 (48.0) | 1,002 (48.9) | 2,487 (48.3) |
| Overweight (≥25) | 913 (29.5) | 645 (31.5) | 1,558 (30.3) |
| Type of fracture | |||
| Cervical femoral neck | 1,540 (49.7) | 1,318 (64.3) | 2,858 (55.5) |
| Per- and subtrochanteric | 1,557 (50.3) | 732 (35.7) | 2,289 (44.5) |
| Type of surgery | |||
| Osteosynthesis | 2,071 (66.9) | 1,255 (61.2) | 3,326 (64.6) |
| Total and hemiarthroplasty | 1,026 (33.1) | 795 (38.9) | 1,821 (35.4) |
| Length of stay in days (grouped) | |||
| 0–5 | 705 (22.8) | 531 (25.9) | 1,236 (24.0) |
| 6–10 | 1,392 (45.0) | 1,038 (50.6) | 2,430 (47.2) |
| 11–14 | 512 (16.5) | 287 (14.0) | 799 (15.5) |
| 14+ | 488 (15.8) | 194 (9.5) | 682 (13.3) |
| Length of stay in days | |||
| Mean (SD) | 9.5 (7.3) | 8.5 (7.3) | 9.1 (7.3) |
| Median (minimum–maximum) | 7.9 (0.78–114) | 7.0 (0.95–191) | 7.6 (0.78–191) |
30-day post-discharge mortality
Forty percent (n = 2,050) of the patients regained their pre-fracture CAS score. Mortality was 3.5% (n = 71) for the patients who regained their CAS score compared with 11.4% (n = 354) for those who did not. The crude HR of 30-day mortality was 3.44 (95% CI, 2.67, 4.44) times higher for those who did not regain their pre-fracture CAS level compared with those who did (Table 2). Correspondingly, in adjusted analyses, the risk of 30-day mortality was 2.76 (95% CI, 2.01, 3.78) times higher if the pre-fracture CAS was not regained. HRs for 30-day post-discharge mortality in stratified and adjusted analyses of all variables ranged from 1.18 (95% CI, 0.73, 1.89) to 4.11 (95% CI, 2.72, 6.21) if the CAS was not regained (Table 2). The severity of CAS points lost (from 1 to 6 points) was associated with an increased risk for 30-day mortality (Figure 1), as indicated by a HR = 1.25 (95% CI, 0.77, 2.03) if one point was lost to an HR of 11.7 (95% CI, 7.17, 19.2) if six points were lost, compared to those who did not lose any CAS points (see Supplementary data Figure S1 and Table S1 A–H). Corresponding, adjusted and stratified analyses for all variables showed a similar trend and especially if admitted from own home (See Supplementary data Figure S1 and Table S1 A–H).
Cox regression with crude and adjusted HR for 30-day post-discharge death
| Variables | Number of death (number at risk) | Crude HR (95% CI) | Adjusted* HR (95% CI) | |
|---|---|---|---|---|
| Pre-fracture CAS not regained | Pre-fracture CAS regained | |||
| Overall | 354 (3,097) | 71 (2,050) | 3.44 (2.67; 4.44) | 2.76 (2.01; 3.78) |
| Stratified by | ||||
| Women | 191 (2,220) | 41 (1,398) | 3.02 (2.16; 4.23) | 2.32 (1.50; 3.58) |
| Men | 163 (877) | 30 (652) | 4.35 (2.95; 6.41) | 3.40 (2.12; 5.46) |
| Age category | ||||
| 65–74 years | 30 (447) | 12 (653) | 3.75 (1.93; 7.30) | 1.97 (0.87; 4.46) |
| 75–84 years | 98 (1,058) | 21 (818) | 3.73 (2.33; 5.96) | 3.04 (1.76; 5.25) |
| 85+ years | 226 (1,592) | 38 (579) | 2.26 (1.61; 3.18) | 2.66 (1.71; 4.13) |
| BMI category | ||||
| 46 (244) | 8 (161) | 4.10 (1.95; 8.61) | 4.01 (1.84; 8.75) | |
| 18.5 to <25 | 153 (1,485) | 33 (1,002) | 3.25 (2.23; 4.73) | 2.28 (1.53; 3.38) |
| ≥25 | 78 (913) | 11 (645) | 5.17 (2.75; 9.71) | 3.90 (1.93; 7.87) |
| CCI category | ||||
| Low (0) | 86 (1,113) | 15 (936) | 4.97 (2.88; 8.59) | 3.63 (1.69; 7.79) |
| Medium (1–2) | 160 (1,267) | 37 (749) | 2.67 (1.87; 3.81) | 2.19 (1.42; 3.37) |
| High (3+) | 108 (717) | 19 (365) | 3.05 (1.88; 4.94) | 3.21 (1.76; 5.87) |
| Fracture type | ||||
| Femoral neck | 185 (1,540) | 42 (1,318) | 3.96 (2.84; 5.52) | 2.77 (1.87; 4.12) |
| Trochanteric | 169 (1,557) | 29 (732) | 2.84 (1.91; 4.20) | 2.77 (1.63; 4.71) |
| Residential status | ||||
| Own home | 205 (2,291) | 37 (1,788) | 4.48 (3.16; 6.34) | 4.11 (2.72; 6.21) |
| Care center | 127 (641) | 30 (159) | 1.06 (0.71; 1.57) | 1.18 (0.73; 1.89) |
| Length of stay in days (grouped) | ||||
| 0–5 | 104 (705) | 24 (531) | 3.43 (2.20; 5.35) | 2.10 (1.13; 3.87) |
| 6–10 | 107 (1,392) | 25 (1,038) | 3.29 (2.13; 5.07) | 2.77 (1.60; 4.79) |
| 11–14 | 53 (512) | 9 (287) | 3.42 (1.70; 6.91) | 3.04 (1.43; 6.46) |
| 14+ | 90 (488) | 13 (194) | 2.94 (1.66; 5.22) | 3.72 (1.77; 7.79) |
*Adjusted for sex, age category, BMI category, CCI category, type of fracture, residential status and length of acute hospital stay (continuous).
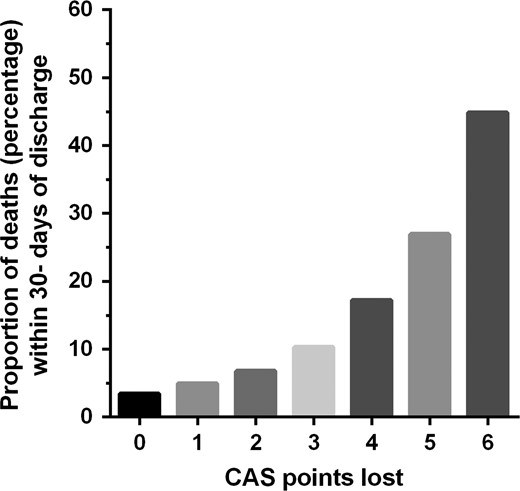
Association between change in CAS against 30-day post-discharge mortality.
30-Day risk of any readmission
Readmissions were more common for patients who did not regain their pre-fracture CAS (572/3,097 [18.5%]) compared with patients who did (310/2,050 [15.1%]). Compared with patients who regained their CAS, those who did not had a 31% increased crude risk of readmission (HR = 1.31 [95% CI, 1.14, 1.51]) decreasing to 26% in adjusted analysis (HR = 1.26 [95% CI, 1.07, 1.48]) (Table 3). Correspondingly, in stratified crude analyses, increased risk of 30-day readmission was seen for most variables (Table 3). Still, in the adjusted and stratified analysis, this was only the case for those who were women, in age category 75–84 years, with BMI subgroup 18.5 to <25 and CCI subgroup medium, a cervical femoral fracture, and if admitted from own home (Table 3). The association of the severity of CAS points' lost and risk of readmission for all variables are shown in Supplementary data Table S2 A–H.
Cox regression with crude and adjusted HR for 30-day post-discharge readmission
| Variables | Number of readmissions (number at risk) | Crude HR (95% CI) | Adjusted* HR (95% CI) | |
|---|---|---|---|---|
| Pre-fracture CAS not regained | Pre-fracture CAS regained | |||
| Overall | 572 (3,097) | 310 (2,050) | 1.31 (1.14, 1.51) | 1.26 (1.07, 1.48) |
| Stratified by | ||||
| Women | 387 (2,220) | 184 (1,398) | 1.41 (1.18, 1.68) | 1.31 (1.06, 1.62) |
| Men | 185 (877) | 126 (652) | 1.22 (0.97, 1.53) | 1.14 (0.88, 1.48) |
| Age category | ||||
| 65–74 years | 81 (447) | 85 (653) | 1.48 (1.09, 2.00) | 1.29 (0.91, 1.81) |
| 75–84 years | 188 (1,058) | 111 (818) | 1.40 (1.11, 1.77) | 1.38 (1.05, 1.81) |
| 85+ years | 303 (1,592) | 114 (579) | 1.02 (0.82, 1.27) | 1.12 (0.87, 1.43) |
| BMI category | ||||
| <18.5 | 47 (244) | 30 (161) | 1.18 (0.75, 1.85) | 1.16 (0.71, 1.91) |
| 18.5 to <25 | 281 (1,485) | 145 (1,002) | 1.40 (1.14, 1.71) | 1.28 (1.03, 1.59) |
| ≥25 | 159 (913) | 79 (645) | 1.52 (1.16, 1.99) | 1.22 (0.91, 1.62) |
| CCI category | ||||
| Low (0) | 161 (1,113) | 99 (936) | 1.45 (1.13, 1.86) | 1.23 (0.91, 1.67) |
| Medium (1–2) | 242 (1,267) | 121 (749) | 1.26 (1.01, 1.56) | 1.45 (1.12, 1.89) |
| High (3+) | 169 (717) | 90 (365) | 1.04 (0.81, 1.34) | 1.01 (0.76, 1.35) |
| Fracture type | ||||
| Cervical femoral neck | 298 (1,540) | 193 (1,318) | 1.45 (1.21, 1.73) | 1.34 (1.08, 1.66) |
| Per- and subtrochanteric | 274 (1,557) | 117 (732) | 1.16 (0.93, 1.44) | 1.13 (0.88, 1.45) |
| Residential status | ||||
| Own home | 430 (2,291) | 257 (1,788) | 1.41 (1.21, 1.64) | 1.37 (1.14, 1.63) |
| Care center | 106 (641) | 40 (159) | 0.64 (0.45, 0.92) | 0.73 (0.49, 1.09) |
| Length of stay in days (grouped) | ||||
| 0–5 | 108 (705) | 60 (531) | 1.47 (1.08, 2.02) | 1.20 (0.81, 1.79) |
| 6–10 | 234 (1,392) | 160 (1,038) | 1.14 (0.93, 1.39) | 1.14 (0.90, 1.45) |
| 11–14 | 97 (512) | 41 (287) | 1.42 (0.99, 2.05) | 1.38 (0.92, 2.08) |
| 14+ | 133 (488) | 49 (194) | 1.22 (0.89, 1.69) | 1.34 (0.92, 1.95) |
*Adjusted for sex, age category, BMI category, CCI category, type of fracture, residential status and length of acute hospital stay (continuous).
Discussion
In this nationwide study of 5,147 elderly patients with HF, we found that the risk of 30-day mortality was substantially increased for those who had not regained their pre-fracture basic mobility CAS level at the time of acute hospital discharge, compared with those who did. Furthermore, the risk of 30-day mortality increased with increasing loss of CAS points for all variables. We also found that the risk of 30-day readmission was increased for those who did not regain their pre-fracture CAS level, compared with those who did, although not as pronounced as for mortality.
Comparison with previous mortality literature
To our knowledge, this is the first large-scale population-based study to examine the association between the regain of the pre-fracture basic mobility level in the acute hospital and 30-days post-discharge mortality, this here including taking the non-modifiable variables into account. With the ongoing focus on factors influencing and reducing mortality after HF [11, 13, 14, 20–25], increased focus on the post-surgery mobility level, beyond the first 12–24 post-surgery hours [10, 11, 26–29] considered a modifiable variable, therefore, seem highly relevant, also in comparison with a large number of well-established but non-modifiable variables [13, 14]; that is although clinical guidelines for HF recovery [30] recommend that ‘older adults should mobilize the day after surgery and receive regular physical therapy post fracture’ [31], these might not be sufficient to secure mobility recovery thereafter, in view of the sedentary behavior seen during the recovery process [31]. Thus, findings of a recent systematic review indicate that a HF is associated with low levels of physical activity and below recommendations, both in the acute hospital and when at home [31]. Based on a registry, we cannot establish causality, but literature underlines that a non-independent basic mobility status is associated with a low physical activity level (fewer minutes standing or walking after HF) [32], which again seems associated with an increased risk of mortality in older people [33, 34]; that is patients who reached an independent basic mobility status in the acute hospital increased their 24-h upright time from a median of 60 to 91 min from the day before to after achievement of independent mobility when evaluated with the CAS [32]. Of importance, our findings in relation to the severity of CAS points' lost also indicate that the early rehabilitation should not only be focused on the more often studied, achievement of an independent CAS level [35, 36], since less CAS points' lost, the more patients seem to survive. Nonetheless, the full and early achievement of independent mobility still should be the primary goal for all patients. However, this is not that easy for all patients and influenced by a large number of factors, such as pain, anemia, fatigue, ability to complete planned physiotherapy, age, pre-fracture function, fall location, time to surgery and the fracture type [35–38]. Positively, some of these factors are considered modifiable and, therefore, issues potentially can be handled in an enhanced recovery program. At the same time, we know that patients with HF in many settings and countries only stay a short time in the acute hospital, before being discharged back to their previous residence or more often to 24-h rehabilitation setting [12, 39] and based on medical readiness rather than the fulfillment of functional discharge criteria. Still, all patients with HF, and no matter if they fulfill such basic criteria at the time of acute hospital discharge or during further rehabilitation, need further rehabilitation to reach a full recovery status. Therefore, and independent of settings, the long-term rehabilitation goal should be a full recovery of the pre-fracture functional level (as a minimum), while the recovery of the basic mobility status evaluated with the CAS seems as a most relevant first-step, and potentially lifesaving rehabilitation goal, which should be within the reach for most patients with HF.
Comparison with previous readmission literature
Being a strong predictor of mortality [15, 40, 41], there seems to be a growing interest in readmission rates after HF and findings of a systematic review indicate that non-modifiable patient-related risk factors are stronger predictors of 30-day readmission compared to hospital-related factors [15]. However, although a large number of factors were evaluated in the 2017 systematic review [15], only one study seems to have established the early post-surgery functional level as a predictor of acute hospital readmission among patients discharged to an inpatient rehabilitation facility [26]. Therefore, the present study adds to the sparse knowledge of the post-surgery ambulatory level as a predictor of early readmission to hospital. Thus, we found that the risk of readmission in the crude and adjusted analyses was increased with 31 and 26%, respectively, if the pre-fracture CAS was not achieved upon hospital discharge. Nonetheless, the importance of the basic mobility recovery in relation to short-term readmission seems inferior to other factors in comparison with the much stronger risk of mortality in the present study. Suggested explanation for difference between mortality and readmission is not the case in Denmark. Support at own home and care center, as well as good collaborations with the general practitioner, is the most likely explanation why CAS level affect mortality more than readmission.
Strengths and limitations
The strength of our study is the large-scale 1-year cohort of more than 5,000 patients with HF with complete follow-up, which to our knowledge, is the first nationwide study to examine the importance of loss of pre-fracture CAS level at the time of acute hospital discharge. Strength is also that the CAS is a well-validated and reliable outcome measure used internationally in patients with HF. Furthermore, our exposures (regain of pre-fracture CAS and CAS points' lost) were adjusted for an extensive list of potential confounders, including the length of hospital stay, in relation to the risk of 30-day post-discharge mortality and readmission.
A potential limitation is that not all patients who underwent surgery for a first-time HF within the 1-year study period were included, due to unknown reasons for missing CAS data. Still, we believe that the prospective data collection minimized the risk of selection bias and patients without complete CAS data were only slightly; more men, older and sicker, compared to those studied.
Conclusions
In this large national HF registry study of 5,147 Danish patients, we found that the loss of pre-fracture basic mobility level before acute hospital discharge was strongly associated with 30-day post-discharge mortality, also when taking the non-modifiable variables into account. Furthermore, such loss also influenced readmission rates within the same time-period, although not as pronounced as for mortality. This indicates the importance of basic mobility recovery as a primary early rehabilitation goal after HF and that the CAS could be considered as an outcome parameter in other HF registries and enhanced recovery programs.
Declaration of Conflicts of Interest: None.
Declaration of Sources of Funding: This work was supported by a grant from Aarhus University Research Foundation and by the Program for Clinical Research Infrastructure (PROCRIN), established by the Lundbeck Foundation and the Novo Nordisk Foundation. The funders had no role in the design and conduct of the study; collection, management, analysis and interpretation of the data; preparation, review or approval of the manuscript and decision to submit the manuscript for publication.
References
PLEASE NOTE: The very long list of references has meant that only the most important are listed here and are represented by bold type throughout the text. The full list of references is available in Appendix C in Supplementary data, available in Age and Ageing online.
Irish Hip Fracture Database. National Report.

Comments