


Abstract
The study of social parasitism faces numerous challenges arising from the intricate and intranidal host–parasite interactions and the rarity of parasites compared to their free-living counterparts. As a result, our understanding of the ecology and evolution of most social parasites remains limited. Using whole-genome and reduced-representation sequence data, we conducted a study to fill knowledge gaps on host use, colony social structure, and population genetics of the facultative dulotic ant Formica aserva Forel. Our study reveals the remarkable ability of F. aserva to exploit at least 20 different host species across its wide geographic distribution. In some cases, one social parasite colony exploits multiple hosts simultaneously, suggesting a high degree of generalization even at a local spatial scale. Approximately 80% of the colonies were monogyne (with a single queen), with many exhibiting higher rates of polyandry compared to most Formica ants. Although we identified a supergene on chromosome 3, its association with colony structure remains uncertain due to the rarity of polygyny in our sample. Population genetic analyses reveal substantial geographic population structure, with the greatest divergence between California populations and those from the rest of the range. Mitochondrial population structure differs from structure inferred from the nuclear genome on a broad geographic scale, suggesting a possible role of adaptive introgression or genetic drift. This study provides valuable insights into the ecology and evolution of F. aserva, underscoring the need for further research to decipher the complexities of host interactions and the genetic mechanisms that regulate social structure.
Introduction
Social parasitism is a particularly intriguing type of interspecific association, where the parasitic species takes advantage of the cooperative nature and reproductive efforts of the host. While observed across various animal taxa (Spottiswoode et al. 2012, Tizo-Pedroso and Del-Claro 2014, Scarparo et al. 2019, Moore et al. 2022), social parasitism finds its most notable representation in hymenopteran social insects (ants, bees, and social wasps), where parasites rely on the cooperative behavior of other social species to initiate their colonies and rear their offspring (Buschinger 2009, De la Mora et al. 2020, Rabeling 2021). Currently, 492 species of social parasites are documented across all 3 clades of eusocial Hymenoptera, with ants constituting 80% of socially parasitic species (Rabeling 2021). The dynamic nature of parasite-host antagonistic interactions often leads to escalatory arms races (Kawecki 1998), characterized by the continual evolution of novel defenses and exploitative strategies.
Despite the fascinating nature of social parasitism, our understanding of the majority of described social parasites and their interactions with host species remains incomplete. A substantial portion of our knowledge is based on the extensive investigations of a few parasitic groups, such as Polyergus and Temnothorax ants, rigorously studied from a variety of perspectives, including population genetics (e.g., Brandt et al. 2007, Torres et al. 2018, Sapp et al. 2020), chemical strategies (e.g., d’Ettorre et al. 2002, Brandt et al. 2005), and impact on the host (e.g., Foitzik et al. 2009, Torres and Tsutsui 2016). In contrast, information on most other parasitic species is sparse, with insights usually limited to sporadic observations on one or a few colonies or confined to specific populations.
In the genus Formica, social parasitism is notably overrepresented compared to all other ant genera, with 48.8% of Formica species identified as social parasites (temporary n = 68; dulotic n = 14; inquiline n = 2), with the remaining free-living (non-parasitic) congeneric species as potential hosts (Borowiec et al. 2021). The 84 parasitic species cluster within a monophyletic clade (Borowiec et al. 2021). None of the parasites share a sister-species relationship with their host, following the ‘loose’ version of Emery’s Rule (defined as cases where host and parasite are congeneric, but not sister species) (Ward 1989). Many of these parasites are facultative, signifying their ability to initiate colonies independently or exploit existing allospecific colonies. Despite the high number of social parasites, our understanding of most parasite–host associations within the genus remains limited. Instead, the parasitic strategies of some Formica species have been inferred based on limited data and their phenotypic similarity to other species, with North American species relatively understudied compared to European species.
Over the past decade, the genus Formica has obtained significant attention from evolutionary biologists, particularly due to the identification of a cluster of tightly linked genes on chromosome 3 associated with colony queen number (Purcell et al. 2014). Referred to as a social supergene, the function of this gene cluster has been investigated primarily in free-living species (Purcell et al. 2014, Brelsford et al. 2020, McGuire et al. 2022, Pierce et al. 2022, Scarparo et al. 2023). Despite interspecific differences in the supergene genotype distribution within colonies, we consistently find that individuals from single-queen (monogyne) colonies predominantly have the monogyne-associated haplotype (MM females and M males), while most individuals from multiple-queen (polygyne) colonies have at least one copy of the polygyne-associated (P) haplotype. While supergene variation appears to be present in many Formica social parasites based on an assessment of haplotype-specific variation in a single gene on chromosome 3 (Purcell et al. 2021), its structure and function have only been studied in a limited sample of 2 European species, F. exsecta and F. truncorum, both temporary parasites (Brelsford et al. 2020). A second supergene on chromosome 9, recently discovered in the free-living species F. cinerea, has been linked to queen miniaturization and is speculated to be associated with incipient intraspecific social parasitism (Scarparo et al. 2023).
This study aims to elucidate aspects of the parasitic lifestyle, colony social structure, supergene variation, and population structure in the facultative dulotic Formica aserva, formerly identified as F. subnuda and F. sanguinea aserva (Wheeler 1909, Savolainen and Deslippe 1996). Dulotic species have previously been called ‘slave-makers’. However, here we refer to them as dulotic or kidnapper to avoid this controversial metaphor (as advocated by Herbers 2007).
Widely distributed throughout Canada and the United States, F. aserva lives primarily in coniferous forest habitat but is occasionally found in other habitats including prairie, sagebrush, and deciduous forest (Naumann et al. 1999). Similar to other dulotic ants, F. aserva parasitic queens can establish colonies by infiltrating congeneric host ant nests, eliminating the resident queen, and prompting the host workers to rear the parasitic brood. As the population of parasitic workers grows, dulotic workers engage in raids on the nests of neighboring ant species to kidnap pupae, increasing the worker force of their own colony. However, it has been observed that F. aserva only occasionally raids host colonies, and when it does, the kidnapped hosts appear in low frequency (Savolainen and Deslippe 1996). Despite its extensive geographical distribution, common occurrence, and intriguing lifestyle, information about F. aserva’s interactions with host species is currently fragmented and largely based on sporadic observations. No population genetic data are available. To address this knowledge gap, we conducted a large-scale geographic study using whole-genome and reduced-representation sequence data to unveil unexplored aspects of the natural history of F. aserva. Specifically, we delineate the parasite’s host use by analyzing both published records and data collected for this study and ask whether this facultative dulotic species with a wide geographic distribution exploits a large number of host species, as observed for the closely related F. sanguinea (Czechowski et al. 2002). We examine supergene structure, colony queen number, and polyandry rates. Finally, we characterize the population structure using nuclear and mitochondrial markers.
Materials and Methods
Sample collection
Formica aserva and its hosts were collected over multiple years (2016 to 2022) in locations from California to Alaska and east to South Dakota, as part of an extensive research project focused on North American Formica species. The ants were obtained from colonies or along designated transects. For colony collection, we collected about 15 F. aserva workers directly from the nest entrance and, when observed, up to 15 workers of the host species. Because we did not excavate nests, the actual parasitism rate may exceed our observations. For transect collection, we sampled the first Formica individual observed every hundred meters along a road or trail. A transect was considered completed after 8 Formica ants were collected. A few F. aserva workers were collected opportunistically outside of our colony and transect sampling protocols. All collected samples were preserved in 100% ethanol. A total of 258 individuals from colonies, 44 from transects, and 7 from opportunistic samples were sequenced for this study. Three additional F. aserva individuals were already sequenced for a previous study (Purcell et al. 2021) and were included in the analyses reported here. A detailed overview of each sample can be found in Supplementary Table S1.
DNA extraction
For individuals collected before 2022, DNA extraction from the head and thorax of workers was primarily performed using a Qiagen DNeasy Blood & Tissue Kit, following the insect tissue protocol with several modifications. In particular, we manually ground the tissue in a tube immersed in liquid nitrogen, used alternatively sourced spin columns (BPI-tech.com), used 70% ethanol for the second DNA wash, and eluted the DNA in 30 µL of elution buffer. Individuals collected in 2022 were extracted using the Qiagen QiaAmp 96 protocol using a Qiagen QiaCube HT extraction robot. As above, we manually ground tissue and placed it overnight in proteinase K and buffer ATL solution. We then transferred the supernatant to a QiaCube deep well plate and completed the DNA purification and elution (in 100 µL of EB buffer) using the robot.
RADseq library preparation
We used a double-digest restriction site-associated DNA sequencing (RADseq) approach to sequence samples, following the protocol outlined in Brelsford et al. (2016) (Supplementary Table S1). DNA from individuals sequenced in the 2016, 2017, and 2019 batches was digested using the restriction enzymes MseI and SbfI, while DNA from individuals sequenced in the 2021 and 2022 batches was digested using MseI and PstI. Subsequently, a universal MseI adapter and uniquely barcoded Sbfl or PstI adapter were ligated to each sample. Small DNA fragments were removed using Sera-Mag magnetic beads (Rohland and Reich 2012) in a 0.8:1 ratio (beads:sample solution). Amplification of each sample occurred in 4 separate 5 μl PCR reactions with Q5 Hot Start DNA Polymerase, incorporating plate-specific indexed Illumina primers. The replicate PCR products for each sample were pooled, additional dNTP and primer mix were added, and a final PCR cycle was conducted. We visualized the PCR product using gel electrophoresis and pooled samples that amplified successfully. For the 2016 and 2017 batches, we ran pooled samples on a 2.5% agarose gel, excised DNA in the 300-500 bp range, and used the Qiagen MinElute gel extraction kit following the manufacturer’s protocol to extract DNA from the gel fragment. For the 2019, 2021, and 2022 libraries, we removed small fragments using Sera-Mag beads in a 0.8:1 ratio (beads: sample solution). A total of 253 F. aserva workers and 20 host samples were analyzed using RAD-seq data (Supplementary Table S1).
Whole-genome resequencing
We sequenced the genomes of 39 F. aserva samples and 4 host individuals using the plexWell LP 384 Library Preparation Kits and following the standard protocol (SeqWell). Before starting the library preparation, we diluted the DNA of each sample to a concentration of 1.7 ng/μl. We also included whole genomes from 3 samples sequenced for a previous analysis (Purcell et al. 2021), which were prepared using KAPA (n = 2) and Illumina (n = 1) genome library preparation kits, respectively (Supplementary Table S1).
Species identification
Identifying Formica species through morphological characteristics is notably challenging. Consequently, we used genome-wide markers to assign species IDs to our hosts and to validate our F. aserva sample IDs separately for the whole genome and RADseq datasets. We merged overlapping paired-end reads and removed adaptor sequences with PEAR v0.9.1066 (Zhang et al. 2014), aligned reads to the Formica selysi reference genome with BWA-mem2 v2.2.1 (Vasimuddin et al. 2019), and called SNPs with BCFtools mpileup v1.19 (Li and Durbin 2009). For the species identification in the whole genome sequence dataset, we used BAM files of suspected F. aserva and its collected hosts alongside BAM files of known Formica species sequenced by Purcell et al. (2021) and identified by Borowiec et al. (2021). We filtered the resulting VCF file using filter set A (Table S2) in VCFtools (Danecek et al. 2011). We generated a distance matrix using PLINK (Purcell et al. 2007), excluding chromosomes 3 and 9 which contain known supergenes. Using the function njs in the R package ape, we constructed a neighbor-joining tree and identified species by assessing the proximity of our samples to known Formica species. For the RADseq dataset, we used filter set D (Supplementary Table S2), excluded individuals with more than 75% missing data, and omitted markers on chromosome 3. We converted the VCF file to PHYLIP format using the vcf2phylip.py script (https://doi.org/10.5281/zenodo.1257058) and constructed a neighbor-joining tree using IQ-TREE (Nguyen et al. 2015). Finally, we cross-referenced individuals in both the RADseq and whole genome phylogenies to verify the species identity of clades in the RADseq phylogeny.
Variant calling and filtering for F. aserva-specific analyses
The whole-genome and RADseq data were processed independently; however, the initial bioinformatics steps were identical for both datasets. In both cases, host samples were excluded (see ‘Species Identification’ section). We used the aligned BAMfiles generated in the species identification step and called SNPs with BCFtools mpileup v1.19 (Li and Durbin 2009). We applied filters to different subsets of the data depending on the analysis using VCFtools (Danecek et al. 2011). For the raw RADseq VCF file, we divided the dataset based on the batch of origin, because a significant batch effect arose from variations in library preparation protocols and differences among sequencing lanes. Details are provided in Supplementary Table S2. Details about the number of individuals and SNPs retained within each batch are available in Supplementary Table S3.
Host use
During colony sampling, we frequently noted (at least) 2 morphologically distinct species present in a single nest (Table 1). We identified host species following the protocol described in the preceding section (see ‘Species identification’).
Information about putative host species of Formica aserva, including those described in this article and those from previous publications
| Colony | Host | State, province, or region | Locality | Source |
|---|---|---|---|---|
| — | F. accreta | British Columbia, Canada | Southern Vancouver Island | Blacker (1992) |
| — | F. accreta | California, USA | Sage Hen Creek | Scheckel (2022) |
| — | F. accreta | Not specified | Not specified | Naumann et al. (1999) |
| — | F. altipetens | Not specified | Not specified | Krombein et al. (1979) |
| — | F. altipetens | Not specified | Not specified | Naumann et al. (1999) |
| — | F. argentea | California, USA | Sage Hen Creek | Scheckel (2022) |
| — | F. argentea | Nevada, USA | Not specified | Wheeler and Wheeler (1986) |
| — | F. argentea | New England, USA | Not specified | Ellison et al. (2012) |
| — | F. argentea | New Mexico, USA | Not specified | Mackay and Mackay (2002) |
| — | F. argentea and F. obtusopilosa | New Mexico, USA | Not specified | Mackay and Mackay (2002) |
| — | F. argentea, F. obtusopilosa, F. lasioides and Myrmica sp. | New Mexico, USA | Not specified | Mackay and Mackay (2002) |
| ILWC1 | F. cf. subanescens | Washington, USA | Bainbridge Island | This paper |
| FAIC1 | F. dakotensis* | Alaska, USA | Fairbanks | This paper |
| — | F. fusca ** | Nevada, USA | Not specified | Wheeler and Wheeler (1986) |
| — | F. fusca ** | New Mexico, USA | Not specified | Mackay and Mackay (2002) |
| — | F. fusca ** | North Dakota, USA | Ramsey County | Kannowski (1956) |
| — | F. fusca ** | Not specified | Not specified | Krombein (1979) |
| — | F. fusca ** | Not specified | Not specified | Naumann et al. (1999) |
| — | F. fusca ** | Quebec, Canada | Megantic | Finnegan (1973) |
| BLAC3 | F. glacialis | Alberta, Canada | Barrier Lake | This paper |
| — | F. glacialis | Maine, USA | Casco Bay region | Wheeler (1908) |
| — | F. glacialis | Ohio, USA | Not specified | Ivanov 2019 |
| JPC36 | F. marcida | California, USA | Blackrock Trail | This paper |
| JPC37 | F. marcida | California, USA | Blackrock Trail | This paper |
| — | F. microphthalma | California, USA | Sage Hen Creek | Scheckel (2022) |
| F. montana | North Dakota, USA | Ramsey County | Kannowski (1956) | |
| — | F. montana | Not specified | Not specified | Krombein (1979) |
| — | F. montana | Not specified | Not specified | Naumann et al. (1999) |
| GCRC7 | F. neoclara | Alberta, Canada | Kananaskis Trail | This paper |
| — | F. neoclara | New England, USA | Not specified | Ellison et al. 2012 |
| TRIC3 | F. neorufibarbis | Alaska, USA | Tok River | This paper |
| — | F. neorufibarbis | British Columbia, Canada | Southern Vancouver Island | Blacker (1992) |
| — | F. neorufibarbis | British Columbia, Canada | Central interior | Higgins (2010) |
| — | F. neorufibarbis | Nevada, USA | Not specified | Wheeler and Wheeler (1986) |
| — | F. neorufibarbis | New England, USA | Not specified | Ellison et al. (2012) |
| — | F. neorufibarbis | New Mexico, USA | Not specified | Mackay and Mackay (2002) |
| — | F. neorufibarbis | Not specified | Not specified | Francoeur (1983) |
| — | F. neorufibarbis | Not specified | Not specified | Francoeur (1997) |
| — | F. neorufibarbis | Not specified | Not specified | Krombein (1979) |
| — | F. neorufibarbis | Not specified | Not specified | Naumann et al. (1999) |
| — | F. neorufibarbis | Not specified | Not specified | Wilson and Brown (1955) |
| ILWC8 | F. neorufibarbis | Washington, USA | Bainbridge Island | This paper |
| ILWC7 | F. neorufibarbis and F. cf. subaenescens | Washington, USA | Bainbridge Island | This paper |
| — | F. pacifica | Washington, USA | Mount St. Helens | Sugg (1989) |
| — | F. podzolica | Alberta, Canada | Elk Island National Park | Savolainen and Deslippe (1996) |
| ELIC24 | F. podzolica | Alberta, Canada | Elk Island | This paper |
| SLLC6 | F. podzolica | Alberta, Canada | Hondo | This paper |
| — | F. podzolica | New England, USA | Not specified | Ellison et al. (2012) |
| — | F. podzolica | Not specified | Not specified | Francoeur (1997) |
| ELIC16 | F. podzolica and F. glacialis | Alberta, Canada | Elk Island | This paper |
| — | F. subanescens | California, USA | Sage Hen Creek | Scheckel (2022) |
| — | F. subanescens | North Dakota, USA | Not specified | Wheeler and Wheeler (1963) |
| — | F. subanescens | Not specified | Not specified | Francoeur (1983) |
| — | F. subanescens | Not specified | Not specified | Francoeur (1997) |
| — | F. subpolita | Not specified | Not specified | Krombein (1979) |
| — | F. subpolita | Not specified | Not specified | Naumann et al. (1999) |
| — | F. subsericea | Idaho, USA | Snake River Plain | Cole (1934) |
| — | F. subsericea | Michigan, USA | Edwin S. George Reserve in Livingston County | Talbot (1985) |
| — | F. subsericea | Michigan, USA | Not specified | Wheeler et al. (1994) |
| — | F. subsericea | North Dakota, USA | Not specified | Wheeler and Wheeler (1963) |
| — | F. subsericea | Ohio, USA | Ashtabula County | Headley (1943) |
*In Fairbanks, Alaska, we found a colony (FAIC1) containing 2 facultatively parasitic species, F. aserva and F. dakotensis. In this case, we cannot determine which species is parasitizing the other.
**Note that putative host F. fusca is now thought to be restricted to Eurasia, and previous observations from North America are ‘dubious’ (AntMaps.org).
We also systematically searched Google Scholar to compile a list of previously reported host species associated with Formica aserva. Our search criteria included the search terms ‘Formica aserva’, ‘Formica subnuda’, and ‘Formica sanguinea aserva’, both individually (114, 104, and 18 results, respectively) and in combination with the terms ‘checklist’, ‘host’, and ‘social parasite’. Next, we scanned articles retrieved through this search process to identify relevant articles (defined as articles that included any information about the association of F. aserva with heterospecific hosts). We then carefully reviewed articles, theses, and other literature meeting this criterion to retrieve published observations related to host–parasite associations.
Assessment of colony social form and polyandry rate
We used COANCESTRY v1.0.1.10 (Wang 2011) to determine pairwise relatedness and infer colony social form using the Wang estimator (Wang 2002). For this analysis, we exclusively used the RADseq data since we did not collect whole-genome data on multiple individuals per colony. Pairwise relatedness was calculated independently for each of the 4 batches. To ensure robust assignments, only colonies with a minimum of 5 workers were retained. We used filter sets J, K, L, and M for batches from 2016, 2017, 2019, and 2021, respectively (Supplementary Table S2). To ensure that these analyses were independent of our assessments of supergene variation, we excluded all markers on chromosomes 3 and 9, which are known to contain supergenes in one or more Formica species (Purcell et al. 2014, Scarparo et al. 2023). A recent study (Attard et al. 2018) showed that SNP-based datasets provide more precise but lower relatedness estimates compared to microsatellite-based datasets with fewer loci. Given the known biases in datasets like ours, we defined colonies with all pairwise relatedness estimates ≥ 0.5 as monogyne monandrous, colonies with bimodal distribution of pairwise relationships with at least 40% ≥ 0.5, but none ≤ 0.10 as monogyne polyandrous, and colonies with at least one pairwise relationship ≤ 0.1 as polygyne. For colonies displaying a clear bimodal distribution of pairwise relatedness relationships, we fine-tuned the cut-off threshold between half-siblings and siblings. This adjustment was driven by the relatedness distance between sibling groups evident when within-colony relationships were graphically visualized using a violin plot, generated in R (R Core Team 2019) with the ggplot function (ggplot2 package, Wickham 2009; Figure 1). In particular, in 3 colonies, CLAC13, STPC2, and SWEC7, we opted to lower the threshold that separates full and half-siblings to 0.48.
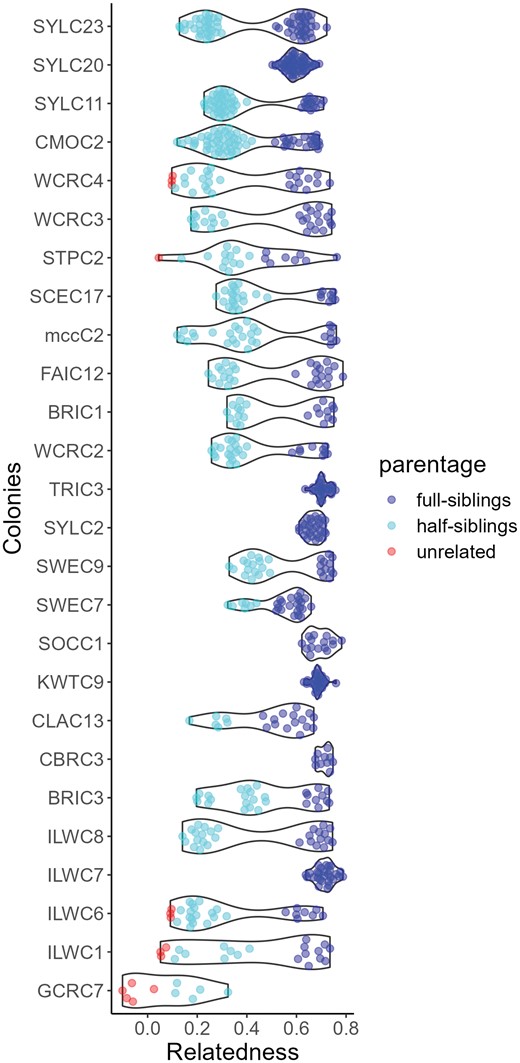
Violin plots show pairwise relatedness among nestmates within each F. aserva colony, inferred from RADseq data on 5 to 12 workers per colony. In monogyne, monandrous colonies, all workers are full siblings (minimum r ≥ 0.5). In monogyne, polyandrous colonies, all workers should be either full or half siblings (0.1 ≤ r ≤ 0.5). We note that oligogyne colonies, those with 2 closely related queens, would have a similar relatedness profile. Polygyne colonies headed by unrelated queens are expected to have unrelated nestmates (r < 0.10). Pairwise relatedness measures calculated using RADseq data have a known downward bias.
For colonies inferred as monogyne polyandrous, we assessed the minimum number of matings by investigating the number of groups of full siblings in each colony. Specifically, we took all of the full sibling-level pairwise relationships in the colony and manually constructed networks of full siblings. We then counted the number of networks in the colony, which is the minimum number of matings for that colony’s queen. We note that polygyne colonies headed by a small number of related queens could exhibit similar nestmate relatedness distributions compared to monogyne polyandrous colonies.
Given this possible source of ambiguity and to ensure that our assessments of colony social form and polyandry rates were as accurate as possible, we ran COLONY 2.0.7.1 (Jones and Wang 2010) using the same datasets and compared our results with those derived from the pairwise relatedness estimates generated by COANCESTRY.
Identifying supergene variation
To explore the structure of the social supergene, we first performed 2 principal component analyses (PCA) for each generated VCF file, one focusing exclusively on genetic markers located on chromosome 3, which harbors the social supergene in Formica, and another using markers on all chromosomes except 3 and 9. We used filter set B for the whole genome dataset and filter sets E, F, G, H, and I for the RADseq batches from 2016, 2017, 2019, 2021, and 2022, respectively (Supplementary Table S2). Subsequently, we assigned genotypes to each individual based on the clusters identified in PCA. For the whole-genome sequence dataset, we used FIS values to distinguish MP heterozygous individuals (with low, usually negative FIS values across the supergene) from MM homozygous individuals (with higher, usually positive values). Similarly, for each RADseq batch, we assigned supergene genotypes to each individual based on PCA clusters observed using only markers on chromosome 3 and used FIS values to identify heterozygous individuals and homozygous individuals. We cross-validated the RADseq genotypes with whole-genome sequence genotypes for the 7 individuals present in both datasets and found 100% congruence. The PCAs were conducted using PLINK v1.90b6.25 (Purcell et al. 2007) with the --pca flag, while FIS was calculated in VCFtools (Danecek et al. 2011), utilizing the --het flag. For a more in-depth exploration of genetic differentiation between haplotypes based on whole-genome sequence data, we computed Weir and Cockerham’s (1984) weighted FST values between MM and MP individuals in non-overlapping 20 kbp windows in VCFtools (Danecek et al. 2011).
Population structure: nuclear genome
To evaluate the genetic structure of the F. aserva individuals, we used filter set B (Supplementary Table S2) and excluded chromosomes 3 and 9. This dataset resulted in 42 workers and 1,058,338 SNPs. We conducted a principal component analysis (PCA) in PLINK (Purcell et al. 2007) and visualized the first 3 principal components in R (R Core Team 2019). Using the same dataset, we ran ADMIXTURE v1.3.0 (Alexander et al. 2009) to infer genetic clusters in our dataset for K values from 1 to 10 and assessed K value using the cross-validation error. Since our whole-genome dataset lacked individuals from Alaska and northern Canada, we performed a second PCA using RADseq data for batch 2017 (filter set F, Supplementary Table S2), which covered a broad latitudinal gradient. For the RADseq data, chromosomes 3 and 9 were excluded, resulting in a dataset comprising 80 individuals and 2,618 SNPs (Supplementary Table S3). The PCA was computed in PLINK (Purcell et al. 2007) and visualized in R (R Core Team 2019). Using the whole genome sequencing dataset, we calculated pairwise Weir and Cockerham’s weighted FST (Weir and Cockerham 1984) between inferred clusters. For this analysis, membership within cluster was restricted to individuals having at least 80% inferred ancestry for a given cluster.
Population structure: mitochondrial genome
To evaluate geographic structure in the maternally inherited mitochondrial genome, we ran BCFtools mpileup on the mitochondrial component of the reference genome, adding as an outgroup one Formica sanguinea individual previously sequenced by Brelsford et al. (2020). We specified a haploid variant calling model, applied filter set C (Supplementary Table S2), and removed individuals with more than 20% missing data. This resulted in a data matrix with 208 SNPs and 34 individuals (Supplementary Table S3). We then generated a maximum-likelihood tree in IQ-TREE v2.2.2.6 (Nguyen et al. 2015), with the TIM3 + F + ASC model selected by the ModelFinder component of the pipeline (Kalyaanamoorthy et al. 2017).
Results
Host use
Out of 43 F. aserva colonies sampled for this study, we collected 12 mixed colonies (containing both hosts and social parasites). We note that we did not excavate nests, and therefore the actual rate of parasitism in this species may be higher. In the observed mixed colonies, we found that this dulotic species kidnaps workers from 7 Formica species across its range (Table 1). One species, F. marcida, is documented as a F. aserva host for the first time. A second species, F. dakotensis, is also found in association with F. aserva for the first time, but both species are facultative social parasites, so we do not yet know the nature of the interaction in the mixed colony. Notably, 2 F. aserva colonies each contained 2 different host species. In addition to our field collections, we systematically examined the current literature and compiled a comprehensive list of host species observed in association with F. aserva. Our results, combined with observations from previous publications, demonstrate that F. aserva exploits a minimum of 20 host species (Table 1).
Colony social form and polyandry rate assessment
Formica aserva is socially polymorphic, with both single-queen and multiple-queen colonies in our dataset. However, single-queen colonies are far more common than multiple-queen colonies, with 21/26 colonies having just one queen (Table 2). Interestingly, even in polygyne colonies, we observed elevated frequencies of full and half-siblings (Figure 1) relative to other Formica species (Scarparo et al. 2023), indicating a relatively low effective queen number within these colonies. Within monogyne colonies, polyandry was relatively common, with 66.6% of queens inferred to have mated with at least 2 males (in 8 colonies, queens mated with at least 3 males). A summary of social form, polyandry rate, and average relatedness for each colony is provided in Table 2. Parentage reconstruction by COLONY confirmed our assessments of colony social form and polyandry rate for 24 out of 26 colonies. Two colonies (ILWC6 and STPC2), inferred to be polygyne through COANCESTRY, were identified as monogyne polyandrous by COLONY. We note that polyandry and oligogyny (the presence of 2 closely related queens) are difficult to distinguish through assessment of relatedness, so some ‘monogyne polyandrous’ colonies may, in fact, be oligogyne.
Samples included in RADseq analysis, with 5 to 12 workers per colony
| Locality | Colony | Batch | Average Rel | Inferred colony social form | Inferred no. matings | No. workers analyzed | Supergene genotypes on Chr 3 |
|---|---|---|---|---|---|---|---|
| Willow Creek Rd, British Columbia, Canada | WCRC2 | 2017 | 0.44 | Monogyne polyandrous | 3 | 8 | MM |
| Willow Creek Rd, British Columbia, Canada | WCRC3 | 2019 | 0.49 | Monogyne polyandrous | 2 | 8 | MM |
| Willow Creek Rd, British Columbia, Canada | WCRC4 | 2019 | 0.37 | Polygyne | - | 8 | MM |
| Castle Mountain, Alberta, Canada | CMOC2 | 2021 | 0.40 | Monogyne polyandrous | 3 | 12 | MM |
| Ibex Valley, Yukon, Canada | KWTC9 | 2017 | 0.69 | Monogyne monoandrous | 1 | 8 | MM |
| Kananaskis Trail, Alberta, Canada | GCRC7 | 2016 | 0.07 | Polygyne | — | 5 | MP |
| Sylvan Lake, Alberta, Canada | SYLC11 | 2021 | 0.40 | Monogyne polyandrous | 3 | 11 | MM |
| Sylvan Lake, Alberta, Canada | SYLC2 | 2017 | 0.67 | Monogyne monoandrous | 1 | 8 | MM |
| Sylvan Lake, Alberta, Canada | SYLC20 | 2021 | 0.60 | Monogyne monoandrous | 1 | 11 | MM |
| Sylvan Lake, Alberta, Canada | SYLC23 | 2021 | 0.43 | Monogyne polyandrous | 2 | 12 | MM |
| Bainbridge Island, Washington, USA | ILWC1 | 2016 | 0.43 | Polygyne | — | 7 | MM |
| Bainbridge Island, Washington, USA | ILWC6 | 2016 | 0.31 | Polygyne* | - | 8 | MM |
| Bainbridge Island, Washington, USA | ILWC7 | 2016 | 0.71 | Monogyne monoandrous | 1 | 8 | MM |
| Bainbridge Island, Washington, USA | ILWC8 | 2016 | 0.44 | Monogyne polyandrous | 2 | 8 | MM |
| Beckler Ridge, Washington, USA | BRIC1 | 2019 | 0.53 | Monogyne polyandrous | 3 | 7 | MM |
| Beckler Ridge, Washington, USA | BRIC3 | 2017 | 0.47 | Monogyne polyandrous | 4 | 8 | MM |
| Cedar Breaks, Utah, USA | CBRC3 | 2017 | 0.71 | Monogyne monoandrous | 1 | 5 | MP |
| Coldfoot, Alaska, USA | MCCC2 | 2019 | 0.42 | Monogyne polyandrous | 5 | 8 | MM |
| Coldfoot, Alaska, USA | SOCC1 | 2017 | 0.69 | Monogyne monoandrous | 1 | 6 | MM |
| Crater Lake, Oregon, USA | CLAC13 | 2017 | 0.49 | Monogyne polyandrous | 2 | 7 | MM |
| Fairbanks, Alaska, USA | FAIC12 | 2019 | 0.52 | Monogyne polyandrous | 3 | 8 | MM |
| Lowell Hill Rd, California, USA | SWEC7 | 2017 | 0.54 | Monogyne polyandrous | 2 | 8 | MM |
| Lowell Hill Rd, California, USA | SWEC9 | 2017 | 0.55 | Monogyne polyandrous | 2 | 8 | MM |
| Scenic, Washington, USA | SCEC17 | 2019 | 0.46 | Monogyne polyandrous | 3 | 8 | MM |
| Stevens Pass, Washington, USA | STPC2 | 2019 | 0.40 | Polygyne * | — | 7 | MM + MP |
| Tok River, Alaska, USA | TRIC3 | 2017 | 0.71 | Monogyne monoandrous | 1 | 8 | MM |
Colony samples were sequenced in 4 different batches, and batches were analyzed separately to avoid a strong batch effect. We inferred the number of queens and number of mates (‘inferred colony social form’) based on the distribution of pairwise worker relatedness within each colony (see Figure 1). We generated PCAs for markers on chromosome 3 and calculated heterozygosity (FIS) in this region to determine the supergene genotype of each individual.
*Colonies ILWC6 and STPC2, initially identified as polygyne through COANCESTRY analysis, are inferred to be monogyne polyandrous based on parentage reconstruction by COLONY, and the queens in these colonies are determined to have mated with 3 males.
Supergene variation
At the social supergene on chromosome 3, we detected 2 alternative haplotypes (M and P; Figure 2). In our RADseq data, the P haplotype is rare and found only in 2 polygyne colonies, one monogyne colony (Table 2), and 7 samples collected from transects (Supplementary Table S1), while all the other individuals and colonies for which we were able to infer colony social form harbored exclusively the M haplotype. In our whole genome dataset, heterozygous individuals were more common with 13 out of 42 individuals having one copy of the P supergene haplotype (Supplementary Table S1).
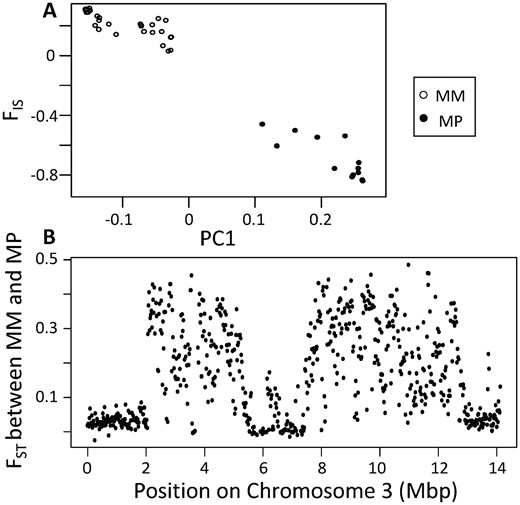
A principal component analysis of whole-genome sequencing markers in the 2 to 12.5 Mbp region of chromosome 3 reveals 2 genotypes along PC1(A). We conclude that the cluster on the left contains MM homozygotes based on FIS values at or above zero in the focal region, while the cluster on the right contains MP heterozygotes based on strongly negative FIS values. A plot of FST along chromosome 3 (B) reveals that the MM and MP individuals exhibit a high degree of differentiation throughout the supergene region previously detected in other Formica species, although we note the reduced FST in the 5.8 to 7.5 Mbp region of chromosome 3.
Population structure
The F. aserva population exhibits substantial population structure across its broad geographic range (Figure 3A). A PCA of the whole-genome sequencing dataset (Figure 3C) reveals clear geographic structure, with PC1 distinguishing populations within and outside of California, PC2 distinguishing populations east and west of the Rocky Mountains, and PC3 (Supplementary Figure S1) distinguishing populations in Nevada, Utah, and Colorado from those in Oregon and Washington. A PCA of the 2017 RADseq batch (Figure 3B) shows that samples from northern British Columbia, Yukon Territory, and Alaska cluster with samples from the Pacific Northwest and the Rocky Mountains. An ADMIXTURE analysis aligns with the results of the PCAs of whole genome and RADseq datasets (Supplementary Figure S2). ADMIXTURE’s cross-validation criterion suggests that K = 2 has the best support, separating California samples from all others, but we report K = 4 to illustrate the additional population structure detected outside of California. Pairwise FST values between each of the 4 inferred populations are shown in Table 3. In contrast, our assessment of population structure derived from the mitochondrial genome reveals a different pattern, with individuals from western states (California, Oregon, Washington, and Nevada) forming one clade and those from the rest of the range forming a second clade (Figure 3A, Supplementary Figure S3).
Pairwise Weir and Cockerham’s weighted FST between populations
| Population 1 | Population 2 | FST |
|---|---|---|
| California (purple) | East (blue) | 0.23 |
| California (purple) | Southern Rockies (orange) | 0.22 |
| California (purple) | Northwest (yellow) | 0.18 |
| East (blue) | Southern Rockies (orange) | 0.08 |
| East (blue) | Northwest (yellow) | 0.10 |
| Southern Rockies (orange) | Northwest (yellow) | 0.09 |
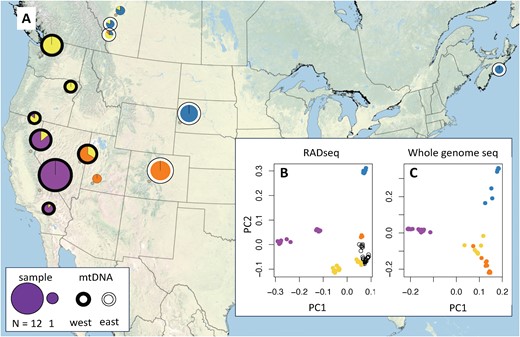
An assessment of F. aserva population structure based on whole-genome sequencing (N = 42 individuals) reveals the most substantial differentiation between samples from California (purple) and those from the rest of the range (panel A map, showing inferred ancestry from Admixture with K = 4). Principal component analyses of RADseq data (2017 batch, B) and whole-genome sequencing data (C) similarly distinguish samples from California from those collected across the rest of the range. Samples from east of the Rocky Mountains (blue) form a second cluster (along PC2), while samples from the Pacific Northwest (yellow) separate samples from the southern Rocky Mountains (orange) along PC3 (see Supplementary Figure S1). Samples collected from northern British Columbia, Yukon Territory, and Alaska (B, open black circles, not visible on map) cluster with the Pacific Northwest population. Population structure inferred from the mitochondrial genome differs markedly from that inferred from the nuclear genome, with western (black outline) and eastern (white outline) clades (A).
Discussion
Despite the broad geographic distribution and local abundance of Formica aserva, research on the natural history of this facultative social parasite remains limited. Previous studies have primarily focused on individual colonies or single populations (Savolainen and Deslippe 1996, Scheckel 2022). Here, we provide a large-scale study covering a broad latitudinal range in North America to investigate F. aserva’s host use, colony structure, and population genetics.
Host use
Kidnapper ants exhibit highly sophisticated behavioral, morphological, and genetic adaptations that enable them to conduct raids into neighboring host colonies (Stoldt and Foitzik 2021). Our findings reveal a remarkable diversity of host species in F. aserva. Notably, we observed that 12 out of the 43 investigated colonies were mixed (containing both host and parasite), showing the association of F. aserva with 7 different Formica host species. Adding our results to previously reported observations of F. aserva-host associations (Table 1), it is clear that F. aserva parasitizes at least 19 different Formica host species. MacKay and MacKay (2002) also reported one observation of a Myrmica host. While recognizing that there are many published records of F. aserva with different host species, our work represents an effort to compile the first comprehensive list of observed hosts for this facultative kidnapper. To our knowledge, the use of at least 20 different host species has never been observed for any ant social parasite. However, it’s important to acknowledge the possibility that records indicating F. aserva associations with F. fusca are erroneous. Copious observations of F. fusca across North America are now considered ‘dubious’ (antmaps.org) and likely reflect other Formica species with similar morphology; F. fusca is now thought to be restricted to Eurasia. We also reiterate that the observed parasitism rate should be interpreted with caution, and that systematic sampling is needed to accurately assess the rate of parasitism.
Observations on other dulotic ants suggest that the host selection by young queens during colony foundation, as well as the orientation of raids conducted by workers, is strongly influenced by the odor of the host present in the maternal nest (d’Ettorre and Heinze 2001). Therefore, this imprinting process, observed in several Polyergus and Chalepoxenus species (Goodloe and Sanwald 1985, Goodloe et al. 1987, Mori et al. 1994, Schumann and Buschinger 1994, 1995), likely leads to long-term host specialization, at least at a local scale, similar to the imprinting-induced host race formation observed in some brood-parasitic birds (Sorenson et al. 2003). However, our findings reveal instances where single F. aserva colonies contained multiple host species, in line with a notable finding in New Mexico where an F. aserva colony contained 4 host species (Mackay and Mackay 2002). These occurrences, and parallel observations in Harpagoxenus sublaevis, Temnothorax ravouxi, and Temnothorax americanus (Heinze et al. 1994, Stoldt and Foitzik 2021), suggest that kidnappers including F. aserva can display a high degree of generalization not only at a range-wide scale but also locally. The odor of the maternal host colony is not likely to affect host choice in the next generation of parasites. This idea is further supported by an analysis of the chemical profile of F. aserva and 3 Formica hosts showing that F. aserva does not mimic host odors but, instead, kidnapped workers tend to acquire an odor similar to that of their kidnappers (Scheckel 2022).
The generalist pattern of host use in F. aserva might be influenced by its facultative parasitic nature. Unlike obligate kidnappers, facultative dulotic parasites retain the morphological and behavioral traits of non-parasitic species (Wcislo 1989), and they can function effectively even without hosts. For instance, studies have shown that workers of the sister species, F. sanguinea, which is also a facultative kidnapper, can efficiently carry out the usual tasks of free-living worker species in the absence of a host (Mori and Le Moli 1988). Conversely, the obligate kidnapper Polyergus rufescens relies entirely on kidnapped hosts for colony sustenance (Mori and Le Moli 1988). Direct observations of F. aserva colony composition indicate that most colonies do not contain hosts (Wheeler 1909, Savolainen and Deslippe 1996), and in cases where host workers are present, their proportion is low (Savolainen and Deslippe 1996), confirming that F. aserva can thrive autonomously or with hosts present. Additionally, F. aserva has retained morphological traits typical of free-living species, such as a small Dufour’s gland (Savolainen and Deslippe 1996) (an abdominal gland that secretes ‘propaganda substances’ employed by many dulotic species to disorient and usurp the host during raids [Regnier and Wilson 1971]). Therefore, physical aggression seems to be the primary mechanism of obtaining pupae from raids on potential host colonies.
Colony social structure and polyandry rates
Monogyny is common in dulotic ants (d’Ettorre and Heinze 2001, Foitzik and Herbers 2001), and our findings align with this overall trend. While we identified 5 polygyne colonies, this social structure is relatively uncommon in F. aserva, as 21 out of 26 colonies displayed monogyny (Table 2). Notably, there was an elevated occurrence of full and half-siblings even in inferred polygyne colonies, implying a low effective queen number within the colony or that nestmate queens are related to each other. In general, the elevated genetic relatedness observed among nestmates in polygyne colonies leads to some uncertainty in distinguishing between polygyne colonies with a low effective queen number, oligogyne colonies, and monogyne polyandrous colonies.
In many Formica species, the number of queens in a colony is regulated by a social supergene on chromosome 3. The polygyne-associated haplotype, referred to as the P haplotype, is typically exclusive to polygyne colonies (Purcell et al. 2014, Brelsford et al. 2020, McGuire et al. 2022, Pierce et al. 2022, Scarparo et al. 2023). In our RADseq data, all but 3 colonies (2 polygyne and 1 monogyne), exclusively harbor the monogyne-associated haplotype, or M haplotype (Table 2). Overall, the P haplotype is present in about 7% of the individuals in the RADseq dataset, while 31% of individuals in our whole-genome sample are MP heterozygotes. Polygyne or oligogyne colonies without the P haplotype were documented but rare in the non-parasitic species F. cinerea (Scarparo et al. 2023) and F. selysi (Purcell et al. 2014). In such instances, monogyne colonies in decline may be more receptive to accepting a new, likely related queen if their current queen stops producing sufficient eggs (Al-Lawati and Bienefeld 2009, Scarparo et al. 2023). Queen turnover has been detected in several non-parasitic species (Evans 1996, Pedersen and Boomsma 1999, Bargum et al. 2007, Purcell and Chapuisat 2013) and the dulotic Temnothorax americanus (Foitzik and Herbers 2001). Overall, our limited sample size precludes us from drawing conclusions about the strength of the association between the social supergene and colony queen number in F. aserva. However, we can conclude that PP homozygotes for the supergene are absent in F. aserva, and that the supergene region spans most of chromosome 3, as found in other social parasites and free-living species (Brelsford et al. 2020).
In contrast to our findings on colony social structure, an earlier study investigating relatedness between nestmates in F. aserva colonies noted high polygyny rates in a population located in central Alberta, western Canada (Savolainen and Seppä 1996). However, the authors explicitly acknowledged limitations in their methodology, which hindered a clear distinction between polygyny and relatively high mating frequencies of queens (Savolainen and Seppä 1996). Our analysis suggests that the average relatedness values identified in the Canadian population, lower than the expected 0.75 of monogyne monandrous colonies, might instead be affected by elevated polyandry. Indeed, our dataset suggests that 66.6% of queens within monogyne colonies were mated with at least 2 males, and 57% of polyandrous queens were mated with at least 3 males (Table 2). Such elevated polyandry rates are generally uncommon in ants (Boomsma et al. 2009) and pose some risks at the individual and colony levels. These risks (reviewed by Kraus and Moritz 2010; Baer 2016) include increased vulnerability of queens to predation during mating flights and reduced intracolony relatedness among workers, which could trigger conflicts between nestmates belonging to different patrilines. However, despite these risks, numerous suggested or empirically tested benefits are associated with multiple mating (reviewed by Crozier and Fjerdingstad 2001, Kraus and Moritz 2010, Baer 2016), such as higher sperm count in the spermatheca of the queens and greater genetic diversity within the colony, which can potentially reduce parasitism, pathogen spread, and improve task performance of workers. Our results are similar to observations in F. sanguinea, where, on average, queens from monogyne colonies were estimated to mate with 2.61 males (Haapaniemi and Pamilo 2012).
Population structure
The strongest population structure within F. aserva separates individuals from the Sierra Nevada in California from the rest of the species range. Individuals with intermediate ancestry from northern California suggest that there is at least occasional gene flow between the northwestern and California populations (Figure 3A, Figure S2). The California-Oregon border region has been identified as a suture zone for many other taxa with a broad geographic range in western North America (Swenson and Howard 2005). Ants collected east and west of the Rocky Mountains, another commonly observed phylogeographic break (Swenson and Howard 2005), are also strongly differentiated. Two samples collected along the Kananaskis Trail in Alberta suggest a narrow contact zone with gene flow between eastern and northwestern populations. One sample collected at the edge of the Rocky Mountains at Barrier Lake had mostly eastern ancestry, while a second sample collected 30 km into the mountains at Grizzly Creek had mostly northwestern ancestry (Figure 3A). Future studies should investigate the contact zones between these populations more carefully to determine the extent of interbreeding and introgression between distinct populations of F. aserva.
We also identified discordance between population structures derived from nuclear and mitochondrial genomic datasets (Figure 3A, Figure S3), with one mitochondrial clade found in western states and the other found in and east of the Rocky Mountains. Discordance between the maternally inherited mitochondria and the nuclear genome could point to several contemporary or past dynamics (Toews and Brelsford 2012). Given the geographic extent of the discordance, one plausible scenario involves selection favoring adaptive introgression of the California mitochondrial haplotype into the Pacific Northwest genetic background. Alternatively, genetic drift driven by the smaller effective population size and the lack of recombination of the mitochondrial genome could cause widespread mito-nuclear discordance, particularly in the context of expansion from glacial refugia (Excoffier et al. 2009). Finally, sex-biased dispersal may also have contributed to the observed discordance.
Conclusions
This study shows that F. aserva exploits 20 host species, primarily congeneric. Relatedness analyses also suggest that the colony structure of these facultative kidnappers is primarily monogyne, with queens typically mating with at least 2 males.
Furthermore, the analysis of population structure reveals distinct patterns, indicating regional differentiation with gene flow between populations. Notably, the discordance between mitochondrial and nuclear population structures raises intriguing questions about the evolutionary dynamics shaping F. aserva. Our results contribute to a deeper understanding of the ecology and evolution of F. aserva, underscoring the need for further research to unravel the intricate relationships between this facultative kidnapper and its diverse host species.
Supplementary data
Supplementary data are available at Annals of the Entomological Society of America online.
Acknowledgments
The authors thank the many people who contributed to sample collection, DNA extraction, library preparation, and data processing for this project, including Zul Alam, German Lagunas-Robles, Marco Molfini, Aracely Ospina, Daniel Pierce, Rachel Zeng, Junxia Zhang, and members of the Brelsford Biology 118 class from fall of 2022, particularly Matt Liu and Kevin Quach. Parks Canada provided permission to conduct fieldwork in Elk Island National Park.
Funding
Research funding was provided by the US National Science Foundation (DEB grant #1942252 to J.P. and DEB grant #1754834 to A.B. and J.P.), as well as Alberta Conservation Association Grants in Biodiversity. M.W. received fellowship support from the US National Science Foundation (grant # 1631776). All computational work was carried out using the UCR HPCC, which has been funded by grants from the US National Science Foundation (MRI-2215705 and MRI-1429826) and the National Institute of Health (1S10OD016290-01A1). This manuscript includes data generated at the UC Berkeley QB3 Genomics Laboratory using the Illumina HiSeq 4000, supported by National Institute of Health S10 OD018174 Instrumentation Grant, and at the UC San Diego IGM Genomics Center using the Illumina NovaSeq 6000, purchased with funding from National Institute of Health S10 OD026929.
Author contributions
Giulia Scarparo (Conceptualization [Equal], Formal analysis [Equal], Investigation [Equal], Methodology [Equal], Visualization [Equal], Writing—original draft [Equal], Writing—review & editing [Equal]), Mari West (Methodology [Equal], Writing—review & editing [Equal]), Alan Brelsford (Conceptualization [Equal], Formal analysis [Equal], Funding acquisition [Equal], Investigation [Equal], Methodology [Equal], Visualization [Equal], Writing—original draft [Equal], Writing—review & editing [Equal]), and Jessica Purcell (Conceptualization [Equal], Funding acquisition [Equal], Investigation [Equal], Methodology [Equal], Visualization [Equal], Writing—original draft [Equal], Writing—review & editing [Equal])
Data availability
The RADseq and whole-genome sequence data reported in this manuscript are deposited on NCBI Sequence Read Archive: BioProject PRJNA1112392. Previously published genome sequence data reanalyzed for this study are available at NCBI accession numbers SRX12136619, SRX12268528, SRX12268529, and SRX12268597. All other metadata on the samples is included in the tables presented in the main text and Supplementary Materials.
References
Author notes
Alan Brelsford and Jessica Purcell contributed equally.
