


Abstract
To reduce diet-related chronic disease, policymakers have proposed requiring health warnings on sugar-sweetened beverages (SSBs). Health warnings reduced purchases of these products by 22% in our recent randomized controlled trial, but the mechanisms remain unclear.
We sought to identify the psychological mechanisms that explain why SSB health warnings affect purchase behavior.
In 2018, we recruited 400 adult SSB consumers to complete a shopping task in a naturalistic convenience store laboratory in North Carolina, USA. We randomly assigned participants to either a health warning arm (all SSBs in the store displayed a text health warning) or to a control arm (SSBs displayed a control label). Participants selected items to purchase with cash.
Compared to control labels, health warnings elicited more attention, negative affect, anticipated social interactions, and thinking about harms (range of ds = 0.63–1.34; all p < .001). Health warnings also led to higher injunctive norms about limiting SSB consumption (d = 0.27, p = .008). Except for attention, all of these constructs mediated the effect of health warnings on SSB purchases (all p < .05). In contrast, health warnings did not influence other attitudes or beliefs about SSBs or SSB consumption (e.g., healthfulness, outcome expectations, and response efficacy).
Health warnings on sugar-sweetened beverages affected purchase behavior by eliciting negative emotions, increasing anticipated social interactions, keeping SSBs’ harms at top of mind, and shifting norms about beverage consumption. Results are consistent with recent studies of why tobacco warnings influence quitting behavior, pointing toward a general framework for understanding how health warnings affect behavior.
NCT #03511937.
More than 2 billion adults worldwide have overweight or obesity [1], increasing their risk for cardiovascular disease [2], Type 2 diabetes [3], and more than 13 types of cancer [4]. Poor dietary quality is a key contributor to obesity [5, 6] and chronic disease [7–10]. Globally, consumption of unhealthy foods has risen over the last several decades [11], prompting policymakers to call for population-level strategies to improve dietary quality and reduce diet-related disease [12–15].
Requiring health warnings on unhealthy foods and beverages is emerging as a promising policy for improving dietary quality. In 2016, Chile began requiring front-of-package warnings on products that exceed recommended levels of sugar, sodium, saturated fat, or calories [16]. Similar policies have been passed or implemented in Peru, Uruguay, and Israel [17] and are under consideration in Brazil [18], Canada [19], Mexico [20], and South Africa [21]. In the USA, policymakers in five states have proposed health warnings for sugar-sweetened beverages (SSBs), such as sodas, sports drinks, sweetened teas, and fruit-flavored drinks [22–27], products that are high in calories but offer little nutritional value [28–30]. Online experiments indicate that SSB health warnings reduce intentions to purchase SSBs [31–39], and recent quasiexperiments [36] and randomized trials [40, 41] have found that warnings also reduce SSB purchases. For example, our recent randomized trial found that brief exposure to health warnings reduced SSB purchases by 22%, from 143 calories per transaction in the control arm to 110 calories per transaction in the health warning arm [41]. These studies suggest that health warnings may be a promising policy for encouraging healthier beverage purchases.
The psychological mechanisms through which SSB health warnings affect behavior remain largely unknown. While studies have not yet examined these mediators, theories from social psychology [42, 43], health behavior [44], and communication [45, 46] suggest that health warnings change how people think and feel about SSBs, which, in turn, affects their behaviors. Specifically, these theories, along with empirical work on tobacco warnings, suggest three types of candidate mediators: warning reactions, attitudes and beliefs about SSBs, and intentions.
Warning Reactions
Recent research on tobacco warnings suggests several candidate mediators, with hypotheses codified into the Tobacco Warnings Model (TWM) [47–49]. This model posits that tobacco warnings influence smoking behavior primarily by triggering cognitive and affective responses to the warnings themselves referred to as warning reactions. Specifically, tobacco warnings affect behavior first by increasing the noticing of and attention to the message. This increased processing leads to greater negative emotions and sparks conversations about the warnings. These responses prompt smokers to think about the harms of smoking, leading to increased motivation to quit smoking and finally increased quitting behavior. The TWM shares some similarities to existing models of behavior change, such as the Elaboration Likelihood Model (ELM) [45] and the Extended Parallel Process Model (EPPM) [46], but differs along key dimensions. For example, the TWM does not include a role for attitudes or risk perceptions [47], central constructs in the ELM and EPPM, respectively.
The TWM is supported by data from recent randomized trials [47–49]. Additionally, experimental studies of SSB warnings have documented that SSB warnings affect key TWM mediators, including attention [40, 41], negative emotions [37, 39, 41], and thinking about the harms of SSB consumption [36, 38, 41, 50]. However, studies have not assessed whether these constructs explain SSB warnings’ effects on behavior and whether the TWM generalizes to nutrition behaviors remains an open question. If TWM mediators also explain why beverage warnings affect behavior, this would point to the TWM being a general (not tobacco specific) model of why warnings encourage healthier behaviors.
Attitudes and Beliefs
Attitudes and beliefs are notably absent from the TWM [47, 49]. The model explicitly omits these constructs because randomized trials and meta-analyses suggest that tobacco warnings often do not change attitudes or beliefs [47–49]. Furthermore, a meta-analysis found that 39% of risk communication interventions targeting a broad range of health behaviors failed to change risk appraisals [51]. However, recent research indicates that SSB warnings can change a variety of attitudes and beliefs. Additionally, reasoned action theories of health behavior (e.g., Theory of Planned Behavior [43]) posit that attitudes and beliefs could be mechanisms through which warnings exert their influence. For example, some online experimental studies have found that SSB warnings reduce positive attitudes about SSB products [31, 36]. Similarly, several studies have found that warnings change attitudes about SSB consumption [31–34, 52–55]. Attitudes are a central determinant of behavior in reasoned action theories [43], suggesting that changing attitudes about SSBs and SSB consumption may be one mechanism through which health warnings affect beverage purchase behavior.
SSB health warnings may also reduce SSB purchases by changing beliefs about SSBs and SSB consumption. For example, two experimental studies have found that SSB warnings increase consumers’ perceptions of the amount of added sugar in SSBs [32, 33]. Additionally, in online studies, exposure to SSB health warnings increases expectations that consuming SSBs increases the risk of weight gain, diabetes, and heart disease [32, 33, 39, 52]. These negative outcome expectations may prompt consumers to reduce their SSB purchases as suggested by Social Cognitive Theory [42]. Other reasoned action theories of health behavior (e.g., Protective Motivation Theory) suggest additional beliefs that could be candidate mediators (e.g., response efficacy and self-efficacy). However, research has not yet examined whether attitudes and beliefs about SSBs and SSB consumption mediate SSB warnings’ effects on purchase behaviors.
Intentions
Both the TWM and reasoned action theories of health behavior posit that behavioral intentions are a key mechanism underlying behavior change. A growing number of randomized experiments have demonstrated that SSB health warnings significantly reduce intentions to purchase SSBs [31–37]. Studies have not yet assessed whether intentions mediate the effect of SSB health warnings on purchase behavior.
Study Objective
This study aimed to identify the psychological mechanisms that explain why SSB health warnings affect purchase behaviors, examining mediators suggested by the TWM and by reasoned action theories. Understanding these mechanisms could help policymakers design more effective warnings by indicating which mediators are crucial to target. Identifying these mechanisms can also inform health communication theory by providing a deeper understanding of why health warnings change behavior.
Methods
Participants
We used data from a randomized controlled trial with adult SSB consumers. Details of the trial have been described previously [41]. Briefly, from May to September 2018, we recruited and enrolled 400 participants using Craigslist, Facebook, email lists, university participant pools, in-person recruitment, and flyers. Participants were English-speaking adults (age 18 or older) who consumed at least 12 ounces per week of SSBs as assessed using an adapted version of the BEVQ-15 questionnaire (see Table 1 for participant characteristics). The University of North Carolina Institutional Review Board approved all study procedures.
Participant characteristics by trial arm
| Characteristic | Control arm n = 200 | Health warning arm n = 200 | ||
|---|---|---|---|---|
| n | % | n | % | |
| Age | ||||
| 18–29 years | 125 | 63 | 132 | 66 |
| 30–39 years | 47 | 24 | 41 | 21 |
| 40–54 years | 22 | 11 | 19 | 10 |
| 55+ years | 6 | 3 | 8 | 4 |
| Mean (SD) | 29.0 | 10.3 | 29.0 | 10.5 |
| Gender | ||||
| Male | 83 | 42 | 76 | 38 |
| Female | 115 | 58 | 121 | 61 |
| Transgender or other | 2 | 1 | 3 | 2 |
| Gay, lesbian, or bisexual | 21 | 11 | 20 | 10 |
| Hispanic | 25 | 13 | 9 | 5 |
| Race | ||||
| White | 87 | 44 | 93 | 47 |
| Black or African American | 46 | 23 | 43 | 22 |
| Asian | 47 | 24 | 51 | 26 |
| Other/multiraciala | 17 | 9 | 12 | 6 |
| Low education (some college or less)b | 47 | 24 | 47 | 24 |
| Limited health literacyc | 40 | 20 | 34 | 17 |
| Household income, annual | ||||
| $0–$24,999 | 47 | 24 | 49 | 25 |
| $25,000–$49,999 | 61 | 31 | 54 | 27 |
| $50,000–$74,999 | 22 | 11 | 34 | 17 |
| $75,000+ | 69 | 35 | 63 | 32 |
| Sugar-sweetened beverage consumption | ||||
| Low (≤60 oz/weekd) | 103 | 52 | 100 | 50 |
| High (>60 oz/weekd) | 97 | 49 | 100 | 50 |
| Overweight (BMI ≥ 25 kg/m2) | 93 | 47 | 72 | 36 |
Missing demographic data ranged from 0% to 1%. In the 11 balance tests conducted, 2 statistically significant differences between the health warning and control arm were observed: proportion Hispanic (p = .004) and proportion overweight (p = .03).
BMI, body mass index; SD, standard deviation.
aIncludes participants who marked “other race,” American Indian/Native American, Native Hawaiian, or Pacific Islander, or who marked multiple races.
bEducational attainment for participants ≤25 years (who may still be completing degrees) was assessed using mother’s or father’s educational attainment, whichever was higher.
c“Possibility” or “high likelihood” of limited health literacy based on the score on the Newest Vital Sign questionnaire [86].
dSample median.
Setting
The study took place in a naturalistic convenience store laboratory in Durham, NC, USA. The store sold foods, beverages, and household products at real-world prices, providing an immersive experience that simulated a real shopping trip [56, 57].
Procedures
Participants made one study visit to the trial store. Upon arriving, all participants provided written informed consent. We then randomly assigned participants in a 1:1 allocation ratio to either a health warning arm (all SSBs in the store displayed a health warning label, developed based on a previous study [36]; Fig. 1) or to a control arm (all SSBs in the store displayed a control label; Fig. 1).
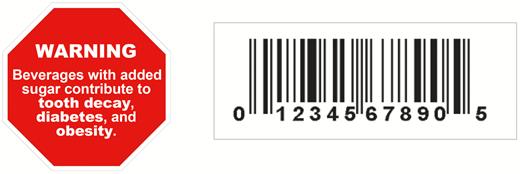
Health warning label (left) and control label (right) used in the randomized trial.
Participants received $10 in cash and completed a shopping task. We asked participants to shop as they usually would and to choose six items: two household products, two foods, and two beverages. We asked participants to place their choices in a shopping basket and said that we would randomly select one of these products for the participants to purchase with their $10. This helped ensure that all six items participants chose were items they wanted to buy. Research staff left the store while participants completed the shopping task. After completing the shopping task and paying for their randomly selected item, participants completed a questionnaire on a computer in a private room and, then, were debriefed about the purpose of the study. The trial’s procedures and outcomes were registered prior to data collection (ClinicalTrials.gov NCT #03511937).
Measures
The primary trial outcome was SSB calories purchased. We operationalized SSB calories purchased as the total number of calories from SSBs in participants’ baskets when they completed the shopping task, reflecting that all items they selected should be ones they wished to purchase given the design of the shopping task.
Surveys assessed potential psychological mediators using measures that have been validated or used in previous studies (Supplementary Exhibit 1). To guide the selection of potential mediators, we used previous research on tobacco and SSB health warnings [31–33, 47–49]. We examined three categories of potential mediators. First, we assessed five warning reactions: attention, thinking about harms, negative affect, anticipated social interactions, and reactance. Because warning reaction items queried participants’ responses to the trial labels (e.g., “How much did the labels on the beverages make you feel anxious?”), these items were only shown to participants who indicated they had noticed their trial label (n = 215, 54%), meaning responses reflected participants’ reactions to an actual SSB health warning in a naturalistic retail environment. Second, we assessed seven attitudes and beliefs: perceptions of added sugar, positive product attitudes (appeal and coolness), positive behavioral attitudes (healthfulness of consuming SSBs), negative outcome expectations, self-efficacy, response efficacy, and injunctive norms. Questions about added sugar, product attitudes, and behavioral attitudes asked participants about specific types of SSBs sold in the trial store (e.g., sodas and sports drinks) and questions about outcome expectations, efficacy, and norms asked about “beverages with added sugar,” following the language used in previous studies (see Supplementary Exhibit 1). Third, we assessed intentions to limit consumption of the specific types of SSBs sold in the store and intentions to limit the consumption of beverages with added sugar. The multi-item scales were generally reliable, with Cronbach’s alpha or Spearman’s rho .70 or greater, except for an alpha of .57 for perceptions of added sugar (Supplementary Exhibit 1).
Statistical Analysis
First, we compared trial arms on each potential mediator using t-tests. We characterized associations using Cohen’s d to facilitate the interpretation of the effect sizes. Next, we conducted mediation analyses to identify variables that could explain the association between exposure to SSB health warnings and SSB purchases. We followed the MacKinnon [58] approach to mediation analysis, assessing (a) the association between trial arm and the mediator (a pathway), (b) the association between the mediator and the outcome, controlling for trial arm (b pathway), and (c) the product of these associations (a × b; Fig. 2). To facilitate the interpretation of relative effect sizes, we standardized the mediators before calculating the a pathways. The size of the mediated effect is given by the product a × b; mediation exists if a × b is different from 0. We used model 4 in the PROCESS macro version 3.3 for SAS to estimate a, b, and a × b, computing bootstrapped 95% confidence intervals (CIs) using 5,000 repetitions [59].
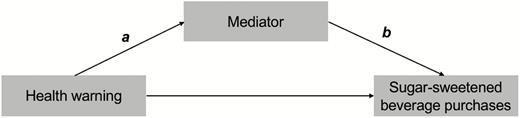
Mediation model.
In 11 balance tests conducted, two were statistically significant: participants randomly assigned to the health warning arm were less likely to be Hispanic (p = .004) and to have an overweight/obese body mass index (BMI ≥ 25 kg/m2, p = .03; Table 1). We report unadjusted differences in mediators between arms (Cohen’s ds) and adjusted regression coefficients (a and b pathways and a × b estimate) controlling for participant characteristics that differed between arms. Adjusted and unadjusted analyses yielded the same pattern of results.
Because warning reaction items were shown only to participants who reported that they noticed the trial labels (n = 215, 54%), analyses of warning reactions excluded participants who did not notice their trial label. Analyses of all other variables included all 400 participants in their assigned arm (intent-to-treat analyses). We used a critical α = .05 and two-tailed statistical tests. We completed data preparation and descriptive analyses in Stata SE version 15.1 (StataCorp LLC, College Station, TX) and mediation analyses using SAS version 9.4 (SAS Institute Inc, Cary, NC).
Results
SSB health warnings elicited stronger responses for four of the five warning reactions (all ps <.001; Fig. 3). Among warning reactions, the largest effect size was for attention (d = 1.34), followed by thinking about harms (d = 0.94). The SSB health warnings also elicited more negative affect (d = 0.63) and anticipated social interactions (d = 0.64) than control labels. Reactance did not differ between trials arms (d = −0.16, p = .33).
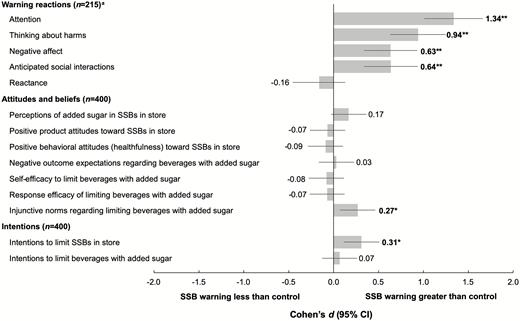
Impact of sugar-sweetened beverage (SSB) health warnings on mediators. Figure shows Cohen’s ds, calculated as the difference between the health warning and control arms divided by the average standard deviation to allow for unequal variances. Intent-to-treat analyses included all participants except where noted. Bold indicates statistical significance, p < .01. aSample size is smaller because the warning reaction items were only asked of participants who indicated they noticed the trial label. *p < .01, **p < .001.
SSB health warnings affected only one of the seven attitudes and beliefs measures. Injunctive norms regarding limiting SSB consumption were higher among participants exposed to the health warning than among those exposed to the control label (d = 0.27, p = .008). Trial arms did not differ perceptions of added sugar, positive product attitudes, positive behavioral attitudes, negative outcome expectations, self-efficacy, or response efficacy (range of ds = −0.09 to 0.17, all ps >.10).
Intentions to limit consumption of the specific categories of SSBs sold in the convenience store laboratory were higher in the health warning arm (d = 0.31, p = .002), but intentions to limit “beverages with added sugar” did not differ between trial arms (d = 0.07, p = .50). SSB purchases were about 22% lower in the health warning arm than the control arm (109.9 calories vs. 143.2 calories, p = .02), as previously reported [41].
Mediation
Three of the five warning reactions mediated the warnings’ effect on SSB calories purchased (Table 2). The largest mediated effect was for thinking about harms (a × b = −34.4, 95% CI = −55.8, −16.5), followed by anticipated social interactions (a × b = −15.5, 95% CI = −31.2, −3.5) and negative affect (a × b = −12.6, 95% CI = −26.5, −2.0). While the health warnings elicited more attention than the control labels, attention did not mediate warnings’ impact on SSB purchases (a × b = −3.2, 95% CI = −26.3, 20.0). Reactance did not suppress the effect of warnings’ on SSB purchases (a × b = 0.3, 95% CI = −5.3, 4.2).
Mediation of health warnings’ effect on sugar-sweetened beverage (SSB) purchases
| Mediator | Warnings on mediator | Mediator on purchases | Mediated effect |
|---|---|---|---|
| a (95% CI) | b (95% CI) | a × b (95% CI) | |
| Warning reactions (n = 215)a | |||
| Attention | 1.13 (0.87, 1.38) | −2.9 (−25.0, 19.3) | −3.2 (−26.3, 20.0) |
| Thinking about harms | 0.89 (0.62, 1.16) | −38.6 (−58.5, −18.6) | −34.4 (−55.8, −16.5) |
| Negative affect | 0.62 (0.33, 0.90) | −20.5 (−40.1, −0.9) | −12.6 (−26.5, −2.0) |
| Anticipated social interactions | 0.63 (0.34, 0.91) | −24.7 (−44.2, −5.3) | −15.5 (−31.2, −3.5) |
| Reactance | −0.18 (−0.48, 0.12) | −1.6 (−20.6, 17.3) | 0.3 (−5.3, 4.2) |
| Attitudes and beliefs (n = 400) | |||
| Perceptions of added sugar in SSBs in store | 0.19 (−0.004, 0.39) | −22.6 (−35.9, −9.3) | −4.4 (−10.9, 0.1) |
| Positive product attitudes toward SSBs in store | −0.08 (−0.28, 0.12) | 36.3 (23.3, 49.3) | −3.0 (−10.6, 4.0) |
| Positive behavioral attitudes (healthfulness) toward consuming SSBs in store | −0.12 (−0.31, 0.08) | 33.9 (20.9, 46.9) | −3.9 (−11.6, 2.7) |
| Negative outcome expectations regarding consuming beverages with added sugar | 0.05 (−0.15, 0.25) | −5.1 (−18.5, 8.4) | −0.3 (−2.8, 1.4) |
| Self-efficacy to limit beverages with added sugar | −0.11 (−0.31, 0.08) | −32.2 (−45.3, −19.1) | 3.7 (−2.5, 10.8) |
| Response efficacy of limiting beverages with added sugar | −0.04 (−0.24, 0.15) | 6.3 (−7.1, 19.7) | −0.3 (−2.9, 1.6) |
| Injunctive norms regarding limiting beverages with added sugar | 0.30 (0.11, 0.50) | −14.7 (−28.3, −1.2) | −4.4 (−10.4, −0.1) |
| Intentions (n = 400) | |||
| Intentions to limit SSBs in store | 0.28 (0.08, 0.48) | −14.7 (−28.2, −1.2) | −4.1 (−9.9, −0.2) |
| Intentions to limit beverages with added sugar | 0.09 (−0.11, 0.29) | −38.3 (−51.2, −25.4) | −3.3 (−11.7, 4.3) |
Table reports unstandardized regression coefficients from linear regressions controlling for Hispanic ethnicity and overweight status. The second column reports coefficients for the a pathway, regressing the mediator on treatment arm. The third column shows coefficients for the b pathway, regressing sugar-sweetened beverage purchases on the mediator, controlling for treatment arm. The final column shows mediated effects (a × b). Mediators were standardized prior to conducting regression analysis, so that a pathways can be interpreted as the difference between trial arms in standard deviations of the mediator. Intent-to-treat analyses included all participants except where noted. Bold indicates statistical significance, p < 0.05.
aWarning reaction items only asked of participants who indicated that they noticed the trial label (n = 215).
Only one of the seven attitudes and beliefs, injunctive norms, was a mediator, showing a small indirect effect (a × b = −4.4, 95% CI = −10.4, −0.1). Intentions to limit consumption of the specific SSBs sold in the trial store also mediated warnings’ effects on SSB calories purchased (a × b = −4.1, 95% CI = −9.9, −0.2). Intention to limit the consumption of beverages with added sugar was not a mediator (a × b = −3.3, 95% CI = −11.7, 4.3). Results were similar when examining attitudes and beliefs among only the subset of participants who noticed the trial labels (Supplementary Table 1).
Discussion
Emerging evidence suggests that food and beverage warnings can reduce purchase intentions [31–39, 60–62] and actual purchases [40, 41] of labeled products, but how they do so is not yet well understood. Our trial suggests that health warnings reduce SSB purchases primarily by eliciting negative emotions, keeping the health harms of SSBs at top of mind, and prompting consumers to anticipate talking to others about the warnings. The SSB warnings also exerted some influence on purchases through strengthening norms against SSB consumption but exerted little influence through changes in other attitudes and beliefs.
SSB health warnings increased four of the five warning reactions studied: compared to the control label, the warnings elicited more attention, thinking about harms, negative affect, and anticipated social interactions. The health warnings did not elicit more reactance than the control label, similar to a recent study of text-only chemical messages on cigarettes [63]. Three of these warning reactions also explained how SSB warnings exerted their effects—negative affect, thinking about harms, and anticipated social interactions were each a mediator of the warnings’ impact on SSB purchases. While attention was higher in the health warning arm, attention was not a mediator, as has been observed in other trials of text warnings [63]. These findings extend an online experimental study conducted by Donnelly et al., who found that graphic SSB warnings influence hypothetical purchase intentions through affect and thinking about harms [36]. Our results suggest that warning reactions are important mechanisms explaining why SSB warnings affect actual beverage purchase behavior in a naturalistic environment.
We found few differences between trial arms in attitudes and beliefs. Participants in the health warning did not perceive SSBs to have more added sugar or to be less appealing and cool. Likewise, the health warnings did not lead to lower perceptions of the healthfulness of SSB consumption or more negative outcome expectations regarding SSB consumption nor did warnings change self-efficacy or response efficacy about SSB consumption. These findings are in contrast to some earlier online experimental studies that have generally found that exposure to SSB warnings changes a variety of SSB attitudes and beliefs in the expected directions [31–34, 39, 52, 54, 55]. It may be that warnings are more likely to change these outcomes when viewed on a computer screen than when seen in a retail environment while shopping. We also found that most attitudes and beliefs were not mediators of warnings’ impact on beverage purchases, consistent with trials of pictorial cigarette warnings and cigarette chemical messages [47, 49, 63]. Together, these results suggest that attitudes and beliefs, while central to many theories of health behavior [42, 43, 64], may not be the primary mechanisms through which health warnings affect behaviors, including both beverage purchase behavior and cigarette smoking.
Of the seven attitudes and beliefs measured, only injunctive norms differed between trial arms: compared to the control arm, participants in the health warning arm had stronger beliefs that others would approve of them limiting their SSB consumption. This result is consistent with qualitative research suggesting that Chile's food and beverage warnings may shift norms about dietary behaviors [65]. One possible explanation for our result is that the SSB health warnings provided a cue signaling the unacceptability of purchasing SSBs, leading participants to strengthen their norms about limiting SSB consumption [66, 67]. Stronger injunctive norms were associated with lower SSB purchases, consistent with prior studies assessing the relationship between injunctive norms and SSB consumption [68–70]. Injunctive norms were also the only attitude or belief to mediate the impact of warnings on SSB purchases. This finding suggests that warnings and other public health messages discouraging SSB consumption should target injunctive norms, for example, by communicating that socially significant referent groups (e.g., peers and physicians) disapprove of SSB consumption [67].
The TWM suggests that tobacco warnings affect quitting behavior via five key mechanisms: by eliciting attention, evoking negative affect, sparking social interactions, prompting smokers to think about the harms of smoking, and increasing quit intentions. Our trial found that four out of these five mechanisms—negative affect, thinking about harms, (anticipated) social interactions, and intentions—also explained how SSB warnings exert their effects on behavior (Table 3). Of the five TWM mechanisms, only attention was not a mediator of SSB health warnings’ impact on purchases, similar to another recent study of text warnings [63]. Our results were also generally consistent with the TWM’s omission of attitudes and beliefs: of the seven attitudes and beliefs we studied, only injunctive norms were a mediator of SSB warnings’ effects on purchases. Taken together, these results suggest that it may be time to generalize the TWM to other products and behaviors.
Tobacco Warnings Model versus reasoned action mediators in explaining health warnings’ effect on sugar-sweetened beverage (SSB) purchases
| Construct | Warning on mediator | Mediator on behavior | Mediated effect |
|---|---|---|---|
| Tobacco Warnings Model mediators | |||
| Attention | ● | ○ | ○ |
| Thinking about harms | ● | ● | ● |
| Negative affect | ● | ● | ● |
| Anticipated social interactions | ● | ● | ● |
| Intentions to limit SSBs in store | ● | ● | ● |
| Intentions to limit beverages with added sugar | ○ | ● | ○ |
| Reasoned action mediators | |||
| Perceptions of added sugar | ○ | ● | ○ |
| Positive product attitudes | ○ | ● | ○ |
| Positive behavioral attitudes | ○ | ● | ○ |
| Negative outcome expectations | ○ | ○ | ○ |
| Self-efficacy | ○ | ● | ○ |
| Response efficacy | ○ | ○ | ○ |
| Injunctive norms | ● | ● | ● |
Table shows statistical significance of path coefficients (second column: a pathway, regressing the mediator on treatment arm; third column: b pathway, regressing sugar-sweetened beverage purchases on the mediator, controlling for treatment arm) and mediated effects (last column: a × b). Coefficients were estimated in linear regressions controlling for Hispanic ethnicity and overweight status.
● Statistically significant path coefficient or mediated effect, p < .05.
○ Path coefficient or mediated effect was not statistically significant, p > .05.
Our results also provide insight into warning design, suggesting that nutrition warnings may be more effective if they target the key mediators underlying warnings’ impacts on behavior, including negative affect, thinking about harms, and social interactions. For example, policymakers should consider adopting warnings that make the health harms of SSBs salient to consumers, given that thinking about these harms leads to lower SSB purchases. Experimental studies have found that warnings that include explicit statements about the health harms of unhealthy foods and beverages (e.g., “Beverages with added sugar contribute to tooth decay”) garner more attention [71] and elicit more thinking about harms [50] than warnings without these statements, suggesting policymakers would be wise to include such statements in food and beverage warnings. Additionally, recent qualitative research suggests that similar principles may also apply when designing campaigns to encourage consumers to use warnings when deciding what foods and beverages to buy [72].
Two strengths of this study included the randomized controlled design and the use of a convenience store laboratory that mimicked a real-world retail environment. Additionally, we recruited a diverse study sample and objectively measured a real-stakes behavioral endpoint.
Limitations of this study included that participants had single exposure to warnings. If SSB health warning policies are implemented, consumers would have repeated exposures to the warnings each time they encountered an SSB and their responses to warnings may change over time [65, 73–76]. Recent quasiexperimental and experimental research has found stable [36] or increasing [76] behavioral effects of warnings over 2–4 week interventions periods, but effects beyond this timeframe remain unknown. Studies with longer follow-up periods will be needed to establish whether our findings generalize beyond initial encounters with SSB warnings. Another limitation was that we assessed warning reactions only among those who reported that they noticed their trial label. While this approach allowed responses to reflect consumers’ reactions to an actual SSB health warning in a naturalistic retail environment, this also precluded us from examining warning reactions as a mediator in the full sample. A third limitation is that, while we objectively measured the primary outcome (SSB purchases), mediators were assessed via self-report. Future studies should objectively assess mediators when possible; for example, attention can be assessed using eye tracking [53, 71, 77, 78] and negative affect can be assessed using facial electromyography, which measures frowning [79, 80], or galvanic skin response, which measures sweat on the hands [79]. Finally, future studies of SSB warnings should examine potentially important constructs not assessed here, including warning avoidance [73, 81–83] and perceived severity [64, 84, 85].
Conclusions
Our randomized trial suggests that SSB health warnings reduce SSB purchases primarily by evoking negative emotions, prompting consumers to think about the harms of SSB consumption, increasing anticipation of talking to others about the warnings, and strengthening norms about limiting SSB consumption. These results are largely consistent with the TWM of why tobacco warnings increase quitting behavior, suggesting that the model may generalize to other products and behaviors. Nutrition warnings and other health communication campaigns that target emotional responses, thinking about harms, social interactions, and injunctive norms may be more effective at changing purchase behavior than messages targeting other mediators.
Acknowledgments
We wish to thank Chulpan Khristamova for exceptional management of the Fuqua Behavioral Lab; Dana Manning, Carmen Prestemon, and Jane Schmid for assistance with data collection; Emily Busey for assistance with graphic design; and Natalie R. Smith for assistance with randomization and data preparation.
Compliance with Ethical Standards
Authors’ Statement of Conflict of Interest and Adherence to Ethical Standards The authors declare that they have no conflicts of interest.
Funding This project was supported by the National Center for Advancing Translational Sciences (NCATS), National Institutes of Health, through Grant Award Number UL1TR002489 (internal grant number 2KR951708) and through the UNC Family Medicine Innovations Award (no number). A.H.G. received training and general support from the National Institutes of Health (CPC P2C HD050924, T32 HD007168). The funders had no role in the design or conduct of the study; collection, management, analysis, or interpretation of the data; the preparation, review, or approval of the manuscript; or the decision to submit the manuscript for publication.
Authors’ Contributions A.H.G. and N.T.B. conceptualized and designed the study. A.H.G. analyzed the data and wrote the first draft of the manuscript. N.T.B. supervised the project and provided critical feedback on analysis, interpretation, and writing. All authors read and approved the final version for submission. A.H.G. has full access to all of the data in the study and takes responsibility for the integrity of the data and the accuracy of the data analysis.
Ethical Approval All procedures performed in studies involving human participants were in accordance with the ethical standards of the institutional and/or national research committee and with the 1964 Helsinki declaration and its later amendments or comparable ethical standards.
Informed Consent: Informed consent was obtained from all individual participants included in the study.
References
Petty RE, Cacioppo JT. The elaboration likelihood model of persuasion. In: Communication and Persuasion. New York, NY: Springer; 1986:1–24.
