


Abstract
As one of the largest single-radiation sources of phytophagous insects, the higher level phylogeny of lepidopteran lineages has been debated for decades, especially the early divergences of nonditrysia. Here, we use 74 mitochondrial genomes representing seven nonditrysian superfamilies, including the newly sequenced mitochondrial genomes of eight families and 30 species. Four datasets were constructed and used for a phylogenetic analysis based on maximum likelihood (ML) and Bayesian inference (BI) methods. The results reveal that (1) nonditrysian lineages presented typically nested relationships with the family Micropterigidae as the sister-group to the remaining Lepidoptera, (2) monophyly of major clades in Lepidoptera, including Glossata, Heteroneura, Eulepidoptera and Ditrysia, was strongly supported, and (3) Neopseustoidea formed the sister of the remaining Glossata. Divergence-time analysis estimated that Lepidoptera originated c. 222 Mya during the Middle Triassic and that most superfamilies/families of nonditrysia originated from the Early Cretaceous to the Early Palaeogene, which largely coincided with the radiation of angiosperms. Additionally, three novel gene rearrangements in the gene cluster ‘MIQ’ and ‘TP’ were found in nonditrysian groups. Further mitochondrial genome data will help us to better understand the evolution of early nonditrysian lineages.
INTRODUCTION
As the largest single radiation of phytophagous invertebrates, Lepidopteran insects play an important role in genetics, physiology, development, ecology and evolutionary biology (Mitter et al., 2017). Therefore, a clear and established phylogeny could help us to understand the diversity and adaptations of Lepidoptera. An increasing number of studies based on morphological and/or molecular data have also gradually improved the phylogenetic framework of the order Lepidoptera (Kristensen, 2003; Kristensen et al., 2007; Regier et al., 2009, 2015; Mutanen et al., 2010; Kawahara & Breinholt, 2014; Heikkilä et al., 2015; Mitter et al., 2017; Kawahara et al., 2019; Mayer et al., 2021; Rota et al., 2022) as well as phylogenetic relationships in some groups, e.g. the ‘bombycoid complex’ (Regier et al., 2008a), Saturniidae (Regier et al., 2008b), Pyraloidea (Regier et al., 2012b), Tortricidae (Regier et al., 2012a), Gracillariidae (Kawahara et al., 2017), Heliozelidae (Milla et al., 2018, 2020) and Epicopeiidae (Zhang et al., 2020b), etc.
The so-called nonditrysia is defined as all lepidopteran members except Ditrysia and consists of c.2600 species belonging to 14 superfamilies and 23 families (van Nieukerken et al., 2011; updated to 13 superfamilies in Mitter et al., 2017). Although these insects include no more than 2% of all lepidopteran species, nonditrysian moths account for approximately 20% families of all Lepidoptera and have a large number of synapomorphies (Kristensen, 2003, Kristensen et al., 2007; Van Nieukerken et al., 2011). The most widely accepted hypothesis of nonditrysian phylogeny was proposed by Kristensen (2003) based on morphological characters and further summarized in Kristensen et al. (2007, Fig. 1B). For a long time, major clades of this hypothesis were recognized by most researchers, such as Coelolepida, Eulepidoptera, Glossata, Heteroneura, Myoglossata and Neolepidoptera. Although some of the major clades have been strongly corroborated by morphological and molecular evidence, there are ambiguous and even conflicting results regarding the phylogenetic relationships between some superfamilies/families (Fig. 1). For example, Neopseustoidea was first regarded as a sister-clade of the remaining Myoglossata (Wiegmann et al., 2002; Kristensen et al., 2007; Mutanen et al., 2010; Fig. 1A–C) and then was considered the sister-group of Heteroneura (Regier et al., 2013, 2015; Heikkilä et al., 2015; Fig. 1D, E). However, current studies based on mass molecular data have shown that Neopseustoidea groups with Eriocranioidea, thus forming the sister-clade of the remaining Glossata (Bazinet et al., 2017; Mitter et al., 2017; Kawahara et al., 2019; Fig. 1F–H). Some datasets presented another topology in which Neopseustidae + Eriocraniidae grouped with the clade Lophocoronidae + Hepialidae as sister of all other Glossata, but the branch support is relatively poor (Mayer et al., 2021; Fig. 1I). Here, we reconstruct the tree of life of nonditrysians and try to explain some conflicting relationships among the superfamilies of Lepidoptera.
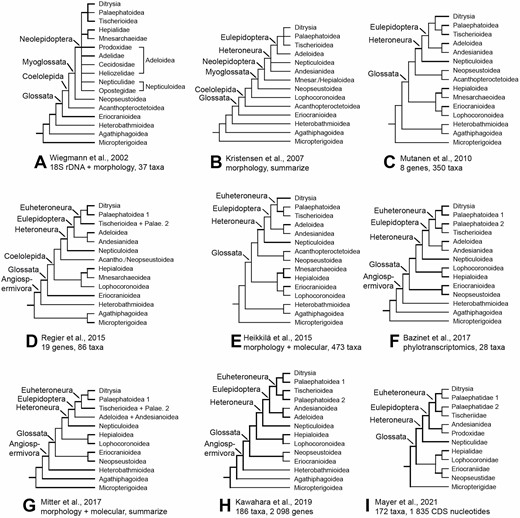
Previous hypotheses on relationships among nonditrysian lineages. A, most parsimonious tree for combined 18S rDNA plus morphological characters from Wiegmann et al. (2002). B, synopsis of relationships inferred from morphology by Kristensen et al. (2007). C, maximum likelihood tree of the nonditrysian portion based on eight genes and 350 taxa from Mutanen et al. (2010). D, relationships among nonditrysian superfamilies inferred from 19 genes and 86 taxa by Regier et al. (2015). E, maximum likelihood tree of over 500 morphological characters and eight molecular genes of 473 taxa combined by Heikkilä et al. (2015). F, maximum likelihood tree of phylogenetic relationships among nonditrysian lineages estimated on phylotranscriptomics data of 28 taxa by Bazinet et al. (2017). G, estimated phylogeny of nonditrysian superfamilies of Lepidoptera synthesized from multiple previous studies by Mitter et al. (2017). H, evolutionary tree derived from a maximum-likelihood analysis of 749 791 amino acid sites from transcriptomes of 186 species by Kawahara et al. (2019). I, phylogenetic tree inferred using 1835 CDS nucleotides of 172 taxa by Mayer et al. (2021). Thicker lines indicate better supported groupings.
With the wide application of molecular data in studies of insect phylogenetics, some molecular-based analyses (Wiegmann et al., 2000) and molecular combined morphological evidence (Wiegmann et al., 2002, Fig. 1B) have supported the nested model in basal nodes of nonditrysia. However, limited by samples and informative sites, there were a few clades whose placement remained ambiguous in nonditrysia (Mitter et al., 2017). Therefore, increasing taxon sampling and adopting more genes for phylogenetic inference seem to be an effective solution. Thus, more molecular data and representative species were used to test hypotheses of the earlier splits in Lepidoptera, including nuclear genes (Mutanen et al., 2010; Regier et al., 2013, 2015; Fig. 1C–D), combination of morphological characters and molecular data (Heikkilä et al., 2015; Mitter et al., 2017; Fig. 1E, G), phylotranscriptomics (Bazinet et al., 2017; Kawahara et al., 2019; Fig. 1F, H) and nucleotide data from target enrichment (Mayer et al., 2021; Fig. 1I). Although mitochondrial genomes are used in some phylogenetic studies at multiple levels and groups, they have not been used as much as nuclear genes and have not been used in the phylogenetic analysis of nonditrysians before. Moreover, mitochondrial genome sequences of nonditrysians are rare in related databases; for example, to date the NCBI has only 15 mitogenome sequences, mainly in the family Hepialidae. Mitochondrial genomes have been used in a number of phylogenetic studies of Lepidoptera (Megens et al., 2004; Timmermans et al., 2014; Yang et al., 2015, 2019; Wang et al., 2018; Chen et al., 2020) and other insect orders (Cameron et al., 2007, 2012; Fenn et al., 2008; Cui et al., 2013; Allio et al., 2019; Liu et al., 2019; Nie et al., 2020, 2021). Thus, we added 30 new mitochondrial genomes representing seven superfamilies and eight families for the first time. In this study, we attempted to uncover the phylogenetic relationship and evolutionary history of nonditrysia at the mitochondrial genome level. We also discuss the connection between phylogenetic topologies with different datasets and estimation methods.
MATERIAL AND METHODS
Sampling and dna extraction
Detailed collection information representing 30 nonditrysian samples is shown in the Supporting Information, Table S1. Adults were stored in 100% ethanol at –20 °C. All samples were preserved in the Insect Museum of Hunan Agricultural University, Changsha City, Hunan Province, China. Total genomic DNA was extracted from the leg tissue of a single specimen following the protocol provided by SteadyPure Universal Genomic DNA Extraction Kit v.1.0 (Changsha, Hunan, China), with some modifications. Briefly, the incubation time was increased to 24 h with the addition of 10 μL of proteinase K. In addition, DNA was preserved at –20 °C and used for sequencing.
Genome sequencing and assembly
The primers (forward) 5ʹ-GGTCAACAAATCATAAAGATATTGG-3ʹ (LCO1490) and (reverse) 5ʹ-TAAACTTCAGGGTGACCAAAAAATCA-3ʹ (HCO2198) (Folmer et al., 1994) were used for polymerase chain reaction (PCR) amplification and sequencing to obtain DNA sequences of the cytochrome c oxidase subunit I gene (COI) in this study. The PCR products were recovered and cloned. The purified amplicons were sent to Qingke Biotech Co. Ltd (Changsha, China) for Sanger sequencing, and the sequences were analysed using the program GENEIOUS R8 (Kearse et al., 2012).
Total genomic DNA was sent to Novogene (Beijing, China) for next-generation sequencing. An Illumina TruSeq library of each taxon was prepared with an average insert size of 350 bp, and the genomic DNA was sequenced on the Illumina HiSeq platform with 150 bp paired-end reads at Novogene (Beijing, China). The contigs and scaffolds of highly qualified sequences were determined using IDBA-1.1.3 (Peng et al., 2010, 2011). The resulting bait sequences were used to identify mitochondrial genomic assemblies using BLAST searches with at least 98% similarity and minimum and maximum k-values of 40 bp and 140 bp, respectively. To examine the accuracy of the assembly, clean reads were mapped on to the obtained mitochondrial contig of each sample using GENEIOUS R8 (http://www.geneious.com/), allowing for mismatches of up to 2%, a maximum gap size of 3 bp and a minimum overlap of 100 bp (Gillett et al., 2014). The mitochondrial genomes were annotated on the ORF finder (https://www.ncbi.nlm.nih.gov/orffinder/) and the MITOS webserver (http://mitos.bioinf.uni-leipzig.de/index.py) (Bernt et al., 2013). Protein-coding genes (PCGs) and rRNA genes were identified by alignment with homologues from species of previously sequenced nonditrysian mitochondrial genomes using GENEIOUS R8 (Kearse et al., 2012). tRNA genes were predicted and determined by tRNA scan-SE or MITOS. After annotation, the former sequenced COIs were used to confirm the identity of the new genomes. Complete mitogenome data of 30 sequences were deposited in GenBank with the accession numbers showed in the Supporting Information, Table S1.
Measures of nucleotide variation
The base compositions of all mitogenome datasets were calculated in MEGA 7 (Kumar et al., 2016). The heterogeneity of nucleotide variation among sequences was analysed by AliGROOVE (Kück et al., 2014) with the default window size. This method establishes nonrandom similarity between any two sequences at each site in a matrix of pairwise comparisons relative to the variation in the entire set of sequences.
Phylogenetic analyses
The publicly available mitogenomes of all nonditrysians and some representative ditrysians were obtained from GenBank (available online: http://www.ncbi.nlm.nih.gov). Detailed information on these sequences is shown in the Supporting Information, Table S2, along with the 20 new mitogenome sequences obtained in this study (74 taxa of 72 species in total). To estimate the phylogenetic relationships within nonditrysians at a high level, 45 nonditrysians covering 11 families in seven superfamilies and 27 ditrysians were used as ingroups, and two trichopteran species served as outgroups to root the topology.
Thirteen PCGs and two rRNA genes were extracted with GENEIOUS R8 and aligned by the MAFFT v.7 website (http://mafft.cbrc.jp/alignment/server/index.html). Removing the third codon position and translation of amino acids for PCG genes were carried out by MEGA v.7 (Kumar et al., 2016). Poorly aligned and highly divergent regions were removed with GBlocks v.0.91b (Castresana, 2000). The parameter setting ‘None’, in which all gaps were removed, was used to identify the conserved regions. Concatenation of multiple alignments was performed by GENEIOUS R8. Finally, a total of four datasets were constructed for phylogenetic analysis: PCG (13 PCGs), PCGRNA (13 PCGs plus two rRNA genes), PCG12RNA (first and second codon positions of 13 PCGs plus two rRNA genes) and PCGAA (amino acid data from 13 PCGs).
For the phylogenetic analysis, the best-fitting models for each gene were calculated using PartitionFinder v.2.7 (Lanfear et al., 2016). The maximum likelihood (ML) tree was constructed with IQ-TREE software (iqtree.cibiv.univie.ac.at/) using the ultrafast bootstrap approximation approach with 1000 replicates (Ronquist & Huelsenbeck, 2003; Minh et al., 2013, 2020; Nguyen et al., 2014). Nodes with a bootstrap percentage (BP) of at least 95% were considered well supported in the ML analyses (Hoang et al., 2018). The Bayesian (BI) tree was computed with MrBayes in PhyloSuite v.1.2.2 (Zhang et al., 2020a). The BI analysis was conducted with the Markov chain Monte Carlo analysis run for 10 000 000 generations, sampled every 1000th generation and with a burn-in of 25%. Bayesian posterior probabilities (PP) > 0.95 were interpreted as strongly supported (Erixon et al., 2003). Finally, all phylogenetic trees were visualized using FigTree v.1.4.3 software (Rambaut, 2016).
Ancestral character state reconstruction
Ancestral states for the gene rearrangement of transfer RNA MIQ and TP were reconstructed in MESQUITE v.3.6.1 (http://mesquiteproject.org; Maddison & Maddison, 2019) under parsimony optimization using the phylogenetic trees from Bayesian analysis of the PCG dataset.
Divergence-time estimation
Divergence times among nonditrysia were estimated based on the PCG dataset (at the nucleotide level) using the Bayesian method implemented in the software MCMCTree v.4.9h, part of the PAML package (Yang, 2007). The independent rate model for the molecular clock and the HKY85 model for nucleotide substitutions were set in the mcmctree.ctl control file, with default settings for other parameters. For the molecular clock analysis, a birth–death prior for divergence time with soft bounds was used (Yang & Rannala, 2006). The root age of the superorder Amphiesmenoptera (Lepidoptera and Trichoptera) was constrained to a uniform prior of 137–288 Mya from TIMETREE (http://www.timetree.org/). Two fossil calibrations, 110–130 Mya of leaf mines of Nepticuloidea (Labandeira et al., 1994) and 110–130 Mya of Adeloidea (Whalley, 1978) and a secondary calibration point (85–95 Mya of Nymphalidae; Wahlberg et al., 2009), were available to calibrate the nodes. By default, we allocated 2.5% of the probability mass to lie outside each calibration interval. The analysis was performed by running 20 000 generations, with the first 2000 generations discarded as burn-in.
RESULTS
Mitochondrial genomic organization of nonditrysia
To date, there have been 15 mitochondrial genome sequences of nonditrysia in GenBank, including one Tischeriidae, one Nepticulidae and 13 Hepialidae. Among our 30 newly sequenced mitochondrial genomes, eight representative families were first reported in the mitochondrial genome, namely, Adelidae, Eriocraniidae, Heliozelidae, Incurvariidae, Micropterigidae, Neopseustidae, Opostegidae and Palaeosetidae.
Including the new sequences in the present study, 45 taxa of nonditrysia have publicly available mitochondrial genomic data. All of them included the entire set of 37 genes (13 PCGs, 22 tRNA genes and 2 rRNA genes), except Neomicropteryx bifurca, and the lengths range from 15 006 bp (Coptotriche sp._2) to 17 223 bp (Vietomartyria wuyunjiena_Female). The nucleotide compositions of the 45 nonditrysia mitogenomes were significantly biased toward A and T, with an average A + T content of 81.90%. Among the 11 families represented, the mitochondrial genomes of Micropterigidae were distinctly more A + T-rich than those of other families (86.16 ± 0.45%, N = 4) and Heliozelidae showed the lowest A + T content (78.86 ± 0.71%, N = 3). The nucleotide skew statistics for the entire majority strand showed that most mitogenomes of nonditrysia had slight or moderate A skews and a moderate C skew. In contrast to other families, Micropterigidae surprisingly presented a slight T skew and a moderate G skew (Fig. 2).
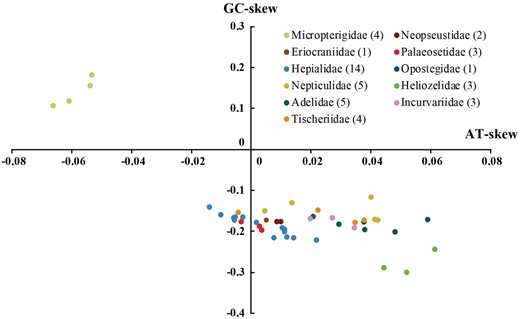
Scatter plot of AT- and GC-skews in the nonditrysian mitogenomes. Values were calculated for the majority strand of the entire mitogenome sequences. All the species are listed in the Supporting Information, Table S2. The legend indicates nonditrysian families and their corresponding taxa numbers. AT-skew = (A-T)/(A + T); GC-skew = (G-C)/(G + C).
The heterogeneity of sequence variation was assessed with AliGROOVE based on different datasets. In general, the mitogenomes had low heterogeneity of sequence composition for most pairwise comparisons between the sequences. Compared to the entire protein-coding gene dataset (13PCG) and entire protein-coding genes plus two ribosomal RNAs (13PCG + 2RNA), the third position of the PCGs (13PCGs_codon3) showed relatively higher heterogeneity (Fig. 3). When removing the third position, the dataset (13PCG_codon12 + 2RNA) had significantly reduced heterogeneity. In addition, the heterogeneity of the amino acid dataset (13PCG_AA) was significantly higher than that of all nucleotide datasets. Overall, the sequences of the family Heliozelidae showed the lowest heterogeneity compared with other major groups, which was mainly reflected in the third codon positions. However, the lowest heterogeneity compared with others was present in species Nemophora assamensis Kozlov, 1997, followed by Vespina meridiana Hirowatari & Yagi, 2021, when the third positions were removed, which showed that their heterogeneity was mainly reflected in the first and second codon positions, as well as amino acids. In addition, heterogeneity according to this test was significantly lower in the family Micropterigidae but higher in pairwise comparisons with other members, which may indicate extreme conservatism in this family.
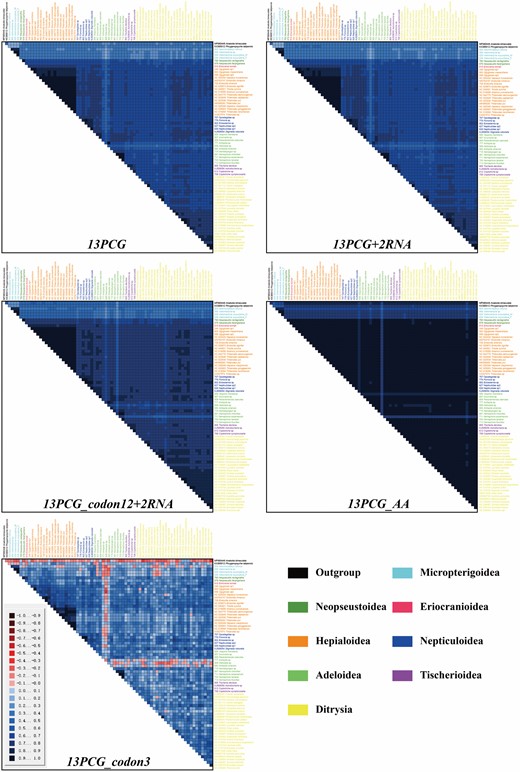
Heterogeneity of mitogenome composition for different datasets: 13PCG, 13PCG + 2RNA, 13PCG_codon12 + 2RNA, 13PCG_AA and 13PCG_codon3. The pairwise Aliscore values range from −1 indicating full random similarity, to +1 indicating nonrandom similarity. Species names are listed on top and on the right side of the matrix and are colour-coded to match their member superfamilies (lower right corner).
Novel gene rearrangement within the nonditrysian mitochondrial genome
In the newly provided mitochondrial genomes, five gene arrangement types were present in the ‘MIQ’ and ‘TP’ gene clusters, including inversion and translocation (shown in Fig. 4). The family Tischeriidae (four species) had the typical gene arrangement as that of the majority of Lepidoptera, which was arranged as trnM-trnI-trnQ between the A + T-rich region and nad2 gene (named Type I, the same below; Timmermans et al., 2014; Park et al., 2016). In the families Adelidae, Eriocraniidae, Heliozelidae, Hepialidae, Incurvariidae, Neopseustidae, Nepticulidae, Opostegidae and Palaeosetidae, three different gene arrangements were present in the ‘MIQ’ gene cluster. Most of them had the same arrangement as that of known Nepticulidae and Adelidae species (trnI-trnQ-trnM as Types II and III, Timmermans et al., 2014), but a local inversion of the trnQ gene was shown in one species of Neopseustidae, Neopseustis rectagnathaLiao et al., 2021. Some species of Nepticulidae (Fomoria sp. and Ectoedemia sp.) and Incurvariidae [Incurvaria sp. and Paraclemensia caerulea (Issiki, 1957)] had a novel gene arrangement, trnQ-trnI-trnM (Type IV). Although the mitochondrial genomes of Neomicropteryx bifurca Issiki, 1953 are incomplete without these gene clusters, members of the family Micropterigidae (three sequences) all differed from other lepidopteran types with trnQ-trnM-trnI. More strangely, all species of Vietomartyria (Micropterigidae) also differed from other known Lepidoptera with the swap of positions between trnT and trnP (Type V) which was located between nad4L and nad6 genes.
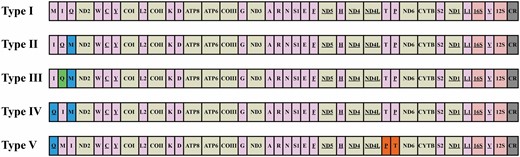
Mitochondrial gene rearrangements in nonditrysia. Gene sizes are not drawn to scale. Abbreviations of gene names are as follows: ATP6 and ATP8, ATP synthase subunits 6 and 8; COI–COIII, cytochrome c oxidase subunits 1–3; Cytb, cytochrome b; ND1–6 and ND4L, NADH dehydrogenase subunits 1–6 and 4L; 16S and 12S, large and small rRNA subunits. tRNA genes are indicated by their one-letter corresponding amino acids. CR, control region/A + T-rich region. Genes are transcribed from left to right except for those that are underlined, which have the opposite transcriptional orientation. Rearrangements of tRNA genes are highlighted by colours (green: gene inversion; blue and orange: gene rearrangements).
Phylogeny of nonditrysia
The Bayesian analysis (BI) and maximum likelihood (ML) results based on three datasets produced a nearly identical topology regarding superfamily or family-level relationships, with high posterior probability (PP) values and bootstrap percentage (BP) (Fig. 5; Supporting Information, Figs S1–S4). The monophyly of Lepidoptera was fully supported with the superfamily Micropterigoidea forming the suborder Zeugloptera (PP = 1/1/1/1, BP = 100/100/100/100%; corresponding to PCG, PCGRNA, PCG12RNA and PCGAA respectively, the same below), and all superfamilies except Eriocranioidea, just including one species Eriocrania komaii Mizukawa et al., 2006, were recovered as monophyletic groups with full support in both of our complete datasets and inferred trees (all PP values are 1 and BP values are 100%).
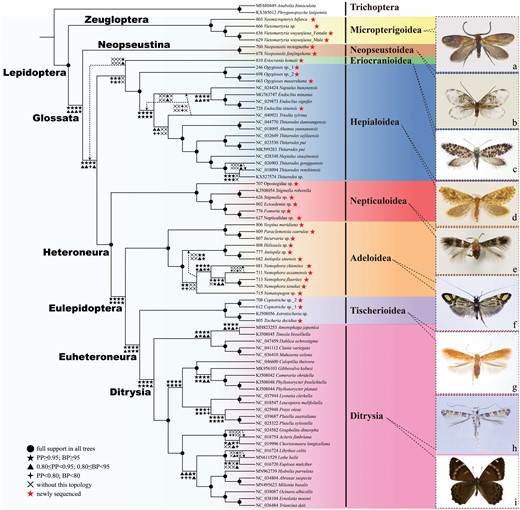
Bayesian inference and the maximum likelihood estimate of phylogenetic relationships among nonditrysian Lepidoptera inferred from the combined molecular dataset (PCGRNA, 64 taxa). Numbers on each node from left to right correspond to the Bayesian posterior probability values and the bootstrap percentage values of ML analysis, respectively. ‘-’ indicates support values < 0.5/50 or missing. All habitus photographs are taken by CQ Liao, except photographs of c and g taken by S Yagi, with scientific names as follows: a, Vietomartyria wuyunjiena Liao, Hirowatari & Huang, 2020 (Micropterigidae); b, Neopseustis fanjingshana Yang, 1988 (Neopseustidae); c, Eriocrania komaii Mizukawa, Hirowatari & Hashimoto, 2006 (Eriocraniidae); d, Ogygioses maoershanaLiao, Hirowatari & Huang, 2021 (Palaeosetidae); e, Stigmella sp. (Nepticulidae); f, Nemophora fluorites (Meyrick, 1907) (Adelidae); g, Tischeria decidua Wocke, 1876 (Tischeriidae); h, Gibbovalva kobusi Kumata & Kuroko, 1988 (Gracillariidae); i, Lethe helle Leech, 1891 (Nymphalidae)
The phylogenetic tree showed that nonditrysia is indubitably paraphyletic and consists of a nested series of clades (Fig. 5; Supporting Information, Figs S1–S4). As the largest suborder of Lepidoptera, Glossata, which is characterized by typical adult proboscis, was a distinct monophyletic group with strong support in the BI tree (PP = 1/1/0.99/1) but moderate in the ML tree (BP = 87/93/87/98%), and the superfamily Neopseustoidea was the sister-group of the remaining Glossata. Subsequently, an important conflict occurred between nucleotide and amino acid data. The superfamily Eriocranioidea was sister to Hepialoidea + Heteroneura in the PCGAA dataset (PP = 1, BP = 92%). However, all nucleotide datasets showed another topology: a clade consisting of Eriocranioidea and Hepialoidea as a sister-group of Heteroneura with strong support in all BI trees and one ML tree (PCGRNA dataset), but distinctly weak support in the remaining ML trees (PP = 0.99/1/0.98, BP = 75/100/66%). Heteroneura, which is known for their differing venation in forewings versus hindwings and frenular wing coupling, had full support as an undisputed monophyletic group in both BI and ML trees (PP = 1/1/1/1, BP = 100/100/100/100%). The superfamily Nepticuloidea was recovered as a sister-group of the remaining Heteroneura. Eulepidoptera, which is characterized by the pilifers, bristle-bearing organs at the proboscis base, and an advanced mechanism locking the proboscis halves, also had strong support in all datasets (PP = 1/1/1/1, BP = 96/99/100/95%) with the superfamily Adeloidea as the sister-group of all the others. In addition, the superfamily Tischerioidea was a sister-group of the remaining Euheteroneura, i.e. the mega-diverse derived clade Ditrysia, with well-supported values in most datasets (PP = 0.95/1/1/1; BP = 82/99/98/95%).
Divergence-time estimation of nonditrysia
The divergence-time analysis indicated that Lepidoptera originated during the Middle Triassic [222.0 Mya, 95% confidence interval (CI): 234.6–204.0 Mya] (Fig. 6) with the superfamily Micropterigoidea as the first split lineage. Subsequently, Glossata appeared in the Early Jurassic c.196.1 Mya (95% CI: 212.2–178.8 Mya) and then diverged into Neopseustoidea and the remaining Glossata. The split between Eriocranioidea + Hepialoidea and Heteroneura occurred 175.1 Mya (95% CI: 190.4–159.8 Mya) in the Middle Jurassic, and a divergence between Nepticuloidea and Eulepidoptera occurred at 161.6 Mya (95% CI: 175.4–147.8 Mya) in the Late Jurassic. Within Eulepidoptera, the split between Adeloidea and the remaining members occurred 153.2 Mya (95% CI: 166.9–140.6 Mya) in the Late Jurassic, followed by a divergence between Tischerioidea and the largest clade Ditrysia that occurred at 145.1 Mya (95% CI: 158.2–132.4 Mya) in the Early Cretaceous.
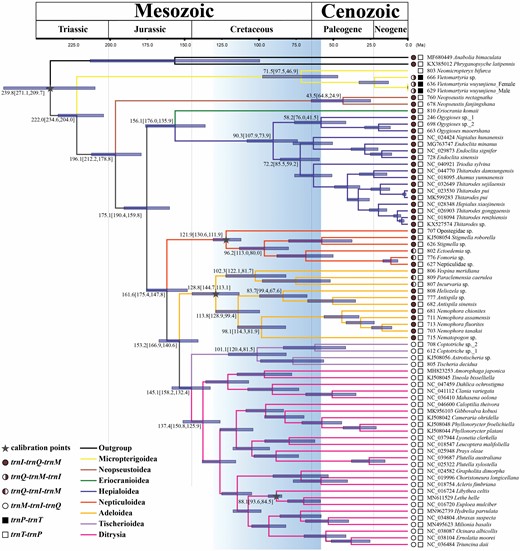
Chronogram showing nonditrysian phylogeny, divergence time estimation and ancestral state reconstruction of the tRNA gene arrangement. Phylogenetic tree presenting divergence dates produced by the Bayesian method of the 13PCG dataset using three fossil calibration points (grey star targets). Blue bars indicate the 95% mean confidence interval (CI) of each node. A geological timescale is shown at the top. Branch lengths are measured in Myr. The colour of pie and block charts represent different tRNA gene arrangements in the gene clusters MIQ and TP, respectively.
DISCUSSION
Phylogenetic signal in gene rearrangement of nonditrysia
Gene rearrangement in the mitochondrial genomes, especially the most common types in tRNA genes, generally occurred in certain insect groups (Yukuhiro et al., 2002; Cao et al., 2012; Timmermans et al., 2014; Park et al., 2016; Feng et al., 2020; Powell et al., 2020). Most of the rearrangements can be explained by the tandem duplication-random loss (TDRL) model and recombination-(Cameron, 2014). Some types of gene rearrangements are considered to have phylogenetic signals and have been used for phylogenetic analysis or ancestral state reconstruction (Timmermans et al., 2014; Liu et al., 2019; Feng et al., 2020). Gene rearrangements are apparently rare events in Lepidoptera, including transposition, inversion and inverse transposition in transfer RNA clusters ‘M-Q’ and ‘A-F’ (Cao et al., 2012; Park et al., 2016). The gene rearrangement in the tRNA ‘M-I-Q’ cluster was considered related to the evolution of Lepidoptera, and the MIQ arrangement was considered as a synapomorphy in Ditrysia (Cao et al., 2012; Cameron, 2014; Park et al., 2016). The IQM rearrangement seems to be the ancestral state occurring in nonditrysian groups, such as Adeloidea, Hepialoidea and Nepticuloidea (Cao et al., 2012; Timmermans et al., 2014; Park et al., 2016).
Similar to the previous studies, Tischeriidae and most other nonditrysian families showed the known arrangements types of MIQ (Type I) and IQM (Type II), respectively. Types III and IV seem to be two rare gene arrangements present in a few species. However, Type V is only present in the genus Vietomartyria Hashimoto & Mey, 2000, especially rearrangement PT, as a novel and unique gene arrangement, differing from all known lepidopteran species. Strangely, another species of the family Micropterigidae, Neomicropteryx bifurca, had the typical gene arrangement of other nonditrysians, although this sequence missed the MIQ gene cluster. Based on previous studies, the gene rearrangement types appeared closely reflected in the phylogeny of Lepidoptera (Cao et al., 2012; Timmermans et al., 2014). Type V seems to be the oldest and ancestral gene arrangement, although the ancestral state reconstruction analysis showed that the common ancestor of Lepidoptera had the same gene arrangement trnI-trnQ-trnM and trnT-trnP as that of most nonditrysia (Fig. 6; Supporting Information, Figs S5, S6), and this type was also present in most Trichoptera. As trnP-trnT for Pyrrhocoroidea in Hemiptera (Liu et al., 2019), the gene rearrangement Type V should be an autapomorphy just for the genus Vietomartyria of Micropterigidae. Perhaps at least one translocation event occurred in this comparatively young genus independently (Fig. 6). However, the lack of mitochondrial genomes in some representative families has led to difficulty in determining the origin and divergence nodes in nonditrysia. Therefore, nonditrysians should be taken into a great consideration in comparative mitogenomic and phylogenetic studies of Lepidoptera, which has contributed to our understanding of Lepidoptera mitogenome and provided insights into mitogenomes evolution, especially the relationship between gene rearrangements and lepidopteran evolution.
Implications for the phylogeny of nonditrysia
Although not all representative superfamilies are included herein, this study can still provide some insights into the phylogeny and evolution of nonditrysians and even all of Lepidoptera from different perspectives. Mitochondrial genomes, which have a different evolutionary history from the nuclear genome, largely support the phylogenetic hypothesis resulting from large numbers of nuclear genes in our study. Previous phylogenetic studies have improved our knowledge of the higher level phylogeny of the order Lepidoptera, thus corroborating the monophyly of the largest major clade Glossata, and the clades Euheteroneura, Eulepidoptera and Heteroneura (Kristensen, 1998, 2003; Wiegmann et al., 2000, 2002; Krenn & Kristensen, 2004; Kristensen et al., 2007; Mutanen et al., 2010; Regier et al., 2013, 2015; Heikkilä et al., 2015; Bazinet et al., 2017; Mitter et al., 2017; Kawahara et al., 2019; Mayer et al., 2021; Rota et al., 2022). Our results also strongly support the monophyly and distinctiveness of those clades above, although some datasets showed a relatively lower support value. For example, the suborder Glossata, the largest and most robust lineage at all times, was strongly supported by the BI tree but only moderately supported by the ML method, which was presumably related to the estimation methods. Our results show that different estimation methods not only affected the branch support, but also partial terminal topologies to some degree, although the global topology and major clades did not change (Fig. 5; Supporting Information, Figs S1–S3). In addition, the parameter setting of the calculation process, for example, the treatment for the gap positions, can also affect the nodal support (Wang et al., 2018), similar to the partition style of the dataset (Nie et al., 2020; Rota et al., 2022). Relationships among nonditrysian supperfamilies in our results were similar to those found by previous studies (Regier et al., 2015; Bazinet et al., 2017; Kawahara et al., 2019; Mayer et al., 2021), except for the superfamily Neopseustoidea. The phylogenetic position of Neopseustoidea and their relationships with related groups has been unstable for a long time. This initial monotypic superfamily was first considered as sister to all other Myoglossata (Kristensen, 1998; Wiegmann et al., 2002; Kristensen et al., 2007). Then, it grouped with Acanthopteroctetidae and the newly established family Aenigmatineidae, which together constituted a strongly supported clade called Neopseustoidea s.l., based on morphological characters and molecular evidence (Mutanen et al., 2010; Kristensen et al., 2015; Regier et al., 2015). Currently, the clade consisting of Neopseustoidea and Eriocranioidea is considered a basal split of Glossata (Bazinet et al., 2017; Mitter et al., 2017; Kawahara et al., 2019) or a sister-group of Lophocoronidae + Hepialidae (Mayer et al., 2021). Although the same topology of Neopseustoidea + Eriocranioidea as sister-group of the remaining Glossata was present in our amino acid trees (Supporting Information, Fig. S4), all results inferred from nucleotide datasets departed extensively from the above arrangements and gave another topology. Neopseustoidea alone were sister to all Glossata followed by Eriocranioidea + Hepialoidea, with strong support in the BI trees but only moderate support in the ML trees, while the lower support was presented in the sister-relationship within the latter clade (Fig. 5; Supporting Information, Figs S1–S3). The inconsistency of topologies may have resulted from the type of datasets, such as the position of Gelechiodea and the sister-relationship between Choreutoidea and Urodoidea (Rota et al., 2022). Compositional bias and relatively low taxon sampling were probably the reasons behind the instability of the results.
The analysed datasets did not have an impact on the global topology and relationships between the major clades, although the PCG and PCGRNA datasets presented some minor variations in Adelidae, Nymphalidae and Tortricidae (Supporting Information, Figs S1–S2). The PCG12RNA and PCGAA datasets showed relatively higher topology robustness on account of exactly the same topology from both the Bayesian and ML methods (Supporting Information, Figs S3, S4). One possible explanation for this situation was compositional bias, usually explained by compositional heterogeneity or codon positions (Fig. 3), which is why researchers generally used nucleotide datasets without third codon positions or direct amino acid datasets (Breinholt & Kawahara, 2013; Liu et al., 2019; Nie et al., 2020, 2021; Mayer et al., 2021; Rota et al., 2022).
In addition, our results also show a conflicting relationship in Adelidae, the so-called long-horn moths, which are known for their extremely elongate antenna, particularly in the male. This family was presented as a monophyletic group in the PCG and PCGRNA datasets (Fig. 5; Supporting Information, Figs S1–S2), but paraphyletic in the PCG12RNA and PCGAA datasets (Fig. 5; Supporting Information, Figs S3, S4). Regier et al. (2015) also found that most datasets showed the monophyly of Adelidae, while only the degen1 (19 genes) dataset showed paraphyly, both with relatively weak support. The family Adelidae includes approximately 300 species belonging to five genera of two subfamilies with a high diversity to date (Kozlov, 2016, 2020; Kozlov et al., 2017; Liao et al., 2021). The instability of the genus Nematopogon (representative of the subfamily Nematopogoninae) was a direct reason for this contradiction. Nematopogoninae possessed pectinifers of male genitalia and evidence from wing vestitures shared with the family Heliozelidae (Nielsen, 1980; Simonsen, 2001; Liao et al., 2019). However, Adelidae have always been regarded as a monophyletic group based on three synapomorphies: the long antenna, the narrow and slender cloaca in females, and the high number of ovarioles per ovary (Nielsen, 1980). More importantly, Heliozelidae are mostly miners in host plant leaves (Regier et al., 2015; Ahola et al., 2017; Liao et al., 2019). As stated by Regier et al. (2015), the synonymous/nonsynonymous conflict in this case does not represent compositional heterogeneity in some datasets, and the weight of the evidence favours the monophyly of Adelidae. We consider that the inconsistency of topologies possibly resulted from the different datasets, where the PCG12RNA and PCGAA datasets may have reduced phylogenetic signal to a certain extent (Rota et al., 2022).
Origin and diversification of nonditrysia
Lepidoptera are one of the most species-rich groups and a major super-radiation of herbivorous insects (Grimaldi & Engel, 2005). They were considered to have originated in the Late Triassic to Early Cretaceous, according to fossils and related molecular evidence (Whalley, 1977; Labandeira et al., 1994; Wahlberg et al., 2013; Misof et al., 2014; Van Eldijk et al., 2018), but the recent phylogenomic study of the phylogeny of Lepidoptera has advanced the origins of Lepidoptera to the Late Carboniferous (Kawahara et al., 2019). Our results suggest that Lepidoptera split from the Middle Triassic (~222 Mya), which is similar to earlier studies and other major clades.
The origin of the common ancestor of Lepidoptera occurred during a period from 240 to 222 Mya, but the family Micropterigidae (Neomicropteryx Issiki, 1931 and Vietomartyria) showed a relatively young origin time (~ 71.5 Mya) in our results. Our results differed from previous estimates based on multilocus data showing that the genus Vietomartyria should be distinctly younger than the common ancestor of Micropterigidae and have similar origin times for the genera Paramartyria Issiki, 1931 and Issikiomartyria Hashimoto, 2006 (Imada et al., 2011).
Analysis focusing on the fossil record recovered an early burst of diversification, resulting in a low and steady net diversification rate of Lepidoptera before the Early Jurassic (Condamine et al., 2016). However, evidence of insect diversification affected by the mass extinction of the Permian–Triassic event was generally conflicting or equivocal at the family level or above, especially based on different data sources, such as time-calibrated molecular estimation and fossil records (Labandeira & Sepkoski, 1993; Labandeira, 2005; McKenna et al., 2015; Sohn et al., 2015). In fact, low diversification of early lepidopteran groups, which are easily distinguished by some extremely primitive characters, cannot exclude the influences of this event because the radiation and expansion of more ancient groups may have been offset by extinctions due to low or even negative net diversification (Condamine et al., 2016). Frequently, the net diversification rate of Lepidoptera has increased steadily and continuously from the Jurassic to the recent time (Condamine et al., 2016) and has undergone the Cretaceous Terrestrial Revolution (KTR), an important event witnessing the rise of flowering plants (angiosperms), which finally led to profound changes in terrestrial plant communities (Ramírez-Barahona et al., 2020; Yang et al., 2020). Although it cannot fully characterize the impact of the environmental changes associated with angiosperm radiation during the KTR, there is no doubt that angiosperm radiation obviously and hugely affected some insect groups, such as bees (Cardinal & Danforth, 2013), butterflies and moths (Wahlberg et al., 2013), and beetles (Hunt et al., 2007; McKenna et al., 2015). Furthermore, a global increase in diversification after 80 Mya and throughout the Cenozoic is remarkable on the mean phylorate tree (Condamine et al., 2016). This is consistent with the fact that diversification among extant insect families may have accompanied angiosperm radiation and expansion (Labandeira & Sepkoski, 1993; Farrell, 1998; Farrell & Sequeira, 2004; Moreau et al., 2006).
In our study, the diversification of most nonditrysian superfamilies and families was estimated to have occurred during the Early Cretaceous to Early Palaeogene, which agrees with the radiation of angiosperms during the Early Cretaceous (Berendse & Scheffer, 2009; Smith et al., 2010). Benefiting from the evolution of angiosperms with rapid diversification, Lepidoptera, a group closely dependent on angiosperms, have undergone unprecedented evolution and extraordinary diversification of superfamilies and families, especially coevolution between the tube-like proboscis and accession of flower nectar (Kristensen, 1998; Moreau et al., 2006; Kawahara et al., 2019). The enormous taxonomic diversity and architectural complexity of flowering plants provided multiple axes of ecological niches and abundant food sources (Jaenike, 1990; Futuyma, 1991). The radiation of angiosperms in the Cretaceous was expected to be a key period for Lepidoptera, similar to many other phytophagous insect groups (Grimaldi, 1999; Moreau et al., 2006; Hunt et al., 2007; Yao et al., 2012; Liu et al., 2019).
SUPPORTING INFORMATION
Additional Supporting Information may be found in the online version of this article at the publisher’s web-site
Figure S1. Phylogenetic tree inferred from the Bayesian inference (BI) and maximum likelihood (ML) based on the PCG dataset. Support values above/near branches are for BI and ML trees, respectively; ‘-’ indicates this node not present in corresponding trees.
Figure S2. Phylogenetic tree inferred from the Bayesian inference (BI) and maximum-likelihood (ML) based on the PCGRNA dataset. Support values above/near branches are for BI and ML trees, respectively; ‘-’ indicates this node not present in corresponding trees.
Figure S3. Phylogenetic tree inferred from the Bayesian inference (BI) and maximum likelihood (ML) based on the PCG12RNA dataset. Support values above/near branches are for BI and ML trees, respectively; ‘-’ indicates this node not present in corresponding trees.
Figure S4. Phylogenetic tree inferred from the Bayesian inference (BI) and maximum likelihood (ML) based on the PCGAA dataset. Support values above/near branches are for BI and ML trees, respectively; ‘-’ indicates this node not present in corresponding trees.
Figure S5. Ancestral state reconstruction of the tRNA gene arrangement (trnQ- trnM -trnI, trnI-trnQ-trnM, trnQ-trnI-trnM and trnM-trnI-trnQ) in Lepidoptera under parsimony optimization using phylogenetic trees from Bayesian analysis of the PCGRNA dataset. Pie charts on nodes represent the possibility of reconstructed competing character states.
Figure S6. Ancestral state reconstruction of the tRNA gene arrangement (trnP-trnT and trnT-trnP) in Lepidoptera under parsimony optimization using phylogenetic trees from Bayesian analysis of the PCGRNA dataset. Pie charts on nodes represent the possibility of reconstructed competing character states.
Table S1. The voucher information of the specimens with mitochondrial genome sequenced in this study.
Table S2. List of taxa used for the phylogenetic analysis in this study.
ACKNOWLEDGEMENTS
The authors thank Dr Hou-Shuai Wang (South China Agricultural University, China), Miss Min Deng and Mr Bin Chen (Hunan Agricultural University, China) for their kind help in collecting the samples. This study was supported by the National Natural Science Foundation of China (31970450, 32111540167) and China Agriculture Research System (CARS-23-C08).
AUTHOR CONTRIBUTIONS
Xing Wang: data collection, conceived and designed the study, methodology, funding acquisition, review and editing. Cheng-Qing Liao: data collection, data analysis, visualization, conceived and designed the study, writing original draft. Sadahisa Yagi and Min Wang: data collection, review and editing. Lu Chen: data collection, data analysis. Qi Chen: data analysis. Toshiya Hirowatari: data collection, review and editing. Guo-Hua Huang: data collection, conceived and designed the study, methodology, supervision, funding acquisition, review and editing. All authors have read and agreed to the published version of the manuscript.
CONFLICT OF INTEREST
The authors declare that they have no known competing financial interests or personal relationships that could have appeared to influence the work reported in this paper.
DATA AVAILABILITY
The data that support the findings of this study are available from the corresponding author, G.H. Huang, upon reasonable request.
