


Abstract
This paper provides an overview of research on out-of-pocket health expenditures by reviewing the various summary measures and the results of multi-country studies using these measures. The paper presents estimates for 146 countries from all World Bank income groups for all summary measures, along with correlations between the summary measures and macroeconomic and health system indicators. Large differences emerge across countries in per capita out-of-pocket expenditures in 2011 international dollars, driven in large part by differences in per capita income and the share of GDP spent on health. The two measures of dispersion or risk—the coefficient of variation and Q90/Q50—are only weakly correlated across countries and not explained by our macroeconomic and health system indicators. Considerable variation emerges in the out-of-pocket health expenditure budget share, which is highly correlated with the incidence of “catastrophic expenditures”. Out-of-pocket expenditures tend to be regressive and catastrophic expenditures tend to be concentrated among the poor when expenditures are assessed relative to income, while expenditures tend to be progressive and catastrophic expenditures tend to be concentrated among the rich when expenditures are assessed relative to consumption. At the extreme poverty line of $1.90-a-day, most impoverishment due to out-of-pocket expenditures occurs among low-income countries.
Introduction
Health care is different from other budget items in several key ways (cf. Arrow 1963); for example its consumption is irregular and unpredictable. This reflects the fact that curative health care is valuable only in the event of illness, the timing and nature of which is substantially beyond the control of the individual, and the onset of which can carry an appreciable risk of physical impairment if not death. The consumption of health care can involve pain and discomfort; moreover, at best it allows the individual to restore her utility to its level prior to the illness. The consequent reduction in expenditure on other budget items—whether in the current period or in other periods—is therefore associated with a reduction in welfare rather than an increase, as is the case with other goods and services.
This is not to say that out-of-pocket expenditures are a fixture. People with the same health condition may end up spending different amounts for a variety of reasons: their insurance coverage may differ; some may also have other health conditions that may affect the treatment they need; people will vary in what they can afford to pay out-of-pocket, so some may not receive all the health care they need; and some may receive (and pay for) unnecessary care, unaware that it is medically unnecessary. This means that the amount someone pays out-of-pocket for health care is a poor proxy for the health improvement associated with it. But it does not negate the fact that the health event triggering the treatment was beyond the individual's control and at best the treatment returns the individual to their previous health and utility, rather than raising it above its initial levels.
There are two implications of these special characteristics of out-of-pocket health expenditures. First, in studies of inequality and poverty, out-of-pocket health expenditures by households should not be viewed as counting towards welfare. As Deaton and Zaidi (2002) put it, “By including health expenditures for someone who has fallen sick, we register an increase in welfare when, in fact, the opposite has occurred.”1,2 Second, since the amount that people pay out-of-pocket for health care is not a fixture but can be influenced by public policy (e.g., through health insurance and provider-payment arrangements), policymakers are naturally interested in how much households spend out-of-pocket for health care—both in absolute terms and in relation to a household's overall budget.3 This interest is reflected in the fact that the United Nations Sustainable Development Goals (UN SDGs) now include an indicator capturing out-of-pocket health expenditures relative to a family's means (i.e., Indicator 3.8.2).
In this paper, we do four things. First, we summarize the measures used in previous studies of out-of-pocket health expenditures. These include (i) expenditure in absolute (international dollar) terms; (ii) measures of dispersion (or risk); (iii) the out-of-pocket budget share; (iv) progressivity; (v) the incidence of “catastrophic” expenditures; (vi) inequality in the incidence of catastrophic expenditures; (vii) the incidence of “impoverishing” out-of-pocket expenditures, as well as the addition to the poverty gap due to out-of-pocket expenditures. We highlight how and why some of these measures are sensitive to the choice of consumption rather than income as the measure of a family's means. Second, we review the findings of multi-country and global studies of out-of-pocket health expenditures. These studies are relatively few and have typically used just one or two of the abovementioned measures. Third, in part to help guide future research but also to set the stage for our new empirical results presented below, we highlight the challenges faced by researchers in this area. These include identifying and accessing relevant household surveys, choosing between different adaptations of these surveys, computing out-of-pocket expenditures, and computing consumption and income. Finally, we present new estimates of out-of-pocket health expenditures for 146 countries. Our estimates cover more countries than previous global studies (133 countries), and in contrast to previous multi-country and global studies, where typically just one or two measures are used, we report estimates for all measures used in previous studies. We also explore the implications for 48 countries of choosing consumption rather than income as the measure of a family's means, and present multiple regression results showing the macroeconomic and health system (partial) correlates of the various measures.
Previous Studies of Out-of-Pocket Health Expenditures
A large body of literature exists on out-of-pocket health expenditures. This section summarizes this literature, beginning with an overview of the indicators used, and then moving on to the results of the literature to date, focusing on multi-country and global studies.4
Indicators and Caveats
Table 1 lists the different indicators used in the studies to date. The first simply asks how much households spend per capita (in international dollars) on out-of-pocket health expenses. This number is sometimes reported in single-country studies (see e.g., Banthin, Cunningham, and Bernard 2008), usually based on data from international databases like the OECD's Systems of Health Accounts (SHA) and the World Health Organization's (WHO) Global Health Expenditure Database (GHED). The second set of indicators focus on dispersion, that is, the coefficient of variation (the ratio of standard deviation to the mean) and Q90/Q50 (the ratio of health expenditure of the 90th percentile to the median). Gruber and Levy (2009), who first used these indicators to analyze out-of-pocket health expenditures, interpret both as proxies for health care expenditure risk, but acknowledge they are only proxies and do not properly capture ex ante risk. None of the above-mentioned indicators relate out-of-pocket expenditures to a household's consumption or income. The third indicator—the out-of-pocket health expenditure budget share—does this. This does not tell us, however, whether the budget share varies with a household's income or consumption. The fourth measure—progressivity, measured most commonly using Kakwani's (1977) index—gets at this by telling us whether the budget share is larger for poorer households (out-of-pocket expenditures are regressive) or smaller (out-of-pocket expenditures are progressive). Nor does the budget share measure tell us whether some households spend a particularly large fraction of their income or consumption on out-of-pocket health expenses. The fifth measure—the catastrophic expenditure indicator—does this by relating out-of-pocket expenditures to the total resources a household has available to it: if the ratio is above a certain threshold (e.g., 10%), out-of-pocket expenditures are considered to be catastrophic. The sixth measure—the concentration index for catastrophic expenditures—gets at the issue of whether the likelihood of incurring catastrophic health expenditures differs between poorer and richer households. None of the above-mentioned measures tell us whether households experienced absolute financial hardship as a result of incurring out-of-pocket health expenditures. The seventh and final measure—impoverishment—gets at this by telling us whether out-of-pocket expenditures make the difference between a household being above the poverty line or below it. There are, in fact, two impoverishment indicators: the impoverishment headcount (the addition to the poverty headcount due to out-of-pocket expenditures pushing households below the poverty line), and the addition to the per capita poverty gap due to out-of-pocket health expenditures.
Concepts and Indicators Used in Studies of Out-of-Pocket Health Expenditures
| Concept | Indicator | Interpretation | Study introducing the indicator | Comments | |
|---|---|---|---|---|---|
| 1 | Expenditure in absolute terms | Per capita annual out-of-pocket expenditures in monetary terms. | Absolute amount of expenditure per capita, adjusted for inflation and in international studies converted to a common currency. | Multiple studies in the United States report trends in per capita out-of-pocket expenditures in dollar terms (see, e.g., Banthin, Cunningham, and Bernard 2008). | |
| 2 | Dispersion (risk) | Coefficient of variation (CV) | Both interpreted as measures of out-of-pocket expenditure risk. | Gruber and Levy (2009) | Gruber and Levy actually use the variance, but this is not invariant with respect to the mean, quadrupling when everyone's out-of-pocket expenditures double (cf., e.g., Cowell 2011) |
| Q90/Q50. The ratio of the expenditures incurred by households at the 90th and 50th percentiles of the out-of-pocket expenditure distribution. | Gruber and Levy (2009) | Q90/Q50 is undefined if Q50 = 0. | |||
| 3 | Budget share | Budget share | Share of income or consumption spent on out-of-pocket health expenses. | ||
| 4 | Progressivity | Kakwani's (1977) index of progressivity (applied to out-of-pocket expenditures) is equal to twice the area between the Lorenz curve for income and the concentration curve for out-of-pocket expenditures, where the latter plots the cumulative share of out-of-pocket expenditures against the cumulative share of the population ranked by income, starting with the poorest. Equivalently, it is equal to the concentration index for out-of-pocket expenditures minus the Gini coefficient for income or consumption, where the concentration index is defined analogously to the Gini coefficient but with respect to the concentration curve for out-of-pocket expenditures, not the Lorenz curve for income.a | A negative value of Kakwani's index indicates that out-of-pocket expenditures are regressive, or equivalently, that the budget share declines with income or consumption. | Wagstaff et al. (1992) | Wagstaff et al. also compute progressivity indices for other financing sources, for example, social health insurance contributions, etc. They also use Suits’ (1977) progressivity index. |
| 5 | Catastrophic expenditures | CATA | Fraction of households whose out-of-pocket health expenditures exceed some pre-specified threshold (e.g. 10% or 25%) of their total income of consumption. | Berki (1986) and Wyszewianski (1986) | CATA (10%) is UN SDG indicator 3.8.2. Wagstaff and van Doorslaer (2003) add a variation that captures the “overshoot” of expenditures above the threshold, not just whether the threshold is exceeded. |
| 6 | Inequality in incidence of catastrophic expenditures | Concentration index (CI) of catastrophic expenditures – CI (CATA) | A negative value indicates catastrophic expenditures are more common among those at the bottom of the income or consumption distribution. | Wagstaff and van Doorslaer (2003) | |
| 7 | Impoverishment | The increase in the poverty headcount and mean poverty gap when out-of-pocket expenditures are subtracted from income or consumption – IMPOV. | Out-of-pocket expenditures are said to be “impoverishing” if they are sufficiently large to leave a household below the poverty line based on consumption or income net of out-of-pocket expenditures but above the poverty based on consumption or income gross of out-of-pocket expenditures. | Wagstaff and van Doorslaer (2003) |
Source: Authors.
Note: aThe concentration index is twice the area between the Lorenz curve for income and the concentration curve for taxes or payments, while the Gini coefficient is equal to twice the area between the Lorenz curve and the line of equality. The Lorenz curve is formed by ranking households by their income and plotting the cumulative percentage of households so ranked on the x-axis against the cumulative percent of income on the y-axis. The concentration curve is formed by keeping households ranked by their income and plotting the cumulative percentage of households so ranked on the x-axis against the cumulative percent of taxes or payments on the y-axis.
The above measures make sense if the household has a fixed income in each period and cannot borrow or save. In this case, the household relies on its current-period income to finance its out-of-pocket expenditures, and its nonmedical consumption falls by the full amount of the out-of-pocket expenditures. But if the household does have savings to draw on, or it can borrow, its consumption will fall by less than the amount of the out-of-pocket expenditures, and its gross consumption (the sum of its medical and nonmedical expenditures) will overstate what its consumption would have been in the absence of the health event (its “counterfactual” or “normal” consumption; Wagstaff 2019). If we fail to take this into account, we will overestimate the incidence of catastrophic and impoverishing expenditures (Flores et al. 2008). We will also overestimate progressivity and the extent to which catastrophic expenditures are higher among the better off, because households experiencing a health event are further up the “gross” consumption distribution than they are up the “normal” consumption distribution.
Income may also be affected by a health event, so reported income may be different from its counterfactual or normal value. The income of the person experiencing the health event may fall, as may the income of other household members, for example, a caregiver. Such households will appear further down the “reported” income distribution than the “counterfactual” or “normal” income distribution. So, if we rank households by reported income rather than by normal income, we will find out-of-pocket expenditures less concentrated among the better off, and therefore less progressive (and possibly even regressive). We will also find catastrophic expenditures to be less concentrated among the “better off”; indeed, quite possibly, we will find them higher among the “poor”.
Unfortunately, only very few surveys include the necessary information on saving and borrowing for health purposes that allow one to adjust for financing out-of-pocket expenditures through dissaving and borrowing. Rarely do surveys ask respondents in a household that has experienced or is experiencing sickness how their current income compares to their prior or normal income. So the observations above really serve to remind us that our estimates likely deviate from those we would obtain if we had the necessary data to relate out-of-pocket expenditures to “normal” consumption and “normal” income.
Previous Studies
Table 2 reports the results of previous multi-country and global studies. There have been no regional or global studies to date on the dispersion of out-of-pocket expenditures or on the out-of-pocket budget share, and there have been no global studies to date on per capita expenditures in dollar terms, progressivity, or inequality in catastrophic expenditures. Moreover, the scope of the regional studies on per capita expenditures, progressivity, and inequality in catastrophic expenditures has been limited to the OECD countries in the case of the first two measures, and Asia in the case of the third. There have been global studies on catastrophic and impoverishing out-of-pocket expenditures, including two recent large-scale studies. The work reported in this paper on these measures extends these previous studies in a number of ways (e.g., we include more recent datapoints, we use the new updated international poverty lines, and we compare results using income and consumption) but we limit our analysis to the most recent datapoint for each country, and unlike the two recent studies do not report trends.
Previous Studies of Out-of-Pocket Health Expenditures
| Concept | Multi-country studies | Global studies | |
|---|---|---|---|
| 1 | Expenditure in absolute terms | Squires (2011) compares 12 OECD countries in terms of, inter alia, per capita out-of-pocket expenditure in USD, using data from the OECD's Health Data database. The author finds that Switzerland and the United States have the largest per capita out-of-pocket expenditures on health, and France and the United Kingdom the smallest. | None |
| 2 | Dispersion (risk) | None | None |
| 3 | Budget share | None | None |
| 4 | Progressivity | Wagstaff et al. (1992, 1999) report the progressivity of out-of-pocket expenditures (and other financing sources) in 10 and 12 OECD countries; the second study also analyzes trends. Out-of-pocket expenditures emerge as regressive for all countries and years, except in Spain in 1980, and the trend is towards greater regressiveness. | None |
| 5 | Catastrophic expenditures | Van Doorslaer et al. (2007) look at catastrophic spending in 10 Asian territories. These authors find relatively low rates in Malaysia, Sri Lanka, and Thailand, and relatively high rates in China, Vietnam, and Bangladesh.Wagstaff et al. (2015) look at levels of and trends in catastrophic out-of-pocket expenses at the 25% threshold in several Latin American countries, reporting a downward trend.Wagstaff et al. (2016) look at levels of and trends in catastrophic out-of-pocket expenses at the 25% threshold in several countries that have implemented “universal health coverage” reforms, finding improvements in some countries but not all. | Xu et al. (2003, 2007) analyze catastrophic expenditures in 89 countries, defining catastrophic as out-of-pocket expenditures exceeding 40% of consumption less a deduction for food costs. These authors reported mean and median rates of catastrophic spending, so defined, of 2.3% and 1.5%, respectively.Wagstaff et al. (2018b) report results for 133 countries across the world, many for multiple years. These authors estimate the mean and median catastrophic out-of-pocket payment rates at the 10% threshold to be 9.2% and 7.1%. They report a positive population-weighted median annual rate of change of catastrophic payment incidence whatever catastrophic payment incidence measure is used. |
| 6 | Inequality in incidence of catastrophic expenditures | Van Doorslaer et al. (2007) look at the distribution by gross consumption of those experiencing catastrophic payments in 10 Asian territories. For the most part, they find that catastrophic spending is higher among the better off. Taiwan is the exception: catastrophic spending is concentrated among the poor whatever the threshold. | None |
| Wagstaff et al. (2015, 2016) take into account inequality in catastrophic expenditures in their measure of universal health coverage but do not report the degree of inequality. | |||
| 7 | Impoverishment | Van Doorslaer et al. (2006) use data from 11 Asian economies to compute “gross” and “net” poverty headcounts and poverty gaps using the World Bank's dollar-a-day poverty line (as well as its $2-a-day poverty line). These authors find that the dollar-a-day poverty headcount is, on average, almost three percentage points higher after deducting out-of-pocket spending from household consumption. In Bangladesh and India, the difference is almost four percentage points. In Malaysia and Sri Lanka, by contrast, the difference is just 0.1 and 0.3 percentage points, respectively.Alam et al. (2005) compare “gross” and “net” poverty headcounts in 10 countries in Eastern Europe and the Former Soviet Union using a $2.15-a-day poverty line at 2000 prices and purchasing power parities. On average, out-of-pocket payments raise the poverty headcount by two percentage points, with Armenia (3.4), Georgia (3.6), and Tajikistan (3.3) recording the highest percentage point increases. | Xu et al. (2007) analyze impoverishing out-of-pocket expenditures in 89 countries defining a household as poor if its consumption fell short of an allowance for food costs.a These authors estimated that globally 1.7% of the population fell into poverty, so defined, because of out-of-pocket health spending, with 90% of those people living in low-income countries.Wagstaff et al. (2018c) report rates of impoverishment in 122 countries (many for several years) using the $1.90-a-day and $3.10-a-day poverty lines as well as a relative poverty line equal to 50% of median consumption. These authors find population-weighted median rates of impoverishment of 1.86% at the $1.90-a-day line, 2.44% at the $3.10-a-day line, and 1.83% at the relative poverty line. Across countries, the population-weighted median annual rate of change of impoverishment is negative at the $1.90-a-day line but positive at the $3.10-a-day and relative poverty lines. They estimate the population-weighted median of the poverty gap increase attributable to out-of-pocket health expenditures to be U.S. $1.22 per capita at the $1.90-a-day line and U.S. $3.74 per capita at the $3.10-a-day line. |
| Wagstaff et al. (2015) look at levels of and trends in impoverishment at the $2-a-day poverty line in several Latin American countries, finding a downward trend.Wagstaff et al. (2016) look at levels of and trends in impoverishment at the $2-a-day poverty line in several countries that have implemented “universal health coverage” reforms, finding improvements in some countries but not all. |
Source: Authors.
Note: aThe deduction was set equal to average food spending among households whose food spending share (as a percentage of total consumption) was in the 45th to 55th percentile range, the assumption being that, at least in low- and middle-income countries, the food intake of this group averages 2,000 kilocalories.
Challenges in Studies of Out-of-Pocket Health Expenditures
Researchers analyzing out-of-pocket health expenditures face several challenges. In this section we review the key ones, in part to help guide future research but also to set the stage for the empirical results presented below. Some are difficult if not impossible to address, such as the inherent differences in the surveys, while others such as computation are easy to harmonize.
Surveys
Computing the measures in table 1 requires microdata from nationally-representative household surveys that contain data on out-of-pocket health expenditures as well as total household consumption or income.5 An invaluable resource for identifying and exploring access to potentially suitable surveys is a microdata catalog such as those maintained by the International Household Survey Network and the World Bank. These catalogs include “standalone” surveys as well as survey “collections”—see figure 1.
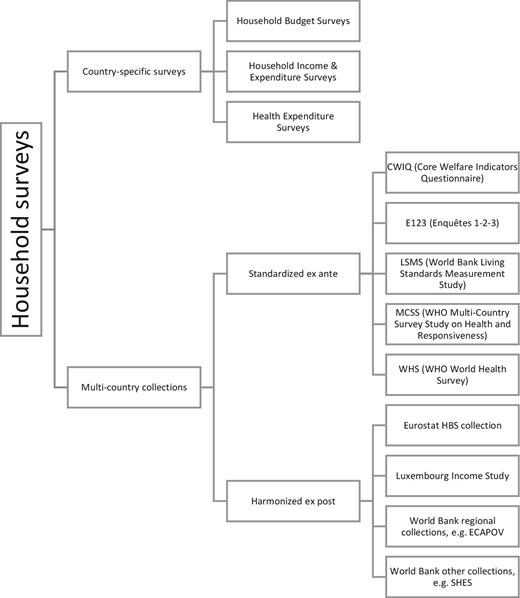
Types of Household Survey Datasets Used in Analysis of Out-of-pocket Health Expenditures
Source: Authors.
The standalone category includes country-specific household surveys such as a Household Budget Survey (HBS) or a Household Income and Expenditure Survey (HIES; their scope is typically rather similar). Some countries also have a dedicated survey capturing health expenditures and other health-related concerns: the United States, for example, has a Medical Expenditure Panel Survey. Access to the microdata from these standalone surveys tends to vary. Some countries provide authorized users with access to the microdata, though in many cases the public-release microdata are modified to ensure respondent anonymity. Countries also vary in their policies on who may access the microdata and how: OECD countries like Ireland, the United Kingdom and the United States have very liberal policies, as do several middle-income countries, like Peru and South Africa, allowing any bona-fide researcher to download the public-release microdata. By contrast, many OECD countries have much tighter access policies, for example, authorizing only nationals of the country access to the data, and sometimes requiring the user access the data on-site.
The other category in figure 1 covers multi-country survey collections. These are of two types. The first are genuine multi-country surveys—surveys where there is a fairly standardized questionnaire used in several countries. The World Bank's Living Standards Measurement Study (LSMS) is an example. The WHO's World Health Survey (WHS) is another. The former is a multipurpose survey with rich information on household consumption and expenditure across a range of areas, including health, while the latter is a health survey with extensive information on out-of-pocket health expenditures but only very limited information on other expenditures. Access rules to these multi-country datasets vary, sometimes (e.g., the LSMS) varying even across surveys within a collection depending on permissions granted by the relevant government.
The second type of multi-country survey collection consists of country-specific surveys where the questionnaires differ across countries but the data have been harmonized ex post by an agency, such as Eurostat, the Luxembourg Income Study (LIS; Luxembourg Income Study 2019), or the World Bank. Indeed, every five years Eurostat takes the raw data from the HBS surveys of the European Union member states and produces a harmonized dataset for each country with the same constructed harmonized expenditure variables, including out-of-pocket health expenditures. The LIS also produces harmonized datasets based on HBS and HIES surveys for a wide range of countries; some of these have harmonized data on out-of-pocket health expenditures. In both cases, authorized users are able to use only the dataset comprising the harmonized variables, not the original data. Several groups within the World Bank also construct harmonized datasets. In the regional World Bank units, the focus is on overall household consumption, the aim being to assist the Bank's poverty-monitoring work; in this work, the methods used to construct consumption aggregates in the LSMS (Deaton and Zaidi 2002) typically guide the process. Other groups in the World Bank have goals other than facilitating poverty-monitoring. One harmonization exercise (the Standardized Household Expenditure Survey; SHES) is directed at assisting the process of constructing purchasing power parities (PPPs), and the process of constructing expenditure totals and subtotals is guided by the UN's Classification of Individual Consumption According to Purpose (COICOP) classification system. In both exercises, the various components of consumption—including out-of-pocket health expenditures—are also distributed along with the consumption aggregate. Often, the original microdata (or parts of the microdata) are also made available to authorized users (typically World Bank staff), which allows for validation, where possible, of different methods to estimate out-of-pocket health expenditures, which can then be related to a standardized consumption aggregate.
Some country-specific surveys can appear in multiple (harmonized) multi-country collections. France's HBS, for example, has been harmonized by both Eurostat and the LIS. Peru's ENAHO survey has been harmonized by both the LIS and the World Bank's SHES exercise. Romania's HBS has been harmonized by Eurostat and the World Bank's Europe and Central Asia harmonized collection (ECAPOV). These multiple adaptations provide additional opportunities for data-validation, but also highlight the potential for obtaining different results depending on which adaptation one uses.
The studies to date summarized in table 2 have mostly used standalone surveys. The exceptions are the studies by Wagstaff et al. (2018b, c) —these use standalone surveys and surveys from several collections. Often, the authors sifted through alternative estimates (e.g., of catastrophic expenditures) for a particular country and year, using external checks to choose between them.
Measuring Out-of-Pocket Spending
Household surveys vary in how (and indeed whether) they inquire about out-of-pocket health expenditures. This poses challenges for comparisons across countries, and over time within the same country.
First, not all surveys are clear about whether the spending reported is gross or net of any reimbursement by a health insurer, and even when it is clear, the amount reimbursed may not be known at the time of the survey, making it impossible to correct for over-reporting. Second, surveys likely vary in their comprehensiveness. This is likely linked to the fact that surveys vary in the number of items they inquire about. Some surveys also have an open-ended number of health expenditure items. Exploiting the fact that the WHS enquired about out-of-pocket expenditure in two ways, Lu et al. (2009) find that use of the single-item question leads to a smaller estimate of out-of-pocket expenditure than the survey's multi-item question. Third, surveys vary in their recall periods, sometimes using recall periods for infrequent items—for example, inpatient care—that are likely to be inappropriately short (e.g., three months) and recall periods for frequent items—for example, medicines—that are likely to be inappropriately long (e.g., 12 months). On one hand, a household might find it difficult to remember spending that occurred long ago. But shorter recall periods are subject to the “telescoping” effect by which health expenditures are compressed into a shorter time to fit the recall period (Beegle et al. 2012). Exploiting the two recall periods for inpatient care in the WHS, Lu et al. (2009) find that the four-week recall period leads to a larger (annualized) estimate of out-of-pocket spending than the 12-month recall period. Fourth, surveys vary in how they collect out-of-pocket expenditure data. Sometimes, the data are collected in the expenditure section, and the respondent is asked to provide information on the household's total out-of-pocket expenditures for a specific item. In other cases, the data are collected in the health section, and the respondent is asked to go through each household member in turn and report the household member's expenditures for the specific item. In some surveys, out-of-pocket expenditures are collected in both sections. The choice of which approach to use may well affect the reliability of results and the comprehensiveness of out-of-pocket expenditures (the expenditure section approach may capture expenditures associated with recently deceased household members).6 Fifth, different adaptations of a survey may have different values of the out-of-pocket expenditure variable or variables. For example, the out-of-pocket health expenditure variables in the U.S. public-release Consumer Expenditure Survey data are top-coded.
Measuring Consumption and Income
A consumption aggregate should capture consumption across a broad range of categories, should capture home-produced food and other items, and should also capture the use value of durables (Deaton and Zaidi 2002). Housing should also be included, measured by the value of the flow of services that the household receives from occupying its dwelling (Balcazar et al. 2014). An income aggregate should capture both wage and nonwage income, wage income including earnings from dependent activities, and nonwage income capturing all other income including household crop and livestock production, self-employment earnings, and transfer income (Carletto et al. 2007). While in the past it was unusual to find income aggregates for developing-country household surveys, this is changing (Davis, Di Giuseppe, and Zezza 2017). It still remains the case, however, that consumption provides a broader measure of a household's living standards than income. Constructing consumption and income aggregates is a lengthy process, especially if they are to be constructed in a way that is similar across datasets. Using pre-constructed aggregates is therefore very attractive, whether via ex post harmonized surveys or via other surveys where aggregates have been constructed.
Additional Data Needs
Additional data elements include the thresholds—the catastrophic expenditure threshold, and the poverty line. Typical thresholds for consumption and income are 5%, 10%, 15%, 20%, and 25%; the UN SDG (3.8.2) is 10%. Sometimes out-of-pocket expenditure is related to consumption net of a deduction for food costs, but this practice is ill-advised, as it makes it hard to interpret the resultant incidence rates (Wagstaff 2019). Obvious poverty lines in multi-country studies are the family of international poverty lines (Jolliffe and Prydz 2016; Ferreira and Sanchez 2017). These require that consumption or income be converted in the unit used for the poverty line. The World Bank uses poverty lines in international dollars, so expenditures have to be converted to 2011 prices using the country's consumer price index (CPI) and then into 2011 international (PPP) dollars. The International Comparison Program is an important source of data on PPPs; CPI and PPP series are available from the World Bank and IMF databases.
Computation
The computation of the first two measures—expenditure in absolute terms and dispersion—is straightforward, the only complication being that Q90/Q50 is undefined if median out-of-pocket expenditures is zero, which is quite possible. The computation of the budget share is also straightforward, the only complication being what to do if the denominator is negative, which is possible if it is household income. Progressivity is easily computed as the difference between the Gini coefficient (for income or consumption) and the concentration index for out-of-pocket expenditures, both of which can be computed straightforwardly in Stata using any user-developed module that computes inequality measures such as CONINDEX for Stata (O'Donnell et al. 2015) and INEQ for R (Zeileis and Kleiber 2014). The incidence of and inequality in catastrophic expenditures can both be computed using the Stata module FPRO (Eozenou and Wagstaff 2018), as can the headcount- and poverty gap-based measures of impoverishment. Further guidance on the computation issues is provided in O'Donnell et al. (2008).
New Global Estimates of Out-of-Pocket Health Expenditures—Data
In the rest of the paper we present new global estimates of out-of-pocket health expenditures for each of the measures listed in table 1. In this section, we present details of the data we use.
Our data are drawn from the 2019 version of the World Bank's publicly available Health Equity and Financial Protection Indicators (HEFPI) database (Wagstaff et al. 2018a, 2019).7 In generating the database, we identified potentially suitable surveys by searching the above-mentioned microdata catalogs and multi-country survey collections. In some cases, the surveys were not accessible to us. In others, the data were accessible but the surveys turned out to lack key information. Sometimes the datasets we analyzed were different adaptations of the same survey—for example, as mentioned above, Romania's HBS has been harmonized by Eurostat and the World Bank's ECAPOV exercise. We identified 1,948 potentially suitable surveys or adaptations thereof from 182 countries. We analyzed and obtained out-of-pocket expenditure estimates for 1,000 of these surveys, covering 154 countries.
Our out-of-pocket expenditure estimates vary in how they are computed. In some cases, the survey asks only in the consumption or expenditure section about out-of-pocket spending. In other cases, the expenditure questions are in the health section. In some cases, some items are asked about in one section, for example, the expenditure section, and other items are asked about in the other, for example, the health section. We have used as much information as possible, and where the recall period is less than 12 months, we have annualized by multiplying the amount recorded by a time-neutral annualization factor (i.e., 12 in the case of a one-month recall, by two in the case of a six-month recall, and so on). Some surveys asked about all items of health expenditures in both the expenditure and health section. In these cases, we used whichever section had the longer recall period—usually the expenditure section—since we suspect that short recalls combined with a time-neutral annualization factor leads, on balance, to an overestimate of annual health expenditures. Where explicitly mentioned in the questionnaire, we included spending on chronic as well as on acute conditions.
It is also possible that total household consumption may also vary across surveys, since we mostly used pre-constructed aggregates. In particular, the consumption aggregates may not always follow the “gold standard” rules concerning imputation of household durables and housing. Where we were able to choose between different adaptations of the same survey (and where available) we chose adaptations where we felt confident the “gold standard” rules were likely to have been followed.
We mostly relate out-of-pocket health expenditures either to total household consumption (in low- and middle-income countries) or to income (in high-income countries). Increasingly, surveys try to collect data on both, but it is still the case that income is typically not available for low- and middle-income countries. Where we can, we show how some indicators change as we move from consumption to income.
In the catastrophic expenditure analysis, we use thresholds of 10% and 25%. In the impoverishment analysis, we use the $1.90-a-day, $3.20-a-day, and $5.50-a-day international poverty lines (IPLs; Jolliffe and Prydz 2016; Ferreira and Sanchez 2017), as well as a $10.00-a-day line, which may be better thought of as a global low-income line rather than a poverty line per se (Kochhar 2015). In converting our health expenditure data to international dollars, and in deriving the IPLs, we convert values in different years to 2011 values using local CPIs and LCUs to international dollars using 2011 PPPs.
We checked the numbers underlying our estimates against published numbers. We checked our estimated consumption-per-capita estimates against the numbers in the World Bank's PovcalNet when available, and those in the World Development Indicators (WDI) when not; large discrepancies were flagged.8 We checked our household health budget share against numbers from the WDI which are based on data from the WHO Global Health Expenditure Database; again, large discrepancies were flagged.9 Last, we checked our $1.90-a-day poverty headcount estimates against the numbers in PovcalNet, flagging large discrepancies.10 Estimates of catastrophic and impoverishing expenditure incidence were not automatically rejected when flags were raised, but our tendency was to prefer estimates where flags were not raised, and we typically only retained datapoints where the flag was only marginally up. This quality control process led to many datapoints being dropped, and some entire survey families.11
In our database, many countries have series from multiple surveys or at least multiple adaptions of a survey. For any given year for any given country, we retained at most only one estimate of each measure, using the same survey for each measure. We preferred consistent data series, preferring the same survey and the same adaptation of it. In some cases, we had no choice but to switch survey, for example, because a survey was discontinued or because we had limited access to the surveys. After excluding datapoints on quality grounds, and after selecting among the remaining datapoints, we retained 612 of the 1,000 surveys, covering 146 of the 154 countries. The estimates presented below are for the latest year for which we have data; country-level trends will be analyzed in a future paper.
New Global Estimates of Out-of-Pocket Health Expenditures—Results
In this section we present our new global estimates of out-of-pocket health spending using the measures in table 1. We use maps to show the international variation in our measures and, for selected measures, tables showing the means by region and World Bank income group. In addition, to shed light on the sources of international variation in our measures, we present the results of multiple regressions that show the correlations between each of our measures and selected macroeconomic and health system variables.12 We discuss the charts and regressions results below, going through the measures in table 1 in turn.
Expenditure in Absolute Terms
The top left map in figure 2 shows per capita out-of-pocket health expenditures in 2011 international dollars for the latest year for which we have survey data. These numbers, it should be reiterated, are based entirely on our estimates from household surveys. The numbers contrast with estimates presented in international health accounts databases, which are sometimes interpolations between datapoints, and sometimes estimated from non-survey sources such as user fees revenues reported by providers; the latter are not always reliable, with providers often reporting less than households say in surveys they spent (see, e.g., Lieberman and Wagstaff 2009).
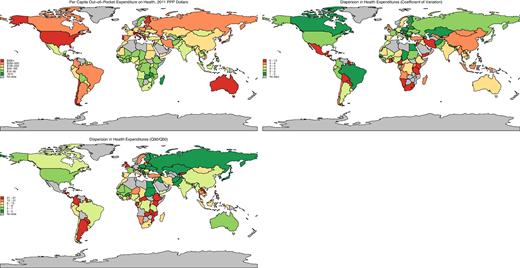
Mean per Capita Out-of-pocket Expenditure and Dispersion
Source: Authors’ calculations using data in World Bank's Health Equity and Financial Protection Indicators database. Note: Top-left chart shows per capita out-of-pocket health expenditures in 2011 PPP dollars. The remaining charts show the dispersion in out-of-pocket health expenditures. In the top-right chart, dispersion is measured using the coefficient of variation, while in the bottom-left chart it is measured as the ratio of expenditures at the 90th and 50th percentiles.
The map reveals large differences across countries. Tables 3 and 4 suggest that the differences are driven in large part by international differences in per capita income. High-income countries tend to spend more out-of-pocket than poorer ones.13Table 3 also reveals differences across regions, even within income groups. Among the high-income countries, per capita out-of-pocket expenditures range from Sweden's $32 to Switzerland's $1,200. Among the low-income countries, expenditures range from Madagascar's $6 to over $100 in Cambodia, Haiti, and Nepal. The regression results in table 4 suggest that larger per capita out-of-pocket expenditures are also positively correlated with the share of GDP spent on health, and negatively correlated with the share of THE channeled through government financing “schemes” (like the UK's National Health Service) and nonprofit schemes.14
Median per Capita Out-of-Pocket Expenditures on Health, 2011 International Dollars, Latest Year
| Low income | Lower middle-income | Upper middle-income | High income | Total | |
|---|---|---|---|---|---|
| East Asia & Pacific | 92 | 55 | 124 | 592 | 102 |
| Europe & Central Asia | 55 | 174 | 211 | 341 | 228 |
| Latin America & Caribbean | 84 | 46 | 225 | 384 | 167 |
| Middle East & North Africa | 130 | 236 | 605 | 135 | |
| North America | 539 | 539 | |||
| South Asia | 93 | 76 | 76 | ||
| Sub-Saharan Africa | 26 | 49 | 70 | 39 | |
| Total | 32 | 68 | 171 | 435 | 122 |
Source: Authors calculations using data in World Bank's Health Equity and Financial Protection Indicators database.
Note: Table shows median per capita out-of-pocket health expenditures in 2011 PPP dollars.
Multiple Regressions Explaining International Differences in Out-of-Pocket Expenditure Measures
| OOP per cap PPP $ | CV | Q90/Q50 | Budget Share | CATA10 | Kakwani | CI CATA10 | IMPOV190 | IMPOV PG 190 | |
|---|---|---|---|---|---|---|---|---|---|
| (1) | (2) | (3) | (4) | (5) | (6) | (7) | (8) | (9) | |
| Per capita GDP 2011 int. $ | 11.042*** | −111.962 | 0.162 | 0.016 | 0.052 | −0.003* | −0.003 | −0.060*** | −0.001*** |
| (0.000) | (0.327) | (0.536) | (0.388) | (0.445) | (0.081) | (0.161) | (0.000) | (0.000) | |
| Gini index of income inequality | 0.022 | 2.043 | 0.530* | 0.010 | 0.074 | −0.001 | −0.000 | 0.004 | −0.000 |
| (0.967) | (0.844) | (0.075) | (0.382) | (0.108) | (0.554) | (0.996) | (0.496) | (0.874) | |
| Total Health Exp. (THE) as % GDP | 9.061** | 91.114 | −0.217 | 0.146** | 0.562** | −0.009** | −0.009 | −0.109** | −0.000 |
| (0.002) | (0.444) | (0.750) | (0.012) | (0.005) | (0.040) | (0.124) | (0.002) | (0.243) | |
| SHI schemes as % THE | −0.497 | 28.365 | 0.095 | −0.019** | −0.053* | −0.001* | −0.001* | −0.012** | −0.000 |
| (0.236) | (0.333) | (0.509) | (0.017) | (0.052) | (0.093) | (0.056) | (0.005) | (0.190) | |
| Govt. Financing Arrang. as % THE | −1.611*** | 2.726 | −0.012 | −0.034*** | −0.104*** | −0.001** | −0.001 | −0.008* | 0.000 |
| (0.000) | (0.540) | (0.926) | (0.000) | (0.000) | (0.025) | (0.111) | (0.095) | (0.613) | |
| Comp. PI as % THE | −3.590 | −1.758 | −0.505 | −0.042 | −0.156 | −0.007** | −0.003 | −0.039 | −0.000 |
| (0.258) | (0.950) | (0.404) | (0.313) | (0.282) | (0.035) | (0.673) | (0.151) | (0.530) | |
| Non-profit schemes as % THE | −3.568** | 21.545 | 1.005 | −0.074*** | −0.190** | −0.001 | 0.001 | −0.030** | −0.000* |
| (0.026) | (0.230) | (0.124) | (0.000) | (0.002) | (0.458) | (0.835) | (0.002) | (0.051) | |
| Vol. Schemes as % THE | −0.426 | 34.959 | −0.140 | −0.008 | −0.032 | 0.000 | 0.002 | −0.006 | −0.000 |
| (0.683) | (0.353) | (0.597) | (0.719) | (0.701) | (0.817) | (0.281) | (0.613) | (0.232) | |
| No. observations | 422 | 422 | 361 | 422 | 422 | 422 | 421 | 422 | 422 |
| R-squared | 0.750 | 0.008 | 0.087 | 0.248 | 0.244 | 0.227 | 0.254 | 0.445 | 0.278 |
| p: Soc. Sec. = Other Govt. | 0.001 | 0.345 | 0.276 | 0.019 | 0.032 | 0.597 | 0.988 | 0.213 | 0.028 |
Source: Authors.
Note: Numbers in parentheses are p-values: *p < 0.10, **p < 0.05, ***p < 0.001. OOP is out-of-pocket expenditures. PPP is purchasing power parities. CV is coefficient of variation. Q90/Q50 is the ratio of out-of-pocket expenditures of the 90th centile to the out-of-pocket expenditures of the median. CATA10 is the incidence of catastrophic expenditures using the 10% threshold, that is, the percentage of households whose out-of-pocket expenditures exceed 10% of their total consumption or income. Kakwani is the Kakwani index of progressivity, defined in table 1. CI CATA10 is the concentration index of the incidence of catastrophic expenditures and indicates the degree to which catastrophic expenditures are higher or lower among low-consumption or low-income households. IMPOV190 is the incidence of impoverishment at the $1.90-a-day poverty line, that is, the percentage of households who were poor after deducting their out-of-pocket expenditures from their consumption (or income) but would not have been poor in the absence of these expenditures. IMPOV PG 190 is the addition to the average poverty gap due to out-of-pocket expenditures and is based on a comparison of the poverty gaps with and without out-of-pocket expenditures subtracted from consumption (or income). SHI is social health insurance or (health-related) social security. See fn 12 for further details of covariates including in the regressions.
Dispersion (Risk)
Figure 2 also shows the two measures of dispersion. In countries where median per capita out-of-pocket expenditures is zero (e.g., Botswana), Q90/Q50 is undefined, so the set of countries differ across the two maps. The patterns of shading also differ, reflecting the low (albeit significant) correlation between the two dispersion measures (r = 0.154, p = 0.09). Interestingly, dispersion in out-of-pocket expenditures is sometimes high in some countries where the average amount in dollar terms is low, such as Sri Lanka and the UK. The regressions in the case of these two indicators shed very little light on the sources of cross-country differences—the R2s for the regressions are just 0.008 and 0.087, respectively. The only significant correlate is the Gini index of income inequality, which is positively correlated with the Q90/Q50 ratio. Table 5 confirms the lack of any clear pattern by income group, and while there is a hint that countries in Latin America and the Caribbean have a higher risk of out-of-pocket expenditures, this region's rank varies across income groups.
Median Values of the Q90/Q50 Dispersion Measure of Risk of Out-of-Pocket Expenditures on Health, Latest Year
| Low income | Lower middle-income | Upper middle-income | High income | Total | |
|---|---|---|---|---|---|
| East Asia & Pacific | 34 | 9 | 10 | 4 | 9 |
| Europe & Central Asia | 6 | 7 | 5 | 5 | |
| Latin America & Caribbean | 45 | 10 | 13 | 13 | 13 |
| Middle East & North Africa | 7 | 7 | 7 | 7 | |
| North America | 6 | 6 | |||
| South Asia | 5 | 7 | 6 | ||
| Sub-Saharan Africa | 9 | 8 | 12 | 10 | |
| Total | 9 | 9 | 11 | 5 | 9 |
Source: Author's calculations using data in World Bank's Health Equity and Financial Protection Indicators database. Note: Table shows dispersion of out-of-pocket health expenditures, with dispersion measured as the ratio of expenditures at the 90th and 50th percentiles.
The Out-of-Pocket Expenditure Budget Share
The first map in figure 3 shows the considerable international variation in the out-of-pocket health expenditure budget share. Table 6 shows the means by region and income group. The budget share measure has the advantage over the above-mentioned measures of relating a household's out-of-pocket expenditure to its overall consumption or income. The high-income countries—including the United States—tend to have lower out-of-pocket budget shares, though there are exceptions, including Chile, Greece, Korea, and Portugal. There are countries in all the remaining groups with shares more than 7%, notably Brazil, Egypt, Nepal, and Nicaragua. The regressions suggest the out-of-pocket budget share is higher in countries that spend a large share of their GDP on health, and lower in countries that channel more of their total health spending through social health insurance schemes, government “schemes”, and nonprofit schemes; the relationship is stronger (p < 0.05) for government schemes than for social health insurance schemes. By contrast, channeling health expenditures through private insurance (whether a compulsory or a voluntary scheme) does not reduce the out-of-pocket budget share. This may reflect a lower degree of cost control among private insurers who often use retrospective provider payment mechanisms such as fee-for-service that encourage providers to deliver more care, but may also be a statistical artefact insofar as higher rates of private insurance reflect lower levels of financial protection from government-funded schemes.
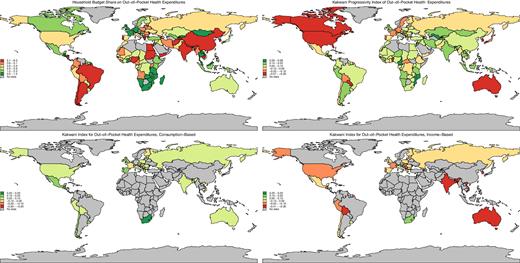
Budget Shares and Progressivity Indices for Out-of-Pocket Health Expenditures
Source: Authors’ calculations using data in World Bank's Health Equity and Financial Protection Indicators database. Note: Top-left chart shows the average household's budget share on out-of-pocket health expenditures. The remaining charts show Kakwani's progressivity index for out-of-pocket health expenditures. A negative number indicates that out-of-pocket health expenditures are regressive (i.e., absorb a larger share of a poor household's budget than of a better-off household's budget), while a positive number indicates that out-of-pocket health expenditures are progressive (i.e., absorb a smaller share of a poor household's budget than of a better-off household's budget). In the top-right chart (like the top-left chart) “budget” is based on a household's consumption in low- and middle-income countries and income in high-income countries. In the bottom-left chart, “budget” is based on a household's consumption, while in the bottom-right chart, “budget” is based on income. The two bottom charts show that out-of-pocket health expenditures are more likely to emerge as regressive if the “budget” is calculated using a household's income.
Median Budget Share for Out-of-Pocket Expenditures on Health, Latest Year
| Low income | Lower middle-income | Upper middle-income | High income | Total | |
|---|---|---|---|---|---|
| East Asia & Pacific | 4.0 | 1.7 | 3.7 | 3.1 | 2.6 |
| Europe & Central Asia | 3.7 | 3.6 | 3.8 | 2.6 | 3.2 |
| Latin America & Caribbean | 3.0 | 4.1 | 3.6 | 3.5 | 3.9 |
| Middle East & North Africa | 3.5 | 3.7 | 4.7 | 3.5 | |
| North America | 2.6 | 2.6 | |||
| South Asia | 6.4 | 3.6 | 4.7 | ||
| Sub-Saharan Africa | 2.7 | 2.7 | 2.0 | 2.6 | |
| Total | 2.8 | 3.1 | 3.4 | 2.7 | 2.9 |
Source: Authors’ calculations using data in World Bank's Health Equity and Financial Protection Indicators database. Note: Table shows median budget share for out-of-pocket health expenditures.
Progressivity
The second map in figure 4 shows the progressivity of out-of-pocket health expenditures with respect to consumption (in the case of the low- and middle-income countries) and income (in the case of the high-income countries). The two bottom maps show progressivity for both consumption and income where we can compute both. As anticipated above, out-of-pocket expenditures are less progressive when assessed relative to income rather than consumption: the median values of Kakwani's progressivity index among the 48 countries where we can compute it using both income and consumption are −0.11 (regressive) and 0.06 (progressive) for income and consumption, respectively. This difference is statistically significant (p = 0.00). We see out-of-pocket expenditures mostly emerging as regressive when assessed relative to income—especially so in Bangladesh, Bolivia, Haiti, and India for the low- and middle-income countries, and in Australia, France, and Korea for the high-income countries. Table 7 shows that in the median country in most income groups, out-of-pocket expenditures are progressive. The exception is high-income countries where in regions other than Latin America and the Caribbean, they are regressive, likely reflecting at least in part more generous insurance coverage among higher income groups in these countries. The regressions in table 4 suggest that progressivity of out-of-pocket expenditures is lower in richer countries and countries spending a large share of their GDP on health, and in countries channeling higher shares of their total health expenditures through social health insurance schemes, government “schemes” or compulsory health insurance schemes, but this is potentially misleading because in some countries progressivity is assessed relative to income, while in others it is assessed relative to consumption.
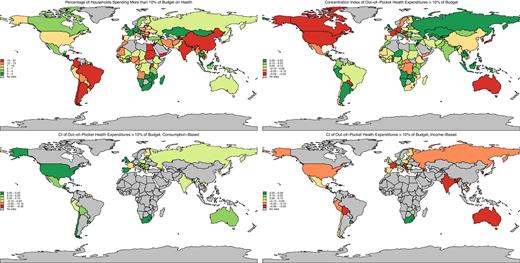
Catastrophic Health Expenditures and Their Distribution by Consumption and Income
Source: Authors’ calculations using data in World Bank's Health Equity and Financial Protection Indicators database. Note: Top-left chart shows percentage of households spending more than 10% of their budget on out-of-pocket health expenditures. The remaining charts show the concentration index (CI) for whether a household spends more than 10% of its budget on out-of-pocket health expenditures. A negative number indicates poor households are more likely to do so, while a positive number indicates that better-off households are more likely to do so. In the top-right chart (like the top-left chart) “budget” is based on a household's consumption in low- and middle-income countries and income in high-income countries. In the bottom-left chart, “budget” is based on a household's consumption while in the bottom-right chart “budget” is based on income. The two bottom charts show that large out-of-pocket expenditures as a share of a household's budget are more common among poor households if the “budget” is calculated using a household's income.
Median Progressivity Index Values for Out-of-Pocket Expenditures on Health, Latest Year
| Low income | Lower middle-income | Upper middle-income | High income | Total | |
|---|---|---|---|---|---|
| East Asia & Pacific | 0.10 | 0.17 | 0.07 | −0.18 | 0.08 |
| Europe & Central Asia | 0.17 | 0.10 | 0.07 | −0.06 | −0.01 |
| Latin America & Caribbean | 0.11 | 0.02 | 0.07 | 0.12 | 0.08 |
| Middle East & North Africa | 0.08 | 0.08 | −0.12 | 0.04 | |
| North America | −0.24 | −0.24 | |||
| South Asia | 0.05 | 0.09 | 0.07 | ||
| Sub-Saharan Africa | 0.04 | 0.04 | 0.02 | 0.04 | |
| Total | 0.05 | 0.07 | 0.07 | −0.08 | 0.04 |
Source: Authors’ calculations using data in World Bank's Health Equity and Financial Protection Indicators database.
Note: Table shows the median values of Kakwani's progressivity index for out-of-pocket health expenditures. A negative number indicates that out-of-pocket health expenditures are regressive (i.e., absorb a larger share of a poor household's budget than of a better-off household's budget), while a positive number indicates that out-of-pocket health expenditures are progressive (i.e., absorb a smaller share of a poor household's budget than of a better-off household's budget).
Catastrophic Expenditures
The top left map in figure 4 shows the incidence of catastrophic expenditures at the 10% level—relative to consumption in the low- and middle-income countries, and income in the high-income countries. The shading of the budget share and catastrophic expenditure maps are quite similar and would have been even more so if the cutoffs had been set to divide countries into five equal-size groups. This reflects the high correlations between the budget share and the catastrophic expenditure measures: the correlation between the budget share and the 10% catastrophic expenditure measure is 0.97 (p = 0.00), while the correlation between the budget share and the 25% catastrophic expenditure measure is 0.81 (p = 0.00). Thus, countries with high budget shares tend to have a high incidence of catastrophic out-of-pocket health expenditures. There are 26 countries where catastrophic expenditures exceed 15%, including five low-income countries (Afghanistan, Cambodia, Nepal, Tajikistan, and Uganda) and five high-income countries (Barbados, Chile, Greece, Malta, and Portugal). The regression results, like the maps, are similar to those for the budget share. Thus, as with the budget share, catastrophic expenditures are lower in countries that channel more of their total health spending through social health insurance schemes, government “schemes”, and nonprofit schemes. Table 8 points to some regional variation, with a higher incidence of catastrophic expenditure in South Asia, especially in India and Nepal. Finally, for 48 countries, we can compute catastrophic expenditure incidence using either consumption or income in the denominator. At the 10% threshold, the median consumption-based rate is 10.62, while the median income-based rate is 10.65; the difference is not statistically significant (p = 0.97). As far as the catastrophic expenditure incidence rate is concerned, then, the choice of consumption vs. income in the denominator seems to make little difference.
Median Incidence of Catastrophic Out-of-Pocket Health Expenditures at the 10% Threshold, Latest Year
| Low income | Lower middle-income | Upper middle-income | High income | Total | |
|---|---|---|---|---|---|
| East Asia & Pacific | 11 | 3 | 10 | 6 | 5 |
| Europe & Central Asia | 12 | 8 | 9 | 5 | 8 |
| Latin America & Caribbean | 7 | 10 | 10 | 10 | 10 |
| Middle East & North Africa | 8 | 8 | 13 | 9 | |
| North America | 5 | 5 | |||
| South Asia | 21 | 8 | 12 | ||
| Sub-Saharan Africa | 6 | 7 | 3 | 5 | |
| Total | 7 | 8 | 8 | 5 | 7 |
Source: Author's calculations using data in World Bank's Health Equity and Financial Protection Indicators database.
Note: Table shows the percentage of households spending more than 10% of their consumption or income on out-of-pocket health expenditures.
Inequality in Incidence of Catastrophic Expenditures
The top right map in figure 4 shows the inequality of catastrophic expenditures across the consumption distribution in the case of low- and middle-income countries and across the income distribution in the case of high-income countries. As with progressivity, the bottom two maps show the effect of switching between consumption and income in countries where we can compute the concentration index both ways. Unsurprisingly, given the comments above, we find that the incidence of catastrophic expenditures tends to be higher among the poor when the poor are defined in terms of income, and lower among the poor when the poor are defined in terms of consumption: the median values of the concentration index among the 48 countries where we can compute it using both income and consumption are −0.12 and 0.10 for income and consumption, respectively. This difference is statistically significant (p = 0.00). Thus, while the choice between income and consumption seems to matter very little as far as the incidence of catastrophic expenditures is concerned, it seems to matter a great deal as far as inequality in catastrophic expenditures is concerned. When assessed relative to income, catastrophic expenditures emerge as highly concentrated among the poor in Bangladesh, Bolivia, Guatemala, India, and the Seychelles; in all five countries, except the Seychelles, catastrophic expenditures emerge as concentrated among the better off when assessed relative to consumption. The regressions in table 4 are relatively uninformative, suggesting that inequality in the incidence of catastrophic expenditures is lower in countries channeling higher shares of their total health expenditures through a social health insurance scheme. Again, these results are somewhat misleading given that we have used consumption in some countries and income in others.
Impoverishment
The maps in figure 5 show the percentage of the population impoverished by out-of-pocket expenses for the three international poverty lines and the $10.00-a-day low-income line. Table 9 shows the means by income group and region for the $1.90-a-day line. Unsurprisingly, given the higher fraction of households living in the vicinity of the extreme poverty line in low-income countries, it is in this group of countries that we see the highest rate of impoverishment due to out-of-pocket expenditures. The rate of impoverishment at the extreme poverty line is especially high in South Asia, with Afghanistan and India having the highest rates (4.5 and 4.2 percentage points, respectively). At the $3.20-a-day line, low-income countries still have the highest rate of impoverishment, with South Asia again having the highest rate. As we move up to the $5.50-a-day poverty line, it is the lower middle-income countries that have the highest impoverishment rate, and at the $10.00-a-day line, it is the upper middle-income countries that have the highest rate. The regression results in table 4 suggest that impoverishment (at the extreme poverty line) is lower in richer countries and countries spending larger shares of their GDP on health, and in countries channeling larger shares of their total health spending through social health insurance schemes, government schemes, or nonprofit schemes.
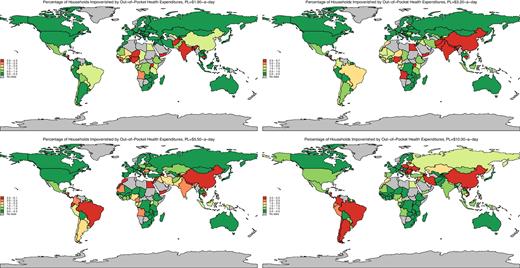
Impoverishment due to Out-of-Pocket Health Expenditures
Source: Authors’ calculations using data in World Bank's Health Equity and Financial Protection Indicators database. Note: Charts show percentage of households impoverished (i.e., pushed into poverty) as a result of out-of-pocket health expenditures at different international poverty lines.
Median Rates of Impoverishment Due to Out-of-Pocket Health Expenditures, $1.90-a-day Poverty Line, Latest Year
| Low income | Lower middle-income | Upper middle-income | High income | Total | |
|---|---|---|---|---|---|
| East Asia & Pacific | 1.70 | 0.25 | 0.78 | 0.18 | 0.25 |
| Europe & Central Asia | 1.98 | 0.00 | 0.00 | 0.04 | 0.03 |
| Latin America & Caribbean | 0.34 | 0.75 | 0.47 | 0.70 | 0.50 |
| Middle East & North Africa | 0.13 | 0.27 | 0.44 | 0.20 | |
| North America | 0.18 | 0.18 | |||
| South Asia | 3.19 | 0.79 | 1.36 | ||
| Sub-Saharan Africa | 1.34 | 1.36 | 0.45 | 1.21 | |
| Total | 1.38 | 0.48 | 0.10 | 0.06 | 0.30 |
Source: Authors calculations using data in World Bank's Health Equity and Financial Protection Indicators database.
Note: Table shows percentage of households impoverished (i.e., pushed into poverty) as a result of out-of-pocket health expenditures at the $1.90-a-day international poverty line.
The maps in figure 6 show the addition to the per capita poverty gap from out-of-pocket health expenses, again for the same four poverty lines. As the poverty line is raised, the addition to the poverty gap inevitably increases; the cutoffs are therefore held constant across the four maps and are chosen to divide countries at the $10.00-a-day poverty line into five equal-sized groups. At the $10.00-a-day line, the countries with the largest additions to the poverty gap are Cambodia, Egypt, Moldova, Nepal and Nicaragua. The countries with the smallest additions are the Czech Republic, Germany, Luxembourg, Timor-Leste, and the United Kingdom. Other low-income countries in the bottom fifth—apart from Timor-Leste—include Lesotho, Madagascar, Mozambique, Rwanda, and Zimbabwe. Chile is the high-income country with the highest addition to the poverty gap at the $10.00-a-day poverty line. Other OECD countries with relatively high additions to the poverty gap include Israel, Korea, Poland, Switzerland, and the United States. Tabulations of medians by income group show that only in the low-income group do we see any appreciable contribution to the poverty gap at the $1.90-a-day line. The regression results in table 4 suggest that the addition to the poverty gap due to out-of-pocket expenditures (at the extreme poverty line) is lower in richer countries and in countries channeling larger shares of their total health spending through nonprofit schemes.

Contribution to the Poverty Gap of Out-of-Pocket Expenditures
Source: Authors calculations using data in World Bank's Health Equity and Financial Protection Indicators database.
Note: Charts show addition to the per capita poverty gap in U.S. dollars (i.e., the aggregate shortfall from the poverty line averaged across the population) from out-of-pocket health expenditures at different international poverty lines.
Conclusions
We have tried to give a sense of the state of research on out-of-pocket health expenditures prior to the present paper, assembling and explaining the various summary measures used in national and international studies, and reviewing the results of multi-country and global studies that have used these measures. These studies have almost all used just one or two measures, and some measures have not been used at all in any multi-country study prior to the present paper. In our empirical analysis, we presented results for 146 countries from all World Bank income groups for all summary measures. We also presented correlations between the summary measures and macroeconomic and health system indicators.
Our results reveal large differences across countries in per capita out-of-pocket health expenditures in 2011 international dollars. These are driven in large part by differences in per capita income, with high-income countries tending to spend more out-of-pocket than poorer ones. However, we find that out-of-pocket expenditures vary sharply within income groups, ranging from $32 in Sweden to $1,200 in Switzerland in the high-income group, and from $6 in Madagascar to over $100 in Cambodia, Haiti, and Nepal in the low-income group. Out-of-pocket expenditures are also positively correlated with the share of GDP spent on health.
We find the two measures of dispersion or risk—the coefficient of variation and Q90/Q50—are only weakly correlated across countries. Dispersion in out-of-pocket expenditures is sometimes high in countries where the amount in dollar terms is low, such as Sri Lanka and the United Kingdom, and we find only one macroeconomic and health system variable correlated with the dispersion measures (the Gini index of income inequality, which is positively correlated with the Q90/Q50 ratio). Nor do we find any clear pattern by income group.
We find considerable international variation in the out-of-pocket health expenditure budget share, with clearer correlations with macroeconomic and health system variables. The high-income countries tend to have lower out-of-pocket budget shares, though there are exceptions. In the low- and middle-income groups, we find countries with budget shares more than 7%, including Brazil and Egypt. The out-of-pocket budget share is higher in countries that spend a large share of their GDP on health, and lower in countries that channel more of their total health spending through social health insurance schemes, government “schemes” like the NHS, and nonprofit schemes.
As anticipated, we find that out-of-pocket expenditures are less progressive when assessed relative to income rather than consumption: in fact, we find that out-of-pocket expenditures are regressive when assessed relative to income, and progressive when assessed relative to consumption. In the low- and middle-income countries, we find out-of-pocket expenditures to be especially regressive (when assessed relative to income) in Bangladesh, Haiti, and India.
The incidence of catastrophic expenditures (at the 10% level) is highly correlated with the out-of-pocket budget share (r = 0.94, p = 0.00), and the correlations with the macroeconomic and health system variables are, unsurprisingly, also similar across the two out-of-pocket expenditure measures. We find 26 countries where catastrophic expenditures exceed 15%, including five low-income countries (Afghanistan, Cambodia, Nepal, Tajikistan, and Uganda) and five high-income countries (Barbados, Chile, Greece, Malta, and Portugal). We find some regional variation, with a higher catastrophic expenditure incidence in South Asia, especially in India and Nepal. We find little difference between the consumption- and income-based estimates of catastrophic expenditure incidence.
By contrast, we do find that the degree of inequality in catastrophic expenditures depends on whether expenditures are related to consumption or income: the incidence of catastrophic expenditures tends to be higher among the poor when the poor are defined in terms of income, and lower among the poor when the poor are defined in terms of consumption. When assessed relative to income, catastrophic expenditures emerge as highly concentrated among the poor in Bangladesh, Bolivia, Guatemala, India, and the Seychelles; in all five countries (except the Seychelles) catastrophic expenditures emerge as concentrated among the better off when assessed relative to consumption.
Unsurprisingly, given the higher fraction of households living in the vicinity of the extreme poverty line ($1.90-a-day) in low-income countries, it is in this group of countries that we see the highest rate of impoverishment due to out-of-pocket expenditures. The rate of impoverishment at the extreme poverty line is especially high in South Asia, with Afghanistan and India having the highest rates. At the $3.20-a-day line, low-income countries still have the highest rate of impoverishment, with South Asia again having the highest rate. As we move up to the $5.50-a-day poverty line, it is the lower middle-income countries that have the highest impoverishment rate, and at the $10.00-a-day line, it is the upper middle-income countries that have the highest rate.
Inevitably, we find that as the poverty line is raised, the addition to the poverty gap due to out-of-pocket expenditures inevitably increases. At the $10.00-a-day line, the countries with the largest additions to the poverty gap include Cambodia and Egypt, while the countries with the smallest additions include Germany, Timor-Leste, and the United Kingdom. Chile is the high-income country with the highest addition to the poverty gap at the $10.00-a-day poverty line. Only in the low-income group do we see any appreciable contribution to the poverty gap at the $1.90-a-day poverty line.
Notes
Adam Wagstaff (corresponding author) is a Research Manager in the Development Research Group at the World Bank in Washington, DC; his email address is [email protected]. Patrick Eozenou is a Senior Economist in the Health, Nutrition and Population Global Practice at the World Bank in Washington, DC; his email address is [email protected]. Marc Smitz is a consultant with the Health, Nutrition, and Population Global Practice at the World Bank in Washington, DC; his email address is [email protected].
The authors thank three referees for their helpful comments on a previous version of the paper. The findings, interpretations, and conclusions expressed in this paper are entirely those of the authors, and do not necessarily represent the views of the World Bank, its Executive Directors, or the governments of the countries they represent.
Footnotes
As Blinder (1985) put it: “. . . dollars [spent on medical care] do not buy happiness; they just maintain human capital”. Or as the U.S. National Academy of Science (NAS) Panel on Poverty and Family Assistance put it: “A sick person with high medical care expenditures is not made better off than a healthy person with no or relatively low expenditures; at best, the added expenditures serve only to restore the sick person to a healthy state” (Citro and Michael 1995, 236).
In practice, and surprisingly given that Deaton and Zaidi (2002) was commissioned by the World Bank and published in its working paper series, most World Bank poverty assessments (72/76 or 95%) either do not take medical spending out of the picture or do not appear to do so. An “advanced” search of the World Bank's documents and reports website allows the user to specify “Poverty Assessment” in the document type. Such a search in September 2017 produced 178 documents. Of these, 95 are not in English, or are a background paper or another document within the poverty assessment or are a duplicate. Of the remaining 83, two were not a typical poverty assessment and did not report a poverty analysis, two lacked the necessary data to undertake a traditional consumption- or income-based poverty analysis, and three, due to data limitations, reported a poverty analysis based solely on food expenditures. Among the 76 standard poverty assessments, five used income, 24 explicitly included spending on medical services in the consumption aggregate, and 43 did not explicitly exclude medical spending from the consumption aggregate. Among the remaining four studies, three explicitly excluded all medical spending from the consumption aggregate, and one included private insurance premiums but excluded other medical spending.
Some form of health insurance or prepayment system—whether private insurance, an earnings-linked social health insurance scheme, or a tax-financed public health system—is the obvious way to limit the size of out-of-pocket health expenses and their welfare effects (cf. Arrow 1963). The details of the scheme matter a lot. For example, what services and interventions are covered and what are excluded? Are there copayments? If there are, are they means-tested and are there copayment ceilings? The way service provision is funded and organized also matters. In poor countries where services are very limited, the scope for large out-of-pocket expenses are also limited—a low incidence of “large” out-of-pocket expenses may be a sign of severely constrained health services. The way providers are paid may also matter. With copayments, patients may end up paying more out-of-pocket if providers are paid fee-for-service than if they are paid in another way, such as a salary.
A large number of single-country studies have been undertaken but reviewing them is beyond the scope of this paper.
Household surveys may vary in their definition of a household. A common definition of a household is the set of individuals sharing meals over a specific period. This means inter alia that out-of-pocket expenses incurred by relatives who are not part of the household would not be counted as health expenses in a household survey, but rather as a loan or gift by the household in the event they help pay the bill.
In our work, we have examined multiple surveys that have collected data on out-of-pocket expenditures in both the consumption and health sections and have found that recall periods tend to be longer in the consumption section than in the health section, and that annualized expenditures tend to be higher when estimated using data from the health section than when using data from the consumption section.
The HEFPI dataset is available at https://datacatalog.worldbank.org/dataset/hefpi.
In the PovcalNet comparisons, numbers were flagged where the absolute relative difference (ARD) exceeded 10%. Here, ARD for consumption is defined as |(C1−C2)/C1| where C1 is the benchmark value of consumption, and C2 is the value in our data. When the comparison is made with the World Development Indicators, numbers were flagged when the ARD exceeded 15%.
Numbers where the absolute difference exceeded 5% were flagged.
Numbers where the absolute difference exceeded 10% were flagged.
The WHS was excluded in its entirety, failing most of the three quality checks in most countries. The problem with the survey is not the health expenditure data, which are very detailed and credible; rather, the problem lies with the total household consumption data.
The tables show the marginal effects reported from multiple regressions that include the following: per capita GDP in 2011 international dollars; the Gini index of income inequality; total health expenditure (THE) as percentage of GDP; the percentage of THE channeled through social health insurance schemes; the percentage of THE channeled through (other) government-financed programs such as NHS-type arrangements and public health programs; the percentage of THE channeled through compulsory private insurance; the percentage of THE channeled through nonprofit schemes; and the percentage of THE channeled through voluntary health insurance schemes. The omitted category is payments made out-of-pocket through no scheme, so the coefficients are to be interpreted as effects relative to this omitted category. GDP per capita is also interacted with itself (i.e., GDP per capita squared) and with each of the other variables. The regressions are estimated on all available datapoints, not just the most recent year. The regressions are similarly specified to those in Wagstaff et al. (2018b), except that the regressions here exploit the new WHO GHED, which allow us to extract how much of THE is spent by different schemes and programs rather than how much revenue was raised by (or for) them.
It is worth noting that the out-of-pocket regression in table 4 differs from that used in cross-county studies of whether health care is a normal or luxury good (see, e.g., Gerdtham and Jönsson 2000). First, our dependent variable is out-of-pocket expenditures, whereas studies in this field use total expenditures irrespective of whether they are financed out-of-pocket or through some prepayment mechanism. Second, our sample is more heterogeneous, including OECD countries (where many of the other studies have been conducted) and non-OECD countries at all income levels. In our sample, we think it less likely that changes in income leave the price of health care unaffected—a key assumption required in order to infer whether health care is a normal or luxury good from the coefficient on income in an expenditure regression.
The fact our regressions include these other determinants of out-of-pocket expenditures means that the coefficient on per capita income is the partial effect holding constant these other influences. Since we might expect higher per capita incomes to lead to higher shares of GDP spent on health and higher shares of total health expenditure being channeled through SHI and government “schemes”, the overall effect of per capita income on out-of-pocket expenditures cannot be inferred from table 4. In the event, when only GDP per capita (and its square) is included in the regression, the marginal effect of income is still positive but is smaller at higher per-capita income levels.
