


Abstract
Fiscal transparency and participation in government budgeting are widely promoted, yet claims about their benefits are rarely based on convincing evidence. We provide the first systematic review covering 38 empirical studies published between 1991 and early 2015. Increased budgetary disclosure and participation—which we call “fiscal openness”—are consistently associated with improvements in the quality of the budget, as well as governance and development outcomes. Only a handful of studies, however, convincingly identify causal effects, in the form of reduced corruption, enhanced electoral accountability, and improved allocation of resources. We highlight gaps and set out a research agenda that consists of: (a) disaggregating broad measures of budget transparency to uncover which specific disclosures are related to outcomes; (b) tracing causal mechanisms to connect fiscal openness interventions with ultimate impacts on human development; (c) investigating the relative effectiveness of alternative interventions; (d) examining the relationship between transparency and participation; and (e) clarifying the contextual conditions that support particular interventions.
Transparency and participation are in vogue in international policy circles. These concepts form part of a new development consensus that has become “nearly universal” in the policy statements of major international organizations (Carothers and Brechenmacher 2014) and links them to a series of desirable outcomes. The fiscal policy arena is no exception. The website of the International Monetary Fund (IMF) claims that fiscal transparency “is critical for effective fiscal management and accountability”.1 The World Bank’s Budget Transparency Initiative (n.d.) asserts that budget transparency leads to less corruption, more efficient use of resources, more trust in government, and higher revenues. A number of organizations seem to promote transparency and participation in fiscal matters—which we summarize with the term “fiscal openness”—based on an implicit theory of change that sees them leading to a variety of desirable impacts.
This positive view has engendered a growing set of international standards and norms. In its 2014 Fiscal Transparency Code, the IMF sets out benchmarks for fiscal reporting, forecasting, and budgeting, and the management of fiscal risks. For the first time since the inception of the transparency code in 1998, it also encourages governments to provide their citizens with “an opportunity to participate in budget deliberations” (IMF 2014). In 2015, the Council of the Organisation for Economic Co-operation and Development (OECD) approved a “Recommendation on Budgetary Governance”, which advocates for budget documents and data to be “open, transparent and accessible” and for budget debates to be “inclusive, participative and realistic” (OECD 2015).2 Finally, the multi-stakeholder Global Initiative for Fiscal Transparency (GIFT) has developed High-Level Principles that were endorsed by the United Nations General Assembly in December 2012.3 These principles enshrine the right of citizens to gain access to fiscal information and to have effective opportunities to participate in fiscal policymaking.
As with many norms and principles that gradually gain international acceptance, arguments in their favor can be distinguished as normative and instrumental. On the normative side, the intrinsic value of fiscal openness is increasingly recognized. Governments have started to translate related international norms and principles into domestic laws and practices, albeit unevenly. A review of budget laws in over 100 countries found that more than half explicitly mention transparency, at least as a key principle to guide fiscal policymaking. On the other hand, only seven budget laws included explicit provisions for citizen participation and engagement (de Renzio and Kroth 2011).
The instrumental side of the debate includes proponents of fiscal openness as well as skeptics. For instance, Heald (2003) points to a view that “over-exposure” to fiscal information may lead to “losses in effectiveness through high levels of transaction costs and excessive politicization”, while de Fine Licht etal. (2014) caution that transparency may engender frustration among citizens if not combined with “credible mechanisms for accountability”.4 Such concerns are legitimate. Ultimately, empirical evidence is required to understand whether, how, and when fiscal openness contributes to outcomes desired by governments, citizens, or market actors. The list of supposed benefits that proponents present is substantial, but these claims are rarely backed up by rigorous evidence. Too often, perceived positive impacts in a single case metamorphose into “best practice” examples that receive unquestioned support in policy reports, or statistical studies are cited without acknowledging potential threats to valid inference.
To provide a firmer empirical grounding for these debates, we carry out the first systematic review of published evidence on the impacts of transparency and participation in government budgeting. Others have reviewed the impact of “citizen engagement” or “participatory governance” on improvements in governance and development (Gaventa and Barrett 2012; Speer 2012), leaving out questions linked to transparency, and without focusing specifically on government budgets. Other reviews (Fox 2014; Kosack and Fung 2014) are restricted to a small set of impact evaluation studies related to growing donor support for “social accountability” or “transparency and accountability” initiatives.5 Some reviews resemble our focus (Carlitz 2013; Ling and Roberts 2014) but consider a more limited range of evidence, and often group together a disparate set of interventions without sufficient conceptual underpinnings. Our review focuses squarely on fiscal openness, which is crucial at a time when international organizations are stepping up their efforts to promote fiscal disclosure and participation in budgeting as part of a package of reform initiatives.
This article proceeds as follows. We first describe our approach and analytic framework, followed by conceptual background and an overview of how “transparency” and “participation” in budgeting are operationalized in the literature. We then summarize the evidence across four broad categories of impacts, and assess its strength by focusing on whether studies can make a convincing claim to identify causal effects as well as their substantive contribution. Our conclusion develops potential directions for future research.
Our Approach and Framework
The scope of this review includes studies that (1) empirically evaluate a causal claim about the impact of an element of fiscal openness; (2) have achieved publication as a peer-reviewed academic article, or as a book with an academic press or well-known commercial publisher; and (3) are of sufficient length to qualify as a substantial piece of original research. We elaborate on some aspects of these criteria below, and describe the resulting set of studies for this review.6 We also set out a framework that guides our analysis in the following sections.
We examine empirical work that focuses on, or otherwise makes a significant contribution to, the evaluation of a causal argument about the impact of fiscal transparency or participation in budgeting. Hence, we do not cover purely theoretical work, although in some instances (e.g., Milesi-Ferretti 2003) this has laid the foundation for subsequent empirical studies we review. Scholars have also contributed conceptual analyses (e.g., Heald 2003), or described particular cases (e.g., de Sousa Santos 1998). We acknowledge that such work can make important contributions and spur critical reflection, but it falls outside the scope of our review.
In general, we excluded studies that are not precisely focused on an explanatory variable or intervention that falls under our definition of fiscal openness, which we discuss in detail in the following section. This may be the case when a measure of government disclosure of information is used that includes fiscal material, but is not limited to it. As a result, any reported effects cannot be precisely attributed to fiscal transparency. In instances where the link is plausibly strong, however, we have included the evidence in our review, while noting this limitation. We do not include the large body of literature on transparency and communication by central banks in the management of monetary—rather than fiscal—policy, and their impacts on financial markets (Blinder etal. 2008).
Our focus in this paper is on interventions that are due to government action, such as the publication of budget information or the provision of participation opportunities in the budget process. For this reason, we excluded a number of recent studies under the broad topic of “social accountability”.7 Few of these studies look at transparency and participation in budgetary matters, and many investigate interventions by non-governmental organizations or researchers rather than governments. In terms of publications covered, we considered limiting our analysis to books or peer-reviewed articles, but decided to make some reasonable exceptions. These include working papers from the IMF, the World Bank, and a few other institutions that have contributed significantly to the debate on fiscal openness and/or are frequently cited in other studies that we examine.
Following an initial sweep of the literature and applying the above criteria to filter the resulting list of over a hundred studies, we identified a core set of 38 papers published between 1991 and early 2015 as the basis for our review. Of these, 23 investigate the effects of variables related to fiscal transparency, and 14 relate to participation in budgetary decisions. Only a single study (Olken 2007) looks at both transparency and participation interventions to explore their relative impacts. About three-quarters of all studies use quantitative methods, most of them based on observational data. Only four studies are based on experimental designs, and three might be labeled quasi- or natural experiments.8 Twenty studies use evidence from a single country, and 18 are based on cross-national data. The appendix contains a listing with overview information.
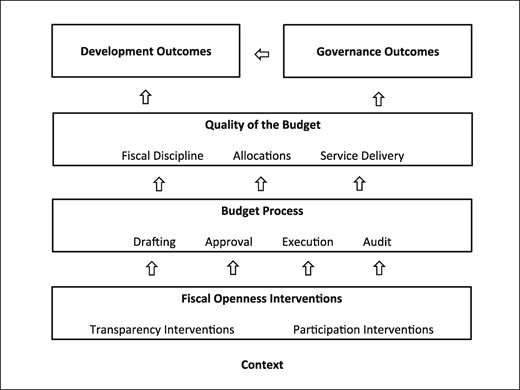
Figure 1 provides a visual guide to our analysis. The boxes represent different sets of variables, and the arrows connections between them. Figure 1 should be read from the bottom up, indicating possible relationships between fiscal openness interventions, the budget process, and different types of impacts. Transparency and participation interventions potentially can relate to any of the four stages of the budget process: formulation within the executive branch (drafting stage), legislative review and approval, execution (when resources are raised and spent based on the approved budget), or ex post audit and evaluation. By altering the process of budgeting, a fiscal openness intervention may affect the quality of the budget in terms of its aggregates (for instance, how much is spent in total, or the size of the deficit), priorities, and operational efficiency (or service delivery: the conversion of inputs purchased with funds into tangible goods and services). This, in turn, may affect governance outcomes (such as corruption, or the reelection prospects of politicians) and development outcomes. Proponents of fiscal openness also often posit that governance affects development. Hence, figure 1 shows a direct impact of the budget on development outcomes, as well as an indirect impact (via better governance).9 These relationships are embedded in particular contexts, suggesting possible scope conditions for the effectiveness of particular interventions and the specific nature of any impacts. The following sections flesh out the various elements in figure 1.
From Fiscal Openness Interventions to Impacts
Our approach to assessing the contribution of these studies considers their substantive importance as well as the extent to which they identify causal impacts. Randomized evaluations have gained in importance in recent years precisely for their potential to deliver convincing evidence on the impact of policies and institutional reforms. Yet the substantive focus of our study means that experiments are not always possible, especially in relation to macroeconomic policy (Glennerster and Takavarasha 2013). For instance, governments would have to agree to the random assignment of fiscal transparency levels to evaluate its impact on, say, deficits or debt. This is highly unlikely, so observational data and the quality of their analysis will be crucial for gaining insights into these relationships. Other types of outcomes in figure 1 are amenable to randomized evaluations, and we discuss relevant studies in detail, while acknowledging the contribution of other approaches.
Transparency and Participation as Independent Variables
We start by examining the key components of fiscal openness: transparency and participation. The IMF defines fiscal transparency as “the comprehensiveness, clarity, reliability, timeliness, and relevance of public reporting on the past, present, and future state of public finances”.10 This definition captures much of what we consider important regarding the regular disclosure and dissemination of detailed and accessible information on all aspects of fiscal policy by the government (see also Kopits and Craig 1998; OECD 2001).
Existing definitions of public participation in budget processes are less well developed. In general, such definitions refer to a wide set of practices through which citizens, civil society organizations, and other non-state actors interact with public authorities to influence the design and execution of fiscal policies.11 This may occur at different stages of the budget cycle or in relation to specific service delivery or public investment issues.12
In studies of fiscal transparency, the specificity of the independent variable of interest varies greatly. Least precise are measures of government transparency that include fiscal material, but are not limited to it (e.g., Bellver and Kaufmann 2005; Gelos and Wei 2005; Glennerster and Shin 2008; Lindstedt and Naurin 2010). Here, we cannot be certain whether an association is with fiscal transparency or some other aspect of government disclosure.
By far the most common operationalization of fiscal transparency in the literature is a broad approach that captures a wide range of disclosures with reference to the IMF Code and OECD Best Practices for Budget Transparency. Cross-national studies use data from IMF fiscal transparency assessments (e.g., Hameed 2005; Arbatli and Escolano 2012; Weber 2012), budget surveys by the OECD (e.g., Alt and Lassen 2006a and 2006b; Benito and Bastida 2009), the Open Budget Index (Hameed 2011; Blume and Voigt 2013; Alt, Lassen, and Wehner 2014), or an early budget transparency assessment for European Union (EU) countries (von Hagen and Harden 1994; Bernoth and Wolff 2008).13 This “broad” approach is rarely replicated at the subnational level, with few exceptions (Alt, Lassen, and Skilling 2002).
Work on specific components of fiscal transparency is rare. Three studies examine external auditing, one with cross-national data (Bernoth and Wolff 2008) and two in a single country (Olken 2007; Ferraz and Finan 2008). One well-known study looks at the publication of information on funds disbursed to local schools (Reinikka and Svensson 2005, 2011).14 Transparency interventions targeted at the earlier drafting or approval stages of the budget process (see figure 1) are not examined in detail.15 Other important aspects are also overlooked. For example, we lack evidence on revenue transparency, including in relation to natural resources, and on transparency in public procurement. Overall, cross-national work on fiscal transparency tends to use broad and encompassing measures, while several single-country studies focus on selected disclosures.
Studies of participation in budget processes broadly belong to two groups. One looks at “participatory budgeting” as a specific mechanism first adopted in the southern Brazilian city of Porto Alegre, before spreading within Brazil and further afield. Participatory budgeting is a process of democratic deliberation consisting of organized assemblies through which citizen representatives are able to define and decide local public investment priorities. Some of the early literature (e.g., de Sousa Santos 1998) focused on its practice and potential for democratic development, and qualitative accounts on different countries (Ebdon and Franklin 2004; Wu and Wang 2011; Kasymova and Schachter 2014) discuss its consequences only in general terms. More recent quantitative studies assess the Brazilian experience by comparing municipalities that introduced participatory budgeting with those that did not (Boulding and Wampler 2010; Gonçalves 2014; Touchton and Wampler 2014).
A second group of papers looks at a variety of other participatory mechanisms adopted as part of decisions on city-level services, decentralization reforms (Heller, Harilal, and Chaudhuri 2007), public investment programs, or other similar initiatives that allow citizens to have a voice in determining resource allocation. These range from citizen surveys (Watson, Juster, and Johnson 1991; Simonsen and Robbins 2010) and citizens directly voting on budget priorities (Olken 2010; Beath, Christia, and Enikolopov 2012), to village forums shaped around voluntary or traditional practices (Diaz-Cayeros, Magaloni, and Ruiz-Euler 2010; Jaramillo and Wright 2015). These mechanisms are studied in sub-national contexts, with some papers comparing different mechanisms. We could not find any relevant studies that utilize cross-country data or look at national-level participation practices, except for the broad comparisons in Bräutigam (2004). Table 1 summarizes the main empirical measures of fiscal openness in the literature.
Main Empirical Measures of Fiscal Openness in the Literature
| Fiscal transparency | Citizen participation in budgeting |
|---|---|
| Broad transparency measures that include fiscal elements. | Participatory budgeting, principally as pioneered and practiced in Brazil. |
| Indices of fiscal transparency at the national level based on IMF or OECD data, or the Open Budget Index. | Other participatory mechanisms, for example, citizen surveys, secret ballots to choose projects, or village forums. |
| Disclosure of specific budget information, for example, audit results, amounts disbursed to local schools or clinics. |
Summary of Findings
The 38 studies relate to different groups of outcomes represented in figure 1: (a) macro-fiscal, (b) allocation and service delivery, (c) governance, and (d) development outcomes. The first two categories relate to the quality of budgets, as assessed by public finance practitioners and scholars.16 The latter two categories look at the consequences of resource decisions and management. In category (a), 14 studies look at fiscal performance, credit worthiness, and creative accounting (or “fiscal gimmickry”). Group (b) contains nine studies linking fiscal openness to the allocation of budget resources across different sectors or projects, and the delivery of public services. Category (c) has 11 studies that look at what we label governance outcomes, which range from corruption and political accountability to the mobilization of citizens. The final category (d) is small and considers development outcomes in areas such as health and education. Only a few studies look at several outcomes (e.g., Alt, Lassen, and Skilling 2002; Hameed 2005; Reinikka and Svensson 2011), and the appendix notes secondary impact categories. We examine each group in turn.
Macro-fiscal Outcomes
One of the most established areas of empirical research probes the relationship between budget transparency and fiscal outcomes, such as deficits or debt. An important early contribution by von Hagen and Harden (1995) develops several indices of the quality of budget institutions for 12 EU countries and documents an association with fiscal outcomes. However, their measure of the “informativeness” of the draft budget is only one component of their indices, which is not analyzed separately here or in later work (e.g., Hallerberg, Strauch, and von Hagen 2009).17
In pioneering work, Alt and Lassen (2006a, 2006b) examine the role of budget transparency in electoral budget cycles and its impact on public debt. In a panel of 19 OECD countries in the 1990s, these authors find large swings in the budget balance in low-transparency countries, where deficits are more than 1% of GDP lower in a post-election year than in an election year (Alt and Lassen 2006a). In a related study, these authors link this to higher levels of public debt (Alt and Lassen 2006b).
Benito and Bastida (2009) find a negative correlation of their budget transparency index with deficits, but not with debt levels, for a sample of up to 41 countries in the year 2003. Blume and Voigt (2013) find no association of the 2006 Open Budget Index with government spending levels in a cross-section of 47 countries in the 1990s. Elsewhere, Alt, Lassen, and Skilling (2002) and Alt and Lowry (2010) report a positive correlation between fiscal transparency and the size of government in U.S. states.
A second strand of research in this category links fiscal transparency to sovereign credit ratings and related variables. Hameed (2005) shows that transparency is associated with better credit ratings in a cross-section of 32 countries (see also Hameed 2011). Arbatli and Escolano (2012) confirm this association for a larger sample of up to 56 countries. These authors further present correlations suggesting that budget transparency works indirectly via its effect on fiscal outcomes for developed countries, whereas the effect on credit ratings is direct for developing countries.
Several papers consider the relationship between budget transparency and borrowing costs. Looking at EU countries and the United States, Bernoth and Wolff (2008) find that transparency mediates the association of detected creative accounting with risk premia in government bond markets. Wang, Shields, and Wang (2014) study 562 state bond issuances in the United States between 1986 and 2012, and find that both high and low transparency levels correlate with increased costs, but medium levels correlate with lower costs. Two related papers use broader measures of transparency, and find it appears to attract and retain equity fund investments in emerging markets (Gelos and Wei 2005) and to lower sovereign borrowing costs (Glennerster and Shin 2008). These patterns are broadly consistent with the work on transparency in budgeting, but we cannot isolate the contribution of fiscal disclosure.
A more recent approach is an empirical focus on the role of transparency in containing creative accounting or fiscal gimmicks, as proxied by “stock-flow adjustments”—the difference between the change in the stock of debt and annual deficits. Using IMF data for a sample of 87 countries, Weber (2012) finds that fiscal transparency correlates with decreased deviations. Alt, Lassen, and Wehner (2014) examine 14 EU countries from 1990 to 2007, showing that fiscal transparency dampens or eliminates the association with fiscal gimmicks of elections, fiscal rules (the Stability and Growth Pact), and economic downturns.18 These studies suggest that fiscal transparency may have both direct and indirect effects on creative accounting.
Resource Allocation and Service Delivery Outcomes
Evidence linking fiscal openness to shifts in resource allocation and improvements in the provision of public services is more recent. Relevant work focuses on different participatory mechanisms rather than on fiscal disclosure. Unsurprisingly, much of this evidence is based on the pioneering Brazilian experience with participatory budgeting.
Goldfrank and Schneider (2006) document how after the introduction of participatory budgeting, the city of Porto Alegre increased the share of spending dedicated to the social sectors—by much more than in places where participatory institutions had not been established—and improved its performance in project completion. More recent papers exploit the widespread adoption of participatory budgeting practices across Brazil. Boulding and Wampler (2010) use a dataset covering 220 large Brazilian cities—64 of which introduced participatory budgeting between 1989 and 2000—to show that the adoption of participatory budgeting correlates with changes in resource allocation, especially increases in health and education programs (see also Touchton and Wampler 2014). Gonçalves (2014) estimates that health and sanitation spending increased by 20%–30% after municipalities introduced participatory budgeting.
The above papers all refer to a specific type of participatory institution and to a single country, albeit a very large one. We thus know little about the relevance of these results to other contexts. Bräutigam (2004) discusses the prospects for participatory budgeting around the world and looks at similar experiences across five countries. She suggests that its impact is often conditional on left-wing political parties winning power and using it to advance their progressive agenda, and on the existence of strong audit institutions as well as free, open, and well-informed public policy debates.
Another group of papers looks beyond participatory budgeting, drawing on experiences in a variety of countries and involving different practices. Simonsen and Robbins (2000) and Watson, Juster, and Johnson (1991) document how two U.S. cities have used citizen surveys to assess support for taxes for different services, or to help prioritize parts of the budget. Heller, Harilal, and Chaudhuri (2007) evaluate structures and processes introduced in 1996 in each panchayat (local government) of Kerala, India, to directly involve citizens in spending decisions. Survey respondents from 72 randomly selected panchayats indicated significant improvements, especially for roads, housing, and child services. Respondents also identified projects approved after the start of the campaign as much more appropriate and responsive to local needs. Looking at survey evidence across four states in South India, Besley, Pande, and Rao (2005) examine the role of village meetings, or gram sabhas, that discuss resource allocation. People from disadvantaged groups are more likely to attend than those from other groups, and these meetings appear to be associated with access to resources and services. However, women are less likely to participate than men, which affects representativeness.
Beath, Christia, and Enikolopov (2012) use a randomized field experiment in 250 villages across Afghanistan to assess the impact that different participatory mechanisms have on elite influence and resource allocation outcomes for local development projects. All villages were part of a country-wide National Solidarity Program that provided grants for village projects. Project selection through a secret ballot was much less likely to be affected by elite preferences—and better reflected the needs of the majority of the population, as captured in villagers’ satisfaction levels—than projects in villages where decisions were taken in village council meetings, where elites could wield more influence. Another randomized evaluation (Olken 2010) finds a similar pattern in the Kecamatan Development Program in Indonesia, where a secret ballot to choose projects led to much higher satisfaction with the selected projects than representative village meetings. The conclusion from these two papers is that direct, rather than representative, participation promotes shifts in resource allocation.
Two additional papers look at the experience of Mexico and Peru in promoting participatory governance at the local level. Diaz-Cayeros, Magaloni, and Ruiz-Euler (2013) consider a reform in the state of Oaxaca in Mexico in 1995 that allowed indigenous communities to opt for a form of traditional governance called usos y costumbres, characterized by participatory practices in budgeting and implementation, rather than normal representation through political parties. The communities who adopted traditional governance structures increased energy provision and improved education and sewerage services much faster than municipalities governed by political parties, with decisions taken by politicians without citizen involvement. Jaramillo and Wright (2015) compare agricultural services under mandatory participatory budgeting introduced by the central government in Peru against those with voluntary participatory fora. Voluntary fora appear to facilitate flows of information and collective action and are associated with improvements in the quantity and quality of agricultural services.
Governance Outcomes
A large share of papers in this category deals with the question of whether transparency reduces corruption. A first group examines correlations in cross-country data. Bellver and Kaufmann (2005) develop a measure of transparency for 194 countries based on 20 independent sources looking at access to information, budget transparency, and press freedom, for example; their transparency index is negatively correlated with corruption. Hameed (2005) and Bastida and Benito (2007) detect similar correlations looking specifically at fiscal transparency and with smaller samples of countries. Lindstedt and Naurin (2010) reinvestigate Bellver and Kaufmann’s data and suggest that transparency is associated with lower corruption only when the information provided is accessible via a free press and can be utilized to hold governments to account in elections.
Two papers get closer to establishing a causal link between transparency and corruption. Reinikka and Svensson (2011) report on the following widely-cited case. A 1996 survey by the World Bank and the Government of Uganda found that only a small percentage of funds released by the central government for supporting local schools with materials and equipment actually reached the schools. District officials diverted the rest through leakage and corruption. After the government started publishing details on these transfers in national newspapers and posting them on school notice boards, disbursements reaching schools shot up from an average of 25.4% in 1996 to 81.8% in 2001, most markedly in areas with better access to newspapers. This case popularized Public Expenditure Tracking Surveys (PETS) and is often cited as evidence that transparency can reduce corruption by enabling citizens to hold officials to account. Yet, replication attempts have been less successful (Sundet 2008). Hubbard (2007) points out that following the first survey, several education reforms also helped to reduce leakage. Hence, it is impossible to determine to what extent providing disbursement information to communities, rather than other changes, caused the improvements. While proximity to newspaper outlets is suggestive of such a mechanism, there are likely to be systematic differences between communities with and without easy access to media.
One unambiguously causal piece of evidence in this area is a field experiment carried out in Indonesia to test alternative approaches to lower corruption in village road projects (Olken 2007). Some randomly selected villages were told that their project would be audited by the central government audit agency, and audit findings were discussed at open village meetings. As a result, the amount of misused funds (measured as the difference between actual costs and an estimate provided by independent engineers) was eight percentage points lower compared to villages that did not receive the audit treatment. Elsewhere, villagers were invited to “accountability meetings” where they could query officials about project implementation, and provide anonymous comments. The participation treatment was associated with much smaller, and statistically insignificant, reductions in corruption. In addition to demonstrating that public audits mitigate corruption, this study calls into question the common assumption that community monitoring is a powerful deterrent to corrupt behavior. Although citizen engagement did have some effect on variations in project costs, its overall impact was far from decisive.
Some other studies link fiscal openness to electoral accountability. Alt, Lassen, and Skilling (2002) find that fiscal transparency correlates with higher gubernatorial popularity in U.S. states. Alt and Lowry (2010) extend this work and find no direct association of budget transparency with the retention of incumbent governors, but transparency dampens the negative correlation of tax increases with incumbent retention. A study by Ferraz and Finan (2008) examines how the public release of audit reports on federally transferred funds affects the reelection prospects of incumbent mayors. These authors exploit the fact that the timing of audits was randomized, with some municipalities audited prior to elections in 2004 and some afterwards, to identify causal effects. Where pre-election audits revealed violations indicating corruption, their publication significantly reduced reelection probabilities, especially in municipalities with local radio stations that could publicize the audits.
Lastly, a few additional papers focus on other governance-related outcomes. Islam (2006) builds a transparency index that measures the timeliness of economic data (including government revenue and expenditure) published by the government, and shows that it is positively related to the quality of governance, as measured by the World Bank’s Worldwide Governance Indicators. Touchton and Wampler (2014) look at participatory budgeting in Brazilian municipalities, and report that it is associated with a statistically significant increase of 8% in the number of active civil society groups. These authors interpret this as evidence that participatory budgeting promotes collective action, citizen mobilization, and monitoring of state action (see also Goldfrank and Schneider 2006).
Development Outcomes
Finally, we turn to impacts on development. As far as fiscal transparency is concerned, evidence is very thin. Bellver and Kaufmann (2005) report a correlation between their transparency index and better socio-economic and human development indicators. Fukuda-Parr, Guyer, and Lawson-Remer (2011) also find that the Open Budget Index is positively associated with human development, but the correlation disappears once they include control variables in their regressions. Reinikka and Svensson (2011) find that access to budget information on school grants led to increases in school enrollment, and to some extent educational achievement, measured with exam scores. The authors argue that these results should be relevant for other countries with similar educational funding approaches, but they also note contextual factors that might limit external validity, including the role of parents in school management and the salience of primary education in public policy debates.
In addition, participatory budgeting has been linked to improved health indicators. Both Touchton and Wampler (2014) and Gonçalves (2014) report that Brazilian municipalities that introduced participatory budgeting saw their infant mortality rates drop significantly more than other municipalities. The main reasons, Gonçalves posits, is that citizen participation improves the targeting of policies and spending. Touchton and Wampler suggest this association strengthens over time.
Assessing the Strength of the Evidence
In this section, we assess the strength of the available empirical evidence against two criteria. One criterion is the degree to which a study minimizes threats to valid inference due to the strength of its research design or methods. The second criterion is the substantive importance of a study, which has to do with the nature of the impact under investigation, as well as the degree to which we can draw broader implications from the results, including beyond the immediate empirical context.
Very few studies can plausibly claim to identify a causal effect of fiscal openness. Of the quantitative studies in our dataset, merely four are based on experimental designs (Beath, Christia, and Enikolopov 2012; Olken 2007 and 2010; Simonsen and Robbins 2000), while one exploits a natural experiment (Ferraz and Finan 2008) and another a quasi-experiment (Reinikka and Svensson 2011). In addition, the study by Glennerster and Shin (2008) is quasi-experimental, but it cannot claim to identify the causal effect of fiscal disclosure. While we would welcome more field experiments, this is not a feasible research design for evaluating some impacts of fiscal openness, in particular macro-fiscal outcomes, or when government bodies resist attempts to subject their initiatives to randomized evaluation. In the case of work on fiscal transparency and fiscal outcomes, while we lack randomized evaluations, a relatively large set of compatible results strongly suggests a general pattern.
The quality of non-experimental evidence varies greatly, and depends on the extent to which it addresses internal validity concerns. In particular, with cross-national data it is difficult to account for the full range of variables that may affect the relationship of interest, whereas subnational units within the same country are typically more comparable. Panel data, where units are observed repeatedly over time, can help to address such concerns by focusing on within-unit variation, as in several studies of participatory budget processes (e.g., Boulding and Wampler 2010; Diaz-Cayeros, Magaloni, and Ruiz-Euler 2010; Gonçalves 2014). A time dimension is also useful for investigating the direction of the relationship of interest. In the appendix, we summarize the empirical context of each study, and show that eight studies—all of them involving transparency—rely purely on cross-national data for a single year or time period. This is the least convincing approach for documenting causal impacts. In addition, measurement error is a source of bias, which is a special concern where budget transparency is assessed using survey responses supplied by governments directly and with limited quality control (see Wehner and de Renzio 2013). Some studies use instrumental variable strategies in attempts to address internal validity concerns (Alt and Lassen 2006b; Alt and Lowry 2010; Arbatli and Escolano 2012; Blume and Voigt 2013), but convincing instruments are exceedingly rare in this literature.
Case studies can help to clarify underlying mechanisms. However, in our context they often rely on broad arguments rather than detailed tracing of causal processes, usually pay little attention to constructing a counterfactual scenario, and are sometimes commissioned by organizations that have an interest in claiming positive impacts. In some cases, variables are poorly conceptualized and operationalized. Moreover, case selection is a concern. As Carlitz (2013) notes, “successful initiatives have been examined in greater detail than unsuccessful ones”, which “can make it difficult to draw conclusions about the factors that lead to impact.” This is of course a wider problem, irrespective of methodological approach (Franco, Malhotra, and Simonovits 2014). Nonetheless, some studies (mostly employing case study approaches) do fruitfully explore the specific context and mechanisms in which fiscal openness initiatives have worked. These studies often produce insights and hypotheses that can then be tested elsewhere and help to advance knowledge by detailing how initiatives succeed or fail (see, e.g., the case studies in Khagram, Fung, and de Renzio 2013).
Yet, rigor in a study’s design and use of methods needs to be complemented by substantive importance, which can be limited for various reasons. One of these relates to how much we care about the documented impact.19 Take Simonsen and Robbins (2000), who examine how citizens react to different types of budget information. While the documentation of such public opinion impacts can be valuable—not least for governments that wish to manipulate public sentiments—arguably more important is whether people’s lives were materially affected. The dependent variables in Beath, Christia, and Enikolopov (2012) and Olken (2010) get closer, capturing impacts on project selection as well as villager satisfaction. Olken (2007) and Reinikka and Svensson (2011) document direct impacts on actual service provision, while Ferraz and Finan (2008) show effects on the ability of citizens to hold corrupt politicians to account via the ballot box. All of these studies come with the usual questions about generalizability, but a priori there are no strong grounds for assuming that the results are meaningless beyond the immediate empirical context in which they were obtained. Their wider relevance remains, above all, an empirical question.
The work by Olken (2007) stands out because not only is it empirically convincing due to its experimental design, but it is also substantively unique: this is the only study investigating the relative importance of fiscal transparency and participation in budgeting. The study suggests that “top-down” external auditing trumps “bottom-up” grassroots participation in project monitoring. Yet, this does not mean that any kind of participation has no effect. Moreover, the audit treatment included their delivery by the auditors to a special village meeting, which meant that “retribution from the village” was a potential sanction. Thus, a form of participation was built into the audit treatment, and cannot be disentangled from the mere disclosure of audit information. Further work is needed along these lines in order to rigorously assess different types of participation interventions (see also Olken 2010), and how they may or may not amplify any impacts of information disclosure.
A Guide for Future Research
This first systematic review of evidence on the impacts of fiscal openness assesses 38 studies that empirically investigate the effect of government disclosure of budgetary information or of mechanisms for public participation in the budget process on different outcomes, using qualitative or quantitative methods. Most studies fall into three main impact categories: macro-fiscal, resource allocation and service delivery, and governance. A fourth category—development outcomes—contains only a small number of studies.
The evidence on the link between fiscal openness and different macro-fiscal outcomes, such as indicators of fiscal discipline, is typically based on broad measures of transparency. This work links transparency to reduced deficits, debt, borrowing costs, and creative accounting. Only a handful of studies in this category investigate the role of specific components of budget transparency. Evidence on resource allocation and service delivery mainly considers participatory mechanisms. This work is no longer limited to the well-documented Brazilian experience with participatory budgeting, and provides insights on why certain mechanisms may work better than others.
Looking at governance, findings are more varied, also because studies use different definitions and measures. Cross-country studies document a negative correlation between (fiscal) transparency and corruption, but they cannot make strong causal claims. Evidence from Uganda, Indonesia, and Brazil provides much richer accounts of how specific disclosures of budget information can reduce corruption and promote accountability by incentivizing citizens to monitor governments, and public officials to refrain from corrupt behavior. It also appears that participatory mechanisms widen citizen involvement and mobilization. Findings on how fiscal openness affects development outcomes are scarce, but suggest impacts on education in Uganda and health in Brazil.
The quality of the evidence varies. The most convincing work—a small number of experiments and natural or quasi-experimental studies—documents impacts that many would consider beneficial: lower government borrowing costs due to macro-fiscal disclosure (Glennerster and Shin 2008), lower corruption due to audits (Olken 2007) and the publication of budget execution information (Reinikka and Svensson 2011), electoral consequences for politicians when audits suggest malfeasance (Ferraz and Finan 2008), and improved budget allocations due to citizen participation (Beath, Christia, and Enikolopov 2012; Olken 2010). While this is a surprisingly small collection of papers, the overall direction of this high-quality evidence is consistent.
How do these findings relate to the theory of change that we sketched earlier? Only some of the linkages in figure 1 are backed by sufficient evidence. The documented links of general forms of transparency are limited to intermediate steps, in particular macro-fiscal outcomes, in the longer chain leading to development outcomes. Further down the chain, the evidence highlights how specific and locally-relevant disclosures, especially on budget execution and audits, can improve governance outcomes. Moreover, mechanisms enabling direct citizen participation in budgetary decisions provide feedback loops so that governments learn about citizens’ needs and priorities and can better respond to them. On the other hand, the existing literature sheds very little light on the link between transparency and participation, or between some of the earlier and later steps in the theory of change. For example, the evidence on participation offers little guidance on the types of fiscal disclosures that form the basis for engaging citizens, and the mechanisms leading to improved development outcomes are not clear. We identify several specific gaps and open questions for further research.
First, a largely untapped potential lies in disaggregating broad transparency measures to examine which specific disclosures are related to outcomes. For example, the Open Budget Index provides a detailed assessment of a package of eight budget documents. It is possible to distinguish fiscal disclosure across each document or stage of the budget process (drafting, approval, execution, and audit). Similarly, transparency on the revenue and expenditure sides could be distinguished (or specific disclosures within these, such as natural resource revenues). Without such disaggregation, the absolute and relative contribution of specific elements is unclear, and policy implications lack specificity. For instance, to contain public debt, should a government strengthen in-year execution updates or the quality of its budget proposal (and which part of the latter)? When reform has to be phased, it can be essential to target the greatest gains and quick results—not least to build the case for further changes. Similarly, what specific disclosures mobilize citizens and render participation more effective? Are citizens more interested in budget allocations, or in what was actually spent, and how do they react to and use such information in holding politicians and bureaucrats to account? Evidence on these questions would have immediate policy relevance.
A second and related point is that a greater focus on specific interventions may also enable scholars to better trace the mechanism through which they affect the quality of people’s lives. Perhaps the best example of this is the work by Reinikka and Svensson (2011), who investigate the chain from a transparency intervention in budget execution to impacts on school enrollment and learning outcomes. Most other research has focused on smaller segments of the causal chain represented in figure 1, and there is potential to follow the example of this work by examining how specific interventions affect development outcomes, including over longer periods of time.
Third, with very few exceptions (notably Olken 2007 and 2010), the evidence thus far tells us little about the relationships and trade-offs between different interventions, and their relative effectiveness. For example, how do different types of participation (such as consultative or monitoring meetings) compare against particular disclosures (such as audits or in-year execution information) in terms of their impact on the leakage of funds and service delivery? Further, is the disclosure of execution information more effective in curbing corruption when it is complemented with a participatory monitoring opportunity? Finding answers to such questions requires studies of alternative interventions and their various combinations within the same research design. The role of such research in enhancing service delivery and development in poor countries is potentially large.
A fourth question is how fiscal transparency and participation in budgeting affect one another. Existing research into this complex area is limited, partly due to diverging views and emphases among major proponents of fiscal openness. For some, especially the IMF, macroeconomic stability is the ultimate goal. Here, the focus is on fiscal transparency and its effects on macro-fiscal outcomes. Others, such as development practitioners and civil society actors, are often more interested in promoting participation to affect allocations, service delivery, and governance. Partly as a result, research has tended to focus on one of the main components, less on how they affect one another, with only a few exceptions (Khagram, Fung, and de Renzio 2013). Fundamental questions remain in this area. For example, under what conditions does fiscal disclosure lead to greater participation in budgetary decisions? When and how does participation, in turn, lead to greater demand for fiscal transparency? Rigorous examination of this potentially reciprocal relationship could help to assess the case for enhancing participation in budgetary decisions.
Finally, future research should generate insights relating to the conditions under which fiscal openness interventions have a particular effect. Thus far, the cross-national research on macro-fiscal impacts of fiscal transparency, despite methodological limitations of this approach, yields arguably the strongest case that the results hold more generally. Yet, several studies suggest conditioning factors. Reinikka and Svensson (2011) and Ferraz and Finan (2008) show that the media can play a decisive mediating role. The impact of additional fiscal disclosures may also depend on the initial level of transparency (Heald 2003). With regard to participatory budgeting, Bräutigam (2004) notes that left-wing parties tend to favor pro-poor spending policies. Hence, they also have the strongest incentives to introduce participatory mechanisms that bring previously excluded groups into the decision-making process and legitimize reprioritization. It is less clear whether participatory budgeting is linked to similar outcomes in politically less receptive environments (see Kosack and Fung 2014). More explicitly comparative work could investigate crucial scope conditions.
Existing research documents a link between fiscal openness and a number of desirable outcomes. Yet, proponents of fiscal openness often struggle to convince skeptical governments to take the risk of pursuing institutional changes in this area. Addressing the above gaps would go a long way in strengthening the evidence base.
Notes
Paolo de Renzio is a Senior Research Fellow at the International Budget Partnership. He can be contacted at [email protected]. Joachim Wehner is Associate Professor in Public Policy at the London School of Economics and Political Science. He can be contacted at [email protected]. The authors thank Hugh Batrouney for outstanding research assistance, as well as Jim Alt, Alta Fölscher, Jonathan Fox, Juan Pablo Guerrero, Tim Irwin, Sanjeev Khagram, Mareike Kleine, Steve Kosack, Victoria Louise Lemieux, Ian Lienert, Greg Michener, Murray Petrie, Nicola Smithers, Martin J. Williams, as well as three anonymous reviewers and the journal editor, Peter Lanjouw, for helpful comments and suggestions. Previous versions of this paper were presented at the 2015 Annual Meeting of the American Political Science Association, and at a workshop hosted by Greg Michener at the Fundação Getúlio Vargas in Rio de Janeiro. This work was supported by the Global Initiative for Fiscal Transparency (GIFT).
See https://www.imf.org/external/np/fad/trans/, accessed March 2, 2015.
Recommendations are a formal instrument of the OECD, with which member countries should comply.
GIFT defines itself as “a multi-stakeholder action network working to advance and institutionalize global norms and significant, continuous improvements in fiscal transparency, participation, and accountability in countries around the world.” See http://fiscaltransparency.net/, accessed March 2, 2015.
For other skeptical views of transparency, see Bac (2001), Etzioni (2014), and comments by Francis Fukuyama that spurred a lively debate: http://www.the-american-interest.com/2015/01/04/the-limits-of-transparency/, accessed September 30, 2015.
The paper by Kosack and Fung was part of a research project funded by the Transparency and Accountability Initiative (TAI), a donor collaborative working to expand the impact and scale of such interventions. See http://www.transparency-initiative.org/about, accessed March 2, 2015. Fox’s work was commissioned by the Global Partnership for Social Accountability (GPSA), a World Bank initiative. See http://www.thegpsa.org/sa/, accessed March 2, 2015.
For reasons of time and capacity, we limit ourselves to research published in the English language. Moreover, all leading academic journals in the relevant disciplines are published in English.
Fox (2014), Joshi (2013), and Kosack and Fung (2014) review these studies.
The terms “quasi-experiment” and “natural experiment” are sometimes used interchangeably. However, as Dunning (2012) points out, only natural experiments are based on randomly assigned treatments, whereas quasi-experiments have nonrandom assignment. Hence, empirical evidence from the latter tends to be weaker.
Of course, economic or social development may also affect governance outcomes. In this instance, we highlight a core relationship posited, often implicitly, by proponents of fiscal openness.
See https://www.imf.org/external/np/fad/trans/, accessed March 3, 2015.
The “Public Participation Spectrum” of the International Association for Public Participation (IAP2) orders different mechanisms based on their intensity of public involvement: http://www.iap2.org.au/resources/iap2s-public-participation-spectrum, accessed March 3, 2015. From weakest to strongest, participation can be used to inform, consult, involve, collaborate, and empower. The mechanisms in the surveyed literature span the whole range, with citizen surveys at the weaker end, and participatory budgeting as the strongest form that puts citizens in charge of specific decisions.
We thus exclude studies of legislative participation from the scope of this review, unless they examine public participation via a legislative body. Wehner (2014) reviews the literature on legislatures and public finance.
For example, the Open Budget Index assesses the availability and quality of the pre-budget statement, the executive budget proposal and supporting documents, the budget law as enacted by the legislature, in-year reports, a mid-year review, the year-end report, audit reports, and popular versions in the form of a “citizen budget” (International Budget Partnership 2012).
In this review, we count some related publications as a single study and cite the 2011 paper.
Hameed (2005) develops sub-indices on data assurances, medium-term budgeting, budget execution reporting, and fiscal risk disclosure.
The World Bank’s (1998) Public Expenditure Management Handbook popularized three levels of budget outcomes: aggregate fiscal discipline; resource allocation and use based on strategic priorities; and efficiency and effectiveness of programs and service delivery. This is a reformulation of an older framework (Schick 1966). We summarize impacts in the first category separately, as they make up a significant share of the literature.
Elsewhere, Alesina etal. (1999) develop a ten-item index of budget institutions in Latin America. Their analysis includes a subindex they interpret as “an indirect measure of transparency”, which captures bailout practices and the borrowing autonomy of subnational governments and public enterprises. These are crucial aspects of fiscal management, but they are not closely related to the quality of budget information.
Alt etal. (2014) highlight transactions in shares and other equity, as well as the recording of “other accounts payable”. Consistent with the former result, Seiferling and Shamsuddin (2015) find that fully transparent governments generate between 6 and 8 percent higher returns on their equity portfolios than others (see also Seiferling 2013).
The nature of impacts and their substantive importance are linked to the nature of a fiscal openness intervention. Direct public involvement in budgetary decisions establishes a clear potential link to resource allocation and service delivery. However, it remains an empirical question to what extent “weaker” forms of participation, or fiscal transparency interventions, may yield similar impacts as well. Without further empirical research that identifies causal effects of a diverse set of fiscal openness interventions, it is impossible to judge their substantive importance in relative and absolute terms. We return to this point in the conclusion.
References
Budget Transparency Initiative. n.d. “Budget Transparency: What, Why, and How? Using Budgets to Empower People.” Washington, DC, The World Bank.
Appendix: Overview of studies included in the review
| Author(s) | Date | Independent variable category | Main impact category (secondary categories) | Quantitative | Empirical context |
|---|---|---|---|---|---|
| Alt & Lassen | 2006a | Transparency | Macro-fiscal outcomes | Yes | 19 OECD countries, 1989-1998 |
| Alt & Lassen | 2006b | Transparency | Macro-fiscal outcomes | Yes | 19 OECD countries, 1989-1998 |
| Alt & Lowry | 2010 | Transparency | Governance (macro-fiscal outcomes) | Yes | U.S. states, 1972-2002 |
| Alt etal. | 2014 | Transparency | Macro-fiscal outcomes | Yes | 14 EU countries, 1990–2007 |
| Alt etal. | 2002 | Transparency | Governance (macro-fiscal outcomes) | Yes | U.S. states, 1986-1995 (cross-section) |
| Arbatli & Escolano | 2012 | Transparency | Macro-fiscal outcomes | Yesa | 56 OECD and developing countries, 2010 |
| Bastida & Benito | 2007 | Transparency | Governance | Yesb | 41 OECD and non-OECD countries, 2003 |
| Benito & Bastida | 2009 | Transparency | Macro-fiscal outcomes | Yesb | 41 OECD and non-OECD countries, 2003 |
| Bernoth & Wolff | 2008 | Transparency | Macro-fiscal outcomes | Yes | 15 EU countries, 1991-2005 |
| Blume & Voigt | 2013 | Transparency | Macro-fiscal outcomes | Yesb | 47 OECD and non-OECD countries, 1990-2000 (cross-section) |
| Ferraz & Finan | 2008 | Transparency | Governance | Yes** | 373 municipalities in Brazil, 2003-2005 |
| Fukuda-Parr etal. | 2011 | Transparency | Development | Yesb | 84 countries, 2008 |
| Gelos & Wei | 2005 | Transparency | Macro-fiscal outcomes | Yes | 137 funds, 1996-2000 |
| Glennerster & Shin | 2008 | Transparency | Macro-fiscal outcomes | Yes*** | 23 emerging market economies, 1999-2002 (quarterly data) |
| Hameed | 2011 | Transparency | Macro-fiscal outcomes | Yes | 68 countries, 2004-2009 (monthly data) |
| Hameed | 2005 | Transparency | Macro-fiscal outcomes (governance) | Yesb | 57 countries, 1998-2002 (cross-section) |
| Hubbard | 2007 | Transparency | Governance | No | Uganda |
| Islam | 2006 | Transparency | Governance | Yesb | 170 countries, 2002 |
| Lindstedt & Naurin | 2010 | Transparency | Governance | Yesb | 110 countries, 2000s (cross-section) |
| Reinikka & Svensson | 2011 | Transparency | Governance (development) | Yes*** | 218 Ugandan primary schools, 1996 and 2002 |
| von Hagen & Harden | 1995 | Transparency | Macro-fiscal outcomes | Yesb | 12 EU countries, 1981-1990 (cross-section) |
| Wang etal. | 2014 | Transparency | Macro-fiscal outcomes | Yes | U.S. states, 562 issuances of bonds, 1986-2012 |
| Weber | 2012 | Transparency | Macro-fiscal outcomes | Yes | 87 countries, 1980-2010 |
| Beath et al. | 2012 | Participation | Allocation and delivery | Yes* | 250 Afghan villages, 2007-2009 |
| Besley etal. | 2005 | Participation | Allocation and delivery | Yes | 522 villages in four states in South India, 2002 |
| Boulding & Wampler | 2010 | Participation | Development | Yes | 220 Brazilian municipalities, 1996-2000 |
| Bräutigam | 2004 | Participation | Allocation and delivery | No | Case studies of Brazil, Ireland, Chile, Mauritius, and Costa Rica |
| de Sousa Santos | 1998 | Participation | Allocation and delivery | No | Porto Alegre, Brazil |
| Diaz-Cayeros etal. | 2010 | Participation | Allocation and delivery | Yes | 570 municipalities in Oaxaca, Mexico, 1990-2010 |
| Goldfrank & Schneider | 2006 | Participation | Governance | No | Rio Grande do Sul, Brazil, 1999-2002 |
| Gonçalves | 2014 | Participation | Development | Yes | 3651 Brazilian municipalities, 1990-2004 |
| Heller etal. | 2007 | Participation | Development | Yes | 72 local governments in Kerala, India, 2002 |
| Jaramillo & Wright | 2015 | Participation | Allocation and delivery | Yes | 100 Peruvian municipalities, 2001 and 2007 |
| Olken | 2010 | Participation | Allocation and delivery | Yes* | 49 Indonesian villages, 2005-2006 |
| Simonsen & Robbins | 2000 | Participation | Allocation and delivery | Yes* | Eugene, Oregon, US, 1991-1992 |
| Touchton & Wampler | 2014 | Participation | Governance (allocation and delivery; development) | Yes | 253 Brazilian municipalities, 1989-2008 |
| Watson etal. | 1991 | Participation | Allocation and delivery | Yes | Auburn, Alabama, US, 1985-1990 |
| Olken | 2007 | Transparency and participation | Governance | Yes* | 608 Indonesian villages, 2003-2004 |
Note: Entries are grouped by independent variable category.
Field experiment.
Natural experiment (random assignment of treatment).
Quasi-experiment (non-random assignment of treatment).
Outcomes are measured for one year or time period, but the analysis accounts for initial conditions. bPurely cross-national analysis with no within-country variation over time.
| Author(s) | Date | Independent variable category | Main impact category (secondary categories) | Quantitative | Empirical context |
|---|---|---|---|---|---|
| Alt & Lassen | 2006a | Transparency | Macro-fiscal outcomes | Yes | 19 OECD countries, 1989-1998 |
| Alt & Lassen | 2006b | Transparency | Macro-fiscal outcomes | Yes | 19 OECD countries, 1989-1998 |
| Alt & Lowry | 2010 | Transparency | Governance (macro-fiscal outcomes) | Yes | U.S. states, 1972-2002 |
| Alt etal. | 2014 | Transparency | Macro-fiscal outcomes | Yes | 14 EU countries, 1990–2007 |
| Alt etal. | 2002 | Transparency | Governance (macro-fiscal outcomes) | Yes | U.S. states, 1986-1995 (cross-section) |
| Arbatli & Escolano | 2012 | Transparency | Macro-fiscal outcomes | Yesa | 56 OECD and developing countries, 2010 |
| Bastida & Benito | 2007 | Transparency | Governance | Yesb | 41 OECD and non-OECD countries, 2003 |
| Benito & Bastida | 2009 | Transparency | Macro-fiscal outcomes | Yesb | 41 OECD and non-OECD countries, 2003 |
| Bernoth & Wolff | 2008 | Transparency | Macro-fiscal outcomes | Yes | 15 EU countries, 1991-2005 |
| Blume & Voigt | 2013 | Transparency | Macro-fiscal outcomes | Yesb | 47 OECD and non-OECD countries, 1990-2000 (cross-section) |
| Ferraz & Finan | 2008 | Transparency | Governance | Yes** | 373 municipalities in Brazil, 2003-2005 |
| Fukuda-Parr etal. | 2011 | Transparency | Development | Yesb | 84 countries, 2008 |
| Gelos & Wei | 2005 | Transparency | Macro-fiscal outcomes | Yes | 137 funds, 1996-2000 |
| Glennerster & Shin | 2008 | Transparency | Macro-fiscal outcomes | Yes*** | 23 emerging market economies, 1999-2002 (quarterly data) |
| Hameed | 2011 | Transparency | Macro-fiscal outcomes | Yes | 68 countries, 2004-2009 (monthly data) |
| Hameed | 2005 | Transparency | Macro-fiscal outcomes (governance) | Yesb | 57 countries, 1998-2002 (cross-section) |
| Hubbard | 2007 | Transparency | Governance | No | Uganda |
| Islam | 2006 | Transparency | Governance | Yesb | 170 countries, 2002 |
| Lindstedt & Naurin | 2010 | Transparency | Governance | Yesb | 110 countries, 2000s (cross-section) |
| Reinikka & Svensson | 2011 | Transparency | Governance (development) | Yes*** | 218 Ugandan primary schools, 1996 and 2002 |
| von Hagen & Harden | 1995 | Transparency | Macro-fiscal outcomes | Yesb | 12 EU countries, 1981-1990 (cross-section) |
| Wang etal. | 2014 | Transparency | Macro-fiscal outcomes | Yes | U.S. states, 562 issuances of bonds, 1986-2012 |
| Weber | 2012 | Transparency | Macro-fiscal outcomes | Yes | 87 countries, 1980-2010 |
| Beath et al. | 2012 | Participation | Allocation and delivery | Yes* | 250 Afghan villages, 2007-2009 |
| Besley etal. | 2005 | Participation | Allocation and delivery | Yes | 522 villages in four states in South India, 2002 |
| Boulding & Wampler | 2010 | Participation | Development | Yes | 220 Brazilian municipalities, 1996-2000 |
| Bräutigam | 2004 | Participation | Allocation and delivery | No | Case studies of Brazil, Ireland, Chile, Mauritius, and Costa Rica |
| de Sousa Santos | 1998 | Participation | Allocation and delivery | No | Porto Alegre, Brazil |
| Diaz-Cayeros etal. | 2010 | Participation | Allocation and delivery | Yes | 570 municipalities in Oaxaca, Mexico, 1990-2010 |
| Goldfrank & Schneider | 2006 | Participation | Governance | No | Rio Grande do Sul, Brazil, 1999-2002 |
| Gonçalves | 2014 | Participation | Development | Yes | 3651 Brazilian municipalities, 1990-2004 |
| Heller etal. | 2007 | Participation | Development | Yes | 72 local governments in Kerala, India, 2002 |
| Jaramillo & Wright | 2015 | Participation | Allocation and delivery | Yes | 100 Peruvian municipalities, 2001 and 2007 |
| Olken | 2010 | Participation | Allocation and delivery | Yes* | 49 Indonesian villages, 2005-2006 |
| Simonsen & Robbins | 2000 | Participation | Allocation and delivery | Yes* | Eugene, Oregon, US, 1991-1992 |
| Touchton & Wampler | 2014 | Participation | Governance (allocation and delivery; development) | Yes | 253 Brazilian municipalities, 1989-2008 |
| Watson etal. | 1991 | Participation | Allocation and delivery | Yes | Auburn, Alabama, US, 1985-1990 |
| Olken | 2007 | Transparency and participation | Governance | Yes* | 608 Indonesian villages, 2003-2004 |
Note: Entries are grouped by independent variable category.
Field experiment.
Natural experiment (random assignment of treatment).
Quasi-experiment (non-random assignment of treatment).
Outcomes are measured for one year or time period, but the analysis accounts for initial conditions. bPurely cross-national analysis with no within-country variation over time.
