We further explore the negative trend observed above by studying the relation for H
ii regions within other BCDs. Note here that all the observational studies mentioned in the beginning of Section
4.1 are based on the H
ii regions in different low-metallicity star-forming galaxies. None of those analyses involve the study of the relation at spatially resolved scale in a single galaxy. Fig.
20 shows this relation for star-forming regions in 10 BCDs, where data points in same colour correspond to the star-forming regions in the same BCD. We have compiled the data based on the following criteria: (1) All regional values are from the integrated spectra obtained from the IFS observations. (2) The regions are selected on the basis of H α maps of BCDs. (3) The values of log(N/O) and 12 + log(O/H) are measured using the direct T
e method. In Table
5,
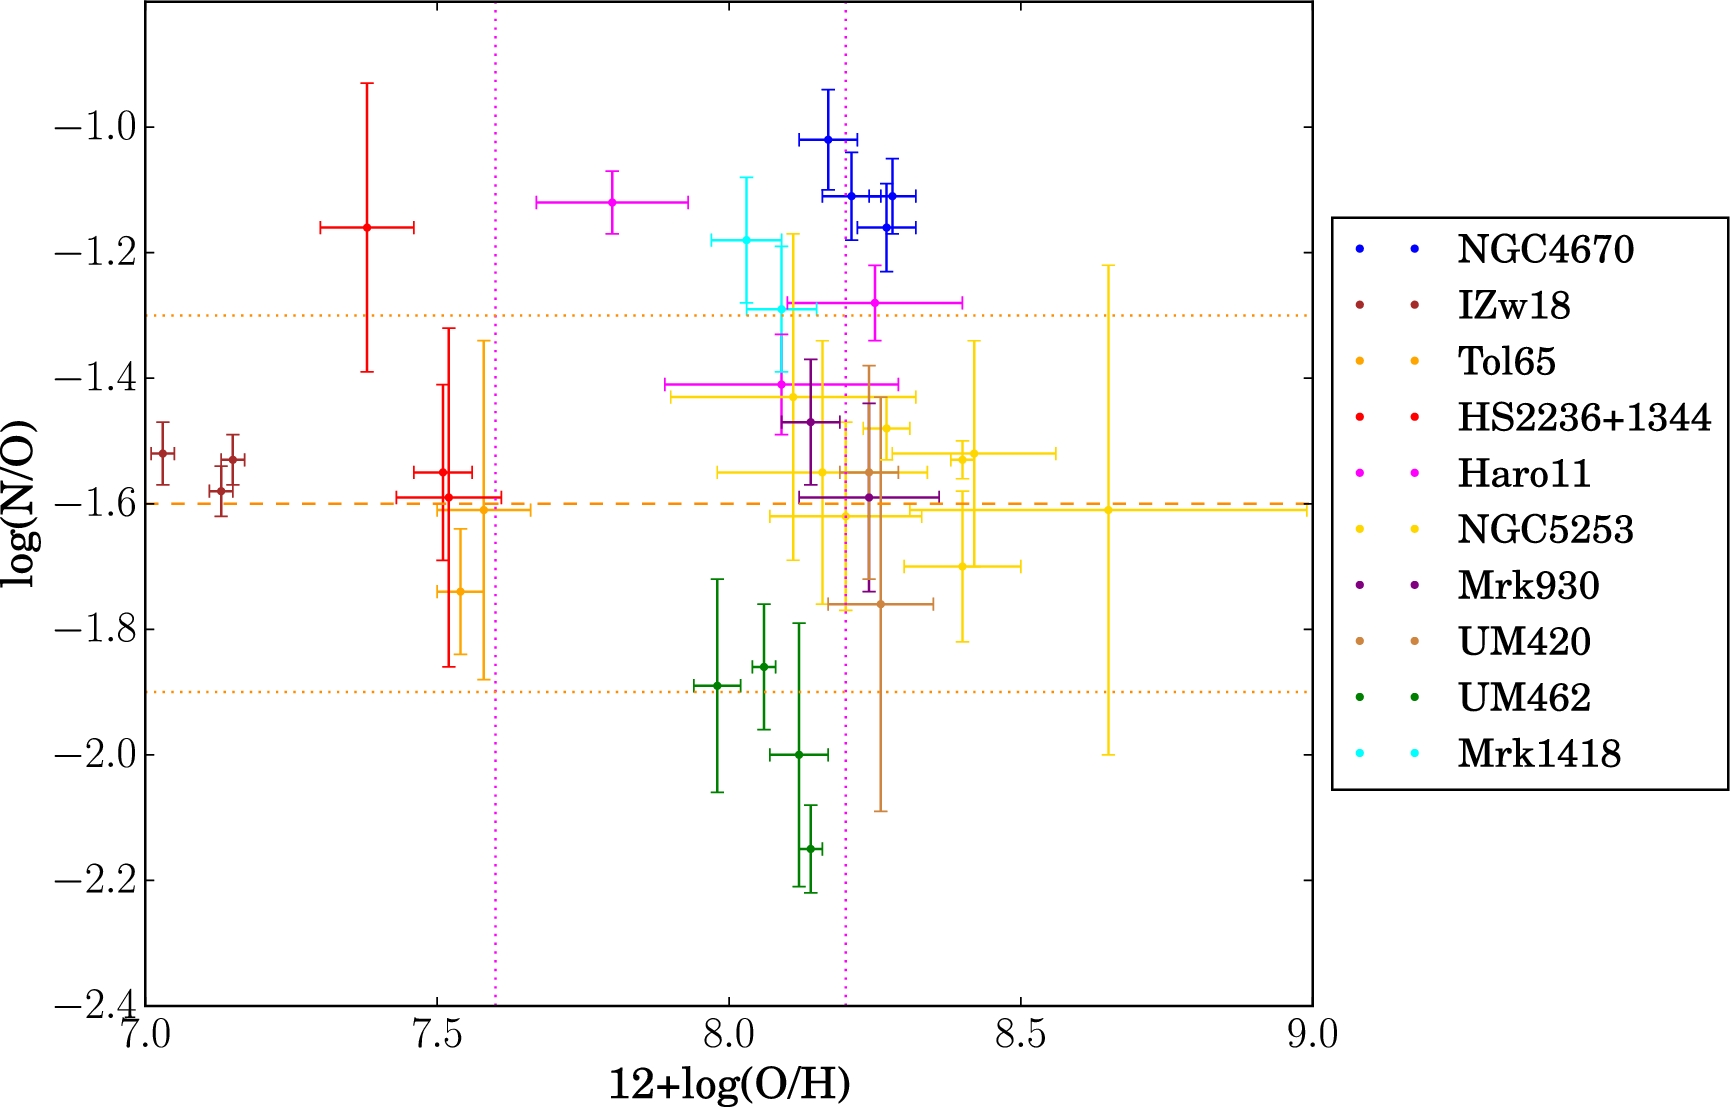
Figure 20.
log(N/O) versus 12 + log(O/H) of H ii regions within BCDs, where data points in the same colour correspond to the H ii regions from the same BCD. See Table 5 for the data reference. The orange dashed line indicates the plateau at log(N/O) = −1.6, and the orange dotted lines correspond to ±0.3 dex enclosing the region of scatter found in the literature (e.g. Izotov & Thuan 1999). The vertical pink dotted lines at metallicity 12 + log(O/H) = 7.6 define the transition from low- to intermediate-metallicity regime and the transition from the intermediate-metallicity regime to the high-metallicity regime at 12 + log(O/H) = 8.2.
Table 5.References and distances of the BCDs shown in Fig. 20.
| BCDs
. | References
. | Distance (Mpc)
. |
|---|
| NGC 4670 | This study | 18.6 |
| IZw18 | Kehrig et al. (2016) | 18.2 |
| Tol 65 | Lagos et al. (2016) | 42.7 |
| HS2236+1344 | Lagos et al. (2014) | 79.7 |
| Haro11 | James et al. (2013b) | 83.6 |
| NGC 5253 | Westmoquette et al. (2013) | 3.8 |
| Mrk930 | Pérez-Montero et al. (2011) | 83.2 |
| UM420 | James et al. (2010) | 23.8 |
| UM462 | James et al. (2010) | 14.4 |
| Mrk1418 | Cairós et al. (2009) | 14.6 |
we specify a reference for each data set. Two separate IFU studies were performed for NGC 5253, but we analyse data from Westmoquette et al. (
2013), which includes the star-forming regions studied in Monreal-Ibero, Walsh & Vílchez (
2012).