


The severity of Helicobacter pylori infection is determined by the interplay between bacterial virulence, host genetic and environmental factors. This study aimed to identify interleukin-1 beta (IL-1β) and interleukin receptor antagonist (IL-1RN) gene polymorphisms and their associations with H. pylori infection, and severity of chronic gastritis in Egyptian children.
A case control study was conducted on 100 children (50 H. pylori positive and 50 controls). Genotyping of IL-1β-31 gene was done by PCR-CTPP (confronting two-pair primers), of IL-1β-511 was performed using allele specific PCR, and investigation of the variable number tandem repeat polymorphism of the IL-1RN gene was done by PCR.
The genotype C/T of IL1β-511 was the predominant genotype (36/50; 72%) among H. pylori positive cases (p ≤ 0.001). The presence of C/T genotype at position 511 of IL1β was associated with increased risk of infection with H. pylori (p ≤ 0.001, odds ratio = 6.612) and with more severe disease (p = 0.004, odds ratio = 8.333). No association of IL-1β-31 or IL-1RN gene polymorphisms with H. pylori infection or with risk of severe gastric diseases was found. Children who carry two polymorphisms are almost four times at risk for development of H. pylori infection (p = 0.026, odds ratio = 3.937).
Polymorphism at position -511 of IL1β gene is associated with increased risk of H. pylori infection as well as of severe corpus gastric disease in Egyptian children. This population should be considered a high-risk group, which needs regular gastric endoscopic surveillance, and should be target for H. pylori eradication.
Lay summary
The genotype C/T of IL1β-511 gene was the predominant genotype (36/50; 72%) among H. pylori positive children. Polymorphism at position -511 of IL1β gene is associated with increased risk of Helicobacter pylori infection as well as of severe corpus gastric disease in Egyptian children. No association of IL-1β-31 or IL-1RN gene polymorphisms with H. pylori infection or with risk of severe gastric diseases in Egyptian children.
INTRODUCTION
Helicobacter pylori infection is a common health problem in pediatric population. More than 50% of the world's population is infected with H. pylori, which is mainly acquired during the first 5 years of life and is related to poor socioeconomic conditions [1].
Bacterial virulence factors alone are not sufficient to explain the diversity and the severity of H. pylori induced gastro-duodenal diseases. The host immune response may play a key role in H. pylori-associated diseases through the stimulation of production of pro-inflammatory cytokines induced by contact of the microorganism with gastric epithelium [2].
The interleukin-1 (IL-1) gene is located on chromosome 2q and contains three related genes; IL-1A, IL-1β and interleukin receptor antagonist (IL-1RN), which encode the pro-inflammatory cytokines IL-1α and IL-1β as well as ILRA (endogenous receptor antagonist), respectively [3]. IL-1β is known to be upregulated in H. pylori infection, which is considered advantageous to eradication of the microbe. However, IL1β is also a potent inhibitor of gastric acid secretion, which may help the extension of the area colonized by H. pylori [4]. Subsequently, H. pylori-associated gastritis could gradually progress to a more severe disease. Since this progression occurs in only some patients, then genetic and environmental factors might have a role in this process [5].
Several studies in adults and pediatrics demonstrated that polymorphisms in IL-1β -31 and IL-1β -511 promotor regions as well as in VNTR (variable number tandem repeats) intron 2 of ILRN gene are associated with increased production of IL-1β and increase risk of more severe disease [6, 7].
However, none of the researches has investigated this relationship in Egyptian pediatric population. The aim of this study was to evaluate the association between three polymorphisms; two of them in the non-coding promotor regions of IL-1 β host genes (at positions -511 and -31), and one in the receptor antagonist (ILRN) gene and H. pylori-associated chronic gastritis, in an attempt to assist in the early identification of children at high risk of developing severe gastric disease.
SUBJECTS AND METHODS
A case control study was conducted on 100 children, aged 1–16 years complaining of symptoms suggestive of gastritis, who were referred to the Pediatric Gastroenterology Unit at Alexandria University Children’s Hospital for upper GI endoscopy. The sample size of 80 children (40 per group) calculated using Epi-info7 software was enough to achieve 80% study power and 95% confidence limits. We increased the sample size to 100 children to control for attrition (withdrawal) bias. The 100 children were divided into 2 study groups, 50 H. pylori positive patients and 50 H. pylori negative controls. The two groups were age and sex matched.
Children with history of previous gastric surgery, severe malnutrition, weight <60% of the expected, systemic infections and serious underlying diseases, history of using antibiotics, non-steroidal anti-inflammatory drugs, H2 blockers, or proton pump inhibitors within the previous 2 weeks were excluded from the study.
An informed consent was obtained from the parents or caregivers and ethical approval was obtained from the Ethics Committee of Alexandria, Faculty of Medicine.
All study subjects were subjected to the following:
Demographic data collection, thorough history taking with emphasis on abdominal symptoms, hematemesis and family history as well as thorough clinical and upper gastro-intestinal endoscopic examination.
Sample collection.
At least five gastric biopsies (antrum, corpus) were obtained during endoscopy from all study subjects. One biopsy was used for bedside screening rapid urease test (CLOtest, HALYARD). Four biopsies were examined by histopathology.
Three ml of blood were collected in EDTA tubes and were transported immediately to the Alexandria University Microbiology laboratory for testing gene polymorphism.
Laboratory routine investigations: complete blood count was performed using automated analyzers.
Histopathological examination . The biopsy fragments were fixed with 10% formalin and stained by hematoxylin-eosin and Giemsa to examine the degree of involvement of the gastric mucosa and the presence of H. pylori respectively. Assessment of histopathological features of gastritis was done following the updated Sydney classification of gastritis [8].
Analysis of IL1β and ILRN polymorphism . The single nucleotide polymorphisms in IL-1β (31 T/C), (511 C/T) as well as the VNTRs polymorphism of IL-1RN were investigated.
DNA extraction
DNA was extracted from 200 μl whole blood by the use of a GENEJET whole blood DNA extraction kit (ThermoFisher SCIENTIFIC, Inc.) according to the manufacturer’s instructions.
Genotyping of IL-1β-31
It was performed using PCR-CTPP (confronting two-pair primers) as previously described [9]. The primers used for the C allele were 5′-ACT TCT GCT TTT GAA AGC C-3′ and 5′-TCA GCT GTT AGA TAA GCA G-3′and those for the T allele were 5′-AAT GTG GAC ATC AAC TGC A-3′ and 5′-CTC CCT CGC TGT TTT T A T A-3′.
The PCR amplification conditions consisted of 5 min of initial denaturation at 94°C, followed by 30 cycles of 1 min at 94°C, 1 min at 54°C, and 1 min at 72°C, followed by a final extension at 72°C for 5 min. Genotyping was assessed as follows; 345 and 574 bp for C/C homozygous genotype, 266 and 574 bp for homozygous T/T, and 266, 345 and 574 bp for C/T heterozygous genotype.
Genotyping of IL-1β-511
IL-1β- polymorphic site into the promoter region at position-511 was genotyped by a multiplexed mutagenic PCR assay using allele specific primers [10]. The following primer sequences were used: 5 pmol of the IL1β-511 C primer (5′-CCTGCAATTGACAGAGAGCTTCC-3′), 5 pmol of the IL1β-511 T primer (5′-CTCAGAGGCTAATGCAATTGACAGAGAGCACCT-3′), and 10 pmol of the IL1β-511 common reverse primer (5′-CGTTGTGCAGTTGATGTCCACATT-3′). The amplification cycling conditions consisted of: denaturation at 94°C for 5 min, followed by 35 cycles at 94°C for 30 s, 60°C for 30 s, and 72°C for 60 s, with a final extension step at 72°C for 7 min. The allele-specific PCR products were 279 bp for IL1β-511 (C) allele, 289 bp for IL1β-511 (T) allele. As the difference between the size of the two PCR product bands is very small (10 bp), the results of all PCR runs were confirmed by uniplex PCR for each allele separately.
Genotyping of IL-1RN
The 86 bp VNTR of intron 2 of IL-RN gene was amplified by PCR, as described previously 9, using the following PCR conditions: 95°C for 5 min and 30 cycles of 94°C, 60°C, 72°C for 60 s, and a final extension at 72°C for 5 min, and the following primer sequences: 5′-CTC AGC AAC ACT CCT AT-3′ and 5′-TCC TGG TCT GCA GGT AA-3′. Alleles were coded as follows: 2 repeat allele: 240 bp, 3 repeat allele: 326 bp, 4 repeat allele: 412 bp, 5 repeat allele: 498 bp, and 6 repeat allele: 614 bp. For simplicity and for statistical analysis purpose, these alleles were further classified as short allele (2) or long allele (L: 3–6). The genotyping patterns were classified as L/L, L/2 and 2/2 as reported by Machado, et al. [11].
All amplification reactions were performed in Applied Biosystems™ 2720 Thermal Cycler. All PCR products were detected by gel electrophoresis in 3% agarose gel stained with ethidium bromide.
Statistical analysis
The statistical analysis was performed using SPSS (version 20.1, Chicago, IL, USA). The population of the studied sample was explored to find its equilibrium using Hardy–Weinberg equation. The significance of the differences in the distribution of the genotypes between the study groups was calculated using the chi-square test. Logistic regression models were used to obtain odds ratios and 95% CI. Statistical significance was considered as p < 0.05.
RESULTS
The distribution of IL-1β-511 and ILRN genotypes among all study subjects (cases and controls) was in agreement with that predicted under the conditions of Hardy–Weinberg equilibrium (p = 0.971 and 0.607, respectively). Although genotype distribution of IL-1β-31 deviates from those expected under Hardy–Weinberg equilibrium (p = 0.001). This could be attributed to the small sample size as well as to our hospital-based control group.
The results of PCR genotyping of all studied gene polymorphisms are shown in Fig. 1. The distribution of different IL1β-511 genotypes showed a statistically significant difference between the two study groups (p = 0.001). The genotype C/T was the predominant genotype (36/50; 72%) among H. pylori positive cases (p ≤ 0.001). IL1β-511 C/T genotype carriers were 6.6 times more prone to infection with H. pylori than the carriers of other genotypes (p ≤ 0.001, OR = 6.612, 95% CI: 2.76–15.83). However, no statistically significant difference was found in the distribution of IL1β-511 alleles when comparing the two study groups (p = 0.777). The homozygous C/C genotype was the commonest (19/50; 38%) in H. pylori negative cases, followed by the T/T genotype (17/50; 34%; Table 1).
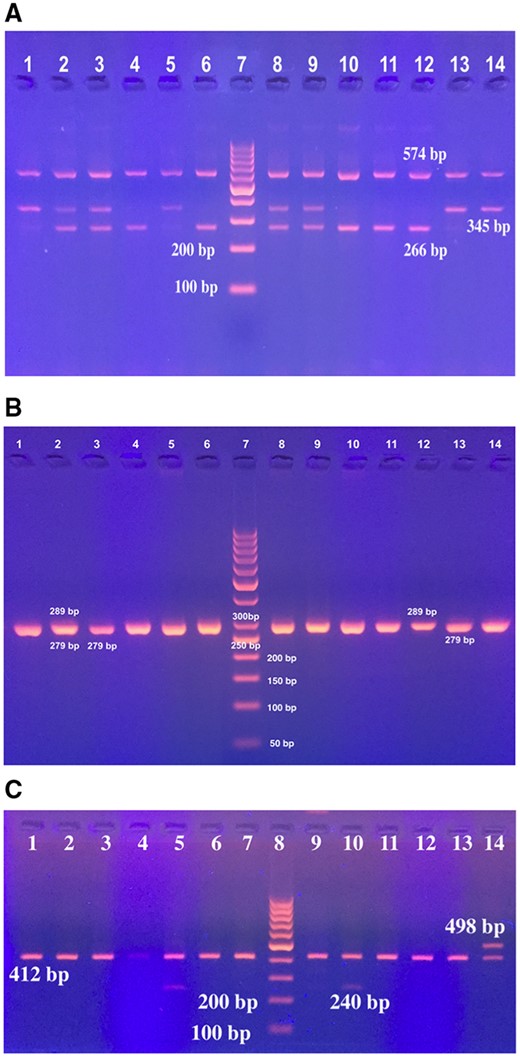
Gel stained with ethidium bromide showing the genotypes of (A) IL-1β-31, (B) IL1β -511 and (C) ILRN genes. (A) Lane 7: 100 bp DNA ladder; Lane 1, 5, 13, 14: IL1β-31 C/C genotype (345 and 574 bp); Lane 2, 3, 8, 9: IL1β-31 C/T genotype (266, 345 and 574 bp); Lane 4, 6, 10, 11, 12: IL1β-31 T/T genotype (266 and 574 bp). (B) Lane 7: 50 bp DNA ladder; Lane 1, 2, 4, 5, 6, 8, 9, 10: IL1β-511 C/T genotype (279 and 289 bp). Lane 3, 11, 13, 14: IL1β-511 C/C genotype (279 bp), and lane 12: IL1β-511 T/T genotype (289 bp). (C) Lane 8: 100 bp DNA ladder, Lane 5, 10: ILRN 2/4 (240 and 412 bp); lane 1-4, 6, 7, 9, 11-13: ILRN 4/4 (412 bp); lane 14: ILRN 4/5 (412 bp and 498 bp).
The distributions of IL1β and ILRN gene polymorphisms and haplotypes in H. pylori positive and negative patients
| H. pylori | χ2 or FE | p value | ||||
|---|---|---|---|---|---|---|
| Positive (n = 50) | Negative (n = 50) | |||||
| No. | % | No. | % | |||
| IL1β-31 genotype | 0.455 | 1.000 | ||||
| C/C | 1 | 2.0 | 2 | 4.0 | ||
| C/T | 30 | 60.0 | 30 | 60.0 | ||
| T/T | 19 | 38.0 | 18 | 36.0 | ||
| IL1β-31 allele | 0.090 | 0.764 | ||||
| C | 32 | 32.0 | 34 | 34.0 | ||
| T | 68 | 68.0 | 66 | 66.0 | ||
| IL1β-511 genotype | 19.947* | 0.001* | ||||
| C/C | 9 | 18.0 | 19 | 38.0 | ||
| C/T | 36 | 72.0 | 14 | 28.0 | ||
| T/T | 5 | 10.0 | 17 | 34.0 | ||
| IL1β-511 allele | 0.080 | 0.777 | ||||
| C | 54 | 54.0 | 52 | 52.0 | ||
| T | 46 | 46.0 | 48 | 48.0 | ||
| ILRN genotype | 1.052 | 0.811 | ||||
| 2/2 | 0 | 0.0 | 1 | 2.0 | ||
| 2/L | 11 | 22.0 | 12 | 24.0 | ||
| L/L | 39 | 78.0 | 37 | 74.0 | ||
| ILRN allele | 0.411 | 0.521 | ||||
| 2 | 11 | 11.0 | 14 | 14.0 | ||
| L | 89 | 89.0 | 86 | 86.0 | ||
| Number of polymorphisms | ||||||
| Absent | 8 | 16.0 | 12 | 24.0 | ||
| One | 14 | 28.0 | 25 | 50.0 | 10.063* | 0.018* |
| Two | 21 | 42.0 | 8 | 16.0 | ||
| Three | 7 | 14.0 | 5 | 10.0 | ||
| Haplotypes | ||||||
| C-C-2 | 8.0 | 6.0 | 0.332 | 0.564 | ||
| C-C-L | 20.0 | 15.0 | 1.099 | 0.295 | ||
| T-C-2 | 2.0 | 1.0 | 0.344 | 1.000 | ||
| T-C-L | 24.0 | 30.0 | 1.449 | 0.229 | ||
| C-T-2 | 1.0 | 3.0 | 1.042 | 0.617 | ||
| C-T-L | 3.0 | 10.0 | 4.332* | 0.037* | ||
| T-T-2 | 0.0 | 4.0 | 4.167 | 0.117 | ||
| T-T-L | 42.0 | 31.0 | 6.139* | 0.013* | ||
Combination of alleles in each haplotype is in the following order: (IL1β-31/IL1β-511/ILRN).
χ2, Chi square test. FE, Fisher exact.
Statistically significant at p ≤ 0.05.
Regarding IL1β-31, the heterozygous genotype C/T represented 60% (30/50) of H. pylori positive cases as well as of H. pylori negative cases, confirming a non- statistically significant difference in the distribution of genotypes (p = 1.000) or alleles (p = 0.764) between the two study groups (Table 1).
ILRN L/L genotype was the most commonly encountered in both H. pylori positive (39/50; 78%) and H. pylori negative group (37/50; 74%) with no statistically significant difference in the distribution of ILRN genotypes (p = 0.811) or ILRN alleles (p = 0.521) between the two groups (Table 1).
When comparing the number of polymorphisms (polymorphic genotypes) of the three investigated IL genes (IL-1β 511 C > T, IL-1β -31 T > C, ILRN 2/2 or 2/L) between the two study groups, it was found that 42% (21/50) of H. pylori positive cases carry two polymorphisms, whereas 50% of the H. pylori negative cases carry only one polymorphism (p = 0.018; Table 1). It was then confirmed that children who had two polymorphisms are almost four times at risk for development of H. pylori infection than children who lack these two polymorphisms (p = 0.026, OR = 3.937, 95% CI = 1.175–13.200).
Analysis of haplotypes of the three investigated genes (IL-1β-31/IL-1β-511/IL-1RN) revealed that 42% of H. pylori positive cases possess IL1β-31*T/IL1β-511*T/ILRN*L haplotype compared with 31% of H. pylori negative group with a statistically significant difference (p = 0.013). Although 10% of H. pylori negative cases possess IL1β-31*C/IL1β-511*T/ILRN *L haplotype compared with only 3% of H. pylori positive cases (p = 0.037). There was no statistically significant difference in the occurrence of other allelic combinations (Table 1).
According to Sydney classification, histological analysis of antral gastric biopsies showed 40% mild, 54% moderate and 4% severe chronic inflammation, 60% lymphoid follicles, 48% mild-moderate glandular atrophy and no intestinal metaplasia. Although the corpus histopathological examination revealed 42% mild, 54% moderate and 2% severe chronic inflammation, 44% lymphoid follicles, 60% mild glandular atrophy and no intestinal metaplasia.
The association between IL-1β and ILRN gene polymorphism and the severity of H. pylori induced chronic gastritis was investigated. There was no statistically significant difference between the three IL-1β-511 or -31 genotypes, or the two genotypes of ILRN gene regarding the gross endoscopic findings in H. pylori positive cases. Similarly, no statistically significant difference was found between the IL-1β-31 genotypes or ILRN genotypes and the histopathological findings of the gastric antrum or corpus. Although IL-1β-511 C/T genotype was significantly associated with corpus moderate chronic inflammation (p = 0.020), as well as with mild glandular atrophy (p = 0.030). Additionally, 80% of IL-1β-511 T/T genotypes genotype showed mild glandular atrophy (Table 2).
Relation between IL-1β and ILRN gene polymorphisms and histopathological findings in H. pylori positive cases
| IL-1β-511 | p value | IL-1β-31 | p value | ILRN gene | p value | ||||||||||||||
|---|---|---|---|---|---|---|---|---|---|---|---|---|---|---|---|---|---|---|---|
| C/C (n = 9) | C/T (n = 36) | T/T (n = 5) | C/C (n = 1) | C/T (n = 30) | T/T (n = 19) | 2/L (n = 11) | L/L (n = 39) | ||||||||||||
| No | % | No | % | No | % | No | % | No | % | No | % | No | % | No | % | ||||
| Histopathology of the antrum | |||||||||||||||||||
| Chronic inflammation | |||||||||||||||||||
| No inflammation | 0 | 0.0 | 1 | 2.8 | 0 | 0.0 | 0.504 | 0 | 0.0 | 1 | 3.3 | 0 | 0.0 | 0.548 | 0 | 0.0 | 1 | 2.6 | 0.378 |
| Mild | 5 | 55.6 | 13 | 36.1 | 2 | 40.0 | 0 | 0.0 | 10 | 33.3 | 10 | 52.6 | 6 | 54.5 | 14 | 35.9 | |||
| Moderate | 4 | 44.4 | 21 | 58.3 | 2 | 40.0 | 1 | 100 | 17 | 56.7 | 9 | 47.4 | 4 | 36.4 | 23 | 59.0 | |||
| Severe | 0 | 0.0 | 1 | 2.8 | 1 | 20.0 | 0 | 0.0 | 2 | 6.7 | 0 | 0.0 | 1 | 9.1 | 1 | 2.6 | |||
| Active inflammation | 0.453 | 0.427 | 0.638 | ||||||||||||||||
| No activity | 1 | 11.1 | 1 | 2.8 | 0 | 0.0 | 0 | 0.0 | 2 | 6.7 | 0 | 0.0 | 0 | 0.0 | 2 | 5.1 | |||
| Mild | 5 | 55.6 | 17 | 47.2 | 2 | 40.0 | 0 | 0.0 | 12 | 40.0 | 12 | 63.2 | 6 | 54.5 | 18 | 46.2 | |||
| Moderate | 3 | 33.3 | 17 | 47.2 | 2 | 40.0 | 1 | 100 | 14 | 46.7 | 7 | 36.8 | 4 | 36.4 | 18 | 46.2 | |||
| Severe | 0 | 0.0 | 1 | 2.8 | 1 | 20.0 | 0 | 0.0 | 2 | 6.7 | 0 | 0.0 | 1 | 9.1 | 1 | 2.6 | |||
| Lymphoid follicles | 0.896 | 0.290 | 0.489 | ||||||||||||||||
| Absent | 3 | 33.3 | 15 | 41.7 | 2 | 40.0 | 0 | 0.0 | 10 | 33.3 | 10 | 52.6 | 3 | 27.3 | 17 | 43.6 | |||
| Present | 6 | 66.7 | 21 | 58.3 | 3 | 60.0 | 1 | 100 | 20 | 66.7 | 9 | 47.4 | 8 | 72.7 | 22 | 56.4 | |||
| Glandular atrophy | 0.202 | 0.455 | 0440 | ||||||||||||||||
| No | 7 | 77.8 | 17 | 47.2 | 2 | 40.0 | 0 | 0.0 | 17 | 56.7 | 9 | 47.4 | 6 | 54.5 | 14 | 35.9 | |||
| Mild | 2 | 22.2 | 18 | 50.0 | 2 | 40.0 | 1 | 100 | 11 | 36.7 | 10 | 52.6 | 5 | 45.5 | 20 | 51.3 | |||
| Moderate | 0 | 0.0 | 1 | 2.8 | 1 | 20.0 | 0 | 0.0 | 2 | 6.7 | 0 | 0.0 | 0 | 0.0 | 5 | 12.8 | |||
| Intestinal metaplasia | – | – | – | ||||||||||||||||
| Absent | 9 | 100 | 36 | 100 | 5 | 100 | 1 | 100 | 30 | 100 | 19 | 100 | 11 | 100 | 39 | 100 | |||
| Present | 0 | 0.0 | 0 | 0.0 | 0 | 0.0 | 0 | 0.0 | 0 | 0.0 | 0 | 0.0 | 0 | 0.0 | 0 | 0.0 | |||
| Histopathology of the corpus | 0.020* | 0.953 | |||||||||||||||||
| Chronic inflammation | |||||||||||||||||||
| No inflammation | 1 | 11.1 | 0 | 0.0 | 0 | 0.0 | 0 | 0.0 | 1 | 3.3 | 0 | 0.0 | 0 | 0.0 | 1 | 2.6 | 0.447 | ||
| Mild | 6 | 66.7 | 11 | 30.6 | 4 | 80.0 | 0 | 0.0 | 12 | 40.0 | 9 | 47.4 | 4 | 36.4 | 17 | 43.6 | |||
| Moderate | 2 | 22.2 | 24 | 66.7 | 1 | 20.0 | 1 | 100 | 16 | 53.3 | 10 | 52.6 | 6 | 54.5 | 21 | 53.8 | |||
| Severe | 0 | 0.0 | 1 | 2.8 | 0 | 0.0 | 0 | 0.0 | 1 | 3.3 | 0 | 0.0 | 1 | 9.1 | 0 | 0.0 | |||
| Active inflammation | 0.511 | 0.917 | 0.672 | ||||||||||||||||
| No activity | 0 | 0.0 | 1 | 2.8 | 0 | 0.0 | 0 | 0.0 | 1 | 3.3 | 0 | 0.0 | 0 | 0.0 | 1 | 2.6 | |||
| Mild | 7 | 77.8 | 21 | 58.3 | 2 | 40.0 | 1 | 100 | 17 | 56.7 | 12 | 63.2 | 6 | 54.5 | 24 | 61.5 | |||
| Moderate | 2 | 22.2 | 13 | 36.1 | 2 | 40.0 | 0 | 0.0 | 10 | 33.3 | 7 | 36.8 | 4 | 36.4 | 13 | 33.3 | |||
| Severe | 0 | 0.0 | 1 | 2.8 | 1 | 20.0 | 0 | 0.0 | 2 | 6.7 | 0 | 0.0 | 1 | 9.1 | 1 | 2.6 | |||
| Lymphoid follicle | 0.471 | 0.149 | 0.734 | ||||||||||||||||
| Absent | 4 | 44.4 | 20 | 55.6 | 4 | 80.0 | 1 | 100 | 14 | 46.7 | 13 | 68.4 | 7 | 63.3 | 21 | 53.8 | |||
| Present | 5 | 55.6 | 16 | 44.4 | 1 | 20.0 | 0 | 0.0 | 16 | 53.3 | 6 | 31.6 | 4 | 36.4 | 18 | 46.2 | |||
| Glandular atrophy (mild) | 0.030* | 0.455 | 0.163 | ||||||||||||||||
| No | 7 | 77.8 | 12 | 33.3 | 1 | 20.0 | 0 | 0.0 | 15 | 46.7 | 6 | 31.6 | 2 | 18.2 | 18 | 46.2 | |||
| Mild | 2 | 22.2 | 24 | 66.7 | 4 | 80.0 | 1 | 100 | 16 | 53.3 | 13 | 68.4 | 9 | 81.8 | 21 | 53.8 | |||
| Moderate | 0 | 0.0 | 0 | 0.0 | 0 | 0.0 | 0 | 0.0 | 0 | 0.0 | 0 | 0.0 | 0 | 0.0 | 0 | 0.0 | |||
| Intestinal metaplasia | – | – | – | ||||||||||||||||
| Absent | 0 | 0.0 | 0 | 0.0 | 0 | 0.0 | 0 | 0.0 | 0 | 0.0 | 0 | 0.0 | 0 | 0.0 | 0 | 0.0 | |||
| Present | 0 | 0.0 | 0 | 0.0 | 0 | 0.0 | 0 | 0.0 | 0 | 0.0 | 0 | 0.0 | 0 | 0.0 | 0 | 0.0 | |||
bold phase*: statistically significant < 0.05.
Children who are carriers of the heterozygous genotype (C/T) are 8.33 times at risk to develop moderate–severe corpus gastritis than population that carries other genotypes (p = 0.004, OR = 8.333, 95% CI = 1.93–35.9). Furthermore, the presence of T allele (T/T or C/T) of IL-1β-511 gene increases the risk of corpus moderate–severe gastritis by six times (p = 0.024, OR = 6.067, 95% CI = 1.114–33.046) and of corpus mild glandular atrophy by seven times (p = 0.011, OR = 7.538, 95% CI = 1.372–41.413).
DISCUSSION
This study was designed to evaluate the possible role of IL-1β and ILRN genes polymorphism in host susceptibility to the acquisition of H. pylori infection and in the development of chronic gastritis. To the best of our knowledge, the effect of these gene polymorphisms had not yet been elucidated in Egyptian children.
Previous studies have been conducted to study the association between IL-1β gene polymorphisms and risk of H. pylori infection and associated gastritis; however, the variability of the results between different populations and different geographical areas remains inconclusive [6–9, 12, 13].
Ramis, et al. [12] observed that the presence of the T/T genotype of IL-1 β -511 and the C/C genotype of IL-1β -31 was associated with H. pylori infection in adult patients. Similarly, Sun, et al. [13] confirmed that adult population with IL-1β 31 CT and TT genotypes in Asia and Latin America are more susceptible to infection with H. pylori. An African study conducted at Kenya, showed that heterozygous genotype (C/T) of IL-1 β-511 was significantly associated with H. pylori infection [14]. In accordance with our results, this study confirmed that the genotype C/T of IL-1β -511 was the predominant genotype in H. pylori positive patients. In addition, patients harboring the C/T genotype are 6.6 times more prone to be infected with H. pylori.
On the other hand, Tseng, et al. [15] found no relationship between the risk of H. pylori infection and IL-1β polymorphisms in Jamaican children. A study, conducted in South China to characterize IL-1 polymorphism in children, also reported no relationships between IL-1 polymorphisms and H. pylori infection [16]. They justified the absence of association by the long process needed for bacterial host interaction. Similarly, this study reported no association between IL-1β-31 gene polymorphism and H. pylori infection.
It was observed in this work that there is no association between IL-1RN genotypes or any of its alleles and H. pylori infection. This finding was in concordance with that reported previously in a study conducted in children 16 as well as in others conducted in adult population [6, 12, 17]. On the other hand, Zhang, et al. [18] documented a significant association between ILRN VNTR polymorphism and H. pylori infection, especially in Asians and particularly in hospital-based subgroups. Additionally, Motamedi Rad, et al. [19] found that patients carrying ILRN allele 2 were at increased risk of more severe disease (peptic ulcer).
It was reported that polymorphisms in IL-1β is associated with increased production of IL-1β in the gastric mucosa, which suppresses gastric acid secretion. Hypochlorhydria enhances H. pylori colonization and subsequently infection due to loss of the defense mechanism of acid secretion 12. Although, the effect of IL1β-511 C/T genotype polymorphism on gastric acid secretion has not been evaluated in this study; however, this mechanism would explain the predominance of IL-1β -511 C/T in H. pylori positive patients in this study.
Li, et al. found that the distribution of IL-1β-511 and -31 genotypes were significantly different among different gastric disease severities (p = 0.001); the IL-1β -511 TT / -31 CC were more observed in children with moderate, and severe gastritis as well as in gastric ulcer patients 16. Similarly, IL-1β-511 C/T genotypes were associated with chronic gastritis in the Brazilian and Mexican adult population [6, 20]. Another study demonstrated that the presence of the T/T genotype of IL-1 β -511 and the C/C genotype of IL-1β -31 was associated with an increased risk of gastritis in H. pylori-positive adult patients 12. It was also reported that German adult patients with IL-1β-511T/-31C have an increased risk of atrophic gastritis [21]. On the other hand, no association was found between IL-1β-511 polymorphisms and H. pylori gastritis in Japanese as well as in Indian adult population [22, 23]. Moreover, a systematic review concluded that the IL-1β-31 polymorphisms might be associated with gastritis risk in the Caucasian population, whereas the IL-1β-511 polymorphisms have no association 7. Another meta-analysis, conducted on 29 case control studies, found that IL-1β-511 C/T polymorphism might act as a risk factor of H. pylori-related diseases and that T allele carriers might act as a potential biomarker for H. pylori-related carcinoma [24].
In this study, it was found that carriers of genotype C/T of IL-1β -511 were 8.33 times at risk to develop moderate–severe corpus gastritis than patients with other genotypes. Additionally, the presence of T allele of IL-1β-511 gene increases the risk of moderate–severe corpus gastritis by six times and of corpus glandular atrophy by seven times.
Although, polymorphisms in IL1β and ILRN genes were found to disturb the production levels of IL-1β, there is contradictory data regarding the effects of these polymorphisms on IL-1β production [4, 25, 26]. However, increased production of IL-1β might suppress gastric acid secretion (hypochlorhydria), and eventually enhances inflammation, which will in turn allow H. pylori colonization to reach the corpus. Additionally, suppressed gastric acid secretion might increase mucosal damage due to accumulation of bacterial toxins and products of inflammation. This process will end up with severe gastric atrophy, intestinal metaplasia, and ultimately, gastric cancer 12. This might explain the increased risk of corpus gastritis and glandular atrophy in carriers of C/T genotype of IL-1β-511 in this work.
Combined analysis of the three studied polymorphisms in this study confirmed that children who had two polymorphisms are almost four times at risk for development of H. pylori infection (p = 0.026, OR = 3.937, 95% CI = 1.175–13.200). However, no association was demonstrated between the number of these polymorphisms and the severity of gastritis. Similarly, Melo Barbosa, et al. [25] reported no association between combined polymorphisms in IL-1 and TNF-α and the risk of developing severe gastric disease. On the other hand, El-Omar, et al. [4] reported that combined IL-1 polymorphisms contribute to increased risk of hypochlorhydria than single polymorphisms. Martínez-Carrillo, et al. [20] also demonstrated that IL1β -511 C/-31T haplotype is a risk factor to develop chronic gastritis.
CONCLUSIONS
These results proved that Egyptian children carrier of the C/T genotype of IL1β-511 are 6.6 times more susceptible to infection with H. pylori and 8.3 times more liable to develop moderate to severe corpus gastritis than children carriers of other genotypes. This population should be considered a high-risk group, which is likely to develop a more severe disease. This group needs regular gastric endoscopic surveillance, and should be target for H. pylori eradication.
REFERENCES
Author notes
Sana Hosny Barakat and Marwa Ahmed Meheissen are contributed equally to this work.

Comments