


Abstract
Air pollution, particularly fine particulate matter with an aerodynamic diameter of ≤2.5 μm (PM2.5), has been recognized for its adverse effects on multiple organs beyond the lungs. Among these, the bone began to garner significant attention. This review covers epidemiological, animal, and cell studies on PM2.5 exposure and bone health as well as studies on PM2.5-induced diseases with skeletal complications. Emerging evidence from epidemiological studies indicates a positive association between PM2.5 exposure and the incidence of osteoporosis and fractures, along with a negative association with bone mineral density. Experimental studies have demonstrated that PM2.5 can disrupt the metabolic balance between osteoclasts and osteoblasts through inflammatory responses, oxidative stress, and endocrine disruption, thereby triggering bone loss and osteoporosis. Additionally, this review proposes a secondary mechanism by which PM2.5 may impair bone homeostasis via pathological alterations in other organs, offering new perspectives on the complex interactions between environmental pollutants and bone health. In conclusion, this contemporary review underscores the often-overlooked risk factors of PM2.5 in terms of its adverse effects on bone and elucidates the mechanisms of both primary and secondary toxicity. Further attention should be given to exploring the molecular mechanisms of PM2.5-induced bone impairment and developing effective intervention strategies.
Air pollution is a global concern, especially in developing countries. Various particle pollutants, including ultrafine particulate matter (PM0.1, aerodynamic diameter ≤0.1 μm), fine particulate matter (PM2.5, aerodynamic diameter ≤2.5 μm), and inhalable particulate matter (PM10, aerodynamic diameter ≤10 μm), as well as gaseous pollutants such as ozone, nitrogen dioxide, sulfur dioxide, and carbon monoxide, contribute to this issue. Among these, PM2.5 has been identified as a primary pollutant due to its ability to carry hazardous materials, such as organic substances and heavy metals (Masselot et al. 2022). Its small size allows it to pass through the respiratory membrane and deposit in the alveoli (Pryor et al. 2022), where it then enters the circulation, inducing the release of inflammatory cytokines, triggering oxidative stress, disrupting hormone levels, and interfering with other cellular products or metabolites (Sun et al. 2020), thus affecting downstream organs (Bandowe et al. 2021).
Osteoporosis, the most common skeletal disorder and systemic bone disease, is characterized by decreased bone mass, deterioration of bone tissue microarchitecture, and increased bone fragility. Recent evidence suggests a significant association between PM2.5 exposure and an increased risk of osteoporosis and fractures, affecting bone density and mineralization (Yu et al. 2023). This contemporary review summarizes the adverse effects of PM2.5 on bone homeostasis, proposing primary impairment and secondary mechanisms from the perspective of organ crosstalk effects.
Methods
In this review, we searched PubMed database for literature on PM2.5 and/or bone damage from 2000 to 2024. The evaluation included epidemiological, animal, and cell studies related to PM2.5 and bone damage as well as studies on PM2.5-induced diseases. Epidemiological studies that did not include PM2.5, diseases that do not cause skeletal complications, therapeutic, and diagnostic studies, conference proceedings, articles that were not written in English, and those not available publicly were excluded.
Epidemiologic evidence on PM2.5’s effects on bone health
Bone, a crucial organ for supporting the body, plays an essential role in maintaining normal physical growth and development. Recently, a growing body of epidemiological evidence has suggested a significant association between air pollution and an increased risk of fractures and osteoporosis (Liu et al. 2021; Yu et al. 2023), indicating that air pollution is an overlooked risk factor for osteoporotic fractures (Nguyen 2017). A survey of 9.2 million Medicare enrollees (aged ≥65 yr) in the United States from 2003 to 2010 found a near-linear relationship between PM2.5 and fracture admissions, with a 4.1% increase in fracture admissions for every interquartile range (4.18 μg/m3) increase in PM2.5 (Prada et al. 2017). A study of long-term exposure to air pollutants in rural China found that for every 1 μg/m3 increase in PM2.5, the risk of osteoporosis increased by 14.6% (Qiao et al. 2020). Similar findings were reported in a cohort study conducted in Korea (Shin et al. 2021). Another analysis of 430,120 participants from the UK Biobank found that exposure to PM2.5 at 9.98 μg/m3 was positively associated with the risk of osteoporosis (Yu et al. 2023). These observations were further confirmed by a study of PM2.5 derived from traffic emissions, where daily mean concentrations of 56.8/33.0 μg/m3 were reported (Zhang et al. 2023). Collectively, these studies demonstrate that PM2.5 may be an independent risk factor for osteoporosis, driving its development.
Indices such as bone strength, bone mineral density (BMD), and T-score represent the extent of osteoporosis. Bone strength, a key determinant of fragility fractures, is determined by a combination of bone mass and quality (Chevalley and Rizzoli 2022). Bone mass refers to the amount of bone minerals and matrix (collagen, proteins, and inorganic salts) per unit volume, whereas bone quality reflects the actual bone condition, involving properties of collagen, bone cell density, bone trabeculae, and cortical microstructure. BMD determines bone microstructure and, to some extent, reflects bone strength. The T-score is the gold standard for assessing BMD and predicting osteoporosis. Thus, bone strength, BMD, and T-score are key parameters for evaluating osteoporosis, with evidence showing their association with PM2.5-mediated osteoporosis.
Regarding bone strength, studies have shown a significant association with long-term PM2.5 exposure (37.29 μg/m3) in adults in southwest China. Using the quantitative ultrasonic index, it was found that for every 10 μg/m3 increase in PM2.5, the quantitative ultrasonic index decreased by 1.89 units (Wu et al. 2021), further supporting the negative effects of air pollution on bone strength.
Concerning BMD, Mexican Americans living within 500 m of major roads had a mean whole-lower body BMD of 0.02 g/cm2 (P < 0.001) and pelvic BMD of 0.03 g/cm2 (P = 0.012) lower than those living >1500 m away (Chen et al. 2015). Further research in a southern Indian city indicated that a mean annual exposure to PM2.5 of 32.8 μg/m3 was associated with reduced spine and hip BMD (Ranzani et al. 2020). In another study exploring the UK Biobank dataset from 2014 to 2020, long-term exposure to PM2.5 was significantly associated with a reduction in heel, femoral neck, and lumbar spine BMD (Ge et al. 2023).
In studies on the T-score, a negative correlation between PM2.5 exposure and T-score was observed in different regions, including Hubei Province, China (Zhang et al. 2022a), Taiwan, China (Su et al. 2023), and 110 provinces in Italy (Adami et al. 2022). Specifically, long-term exposure to PM2.5 over 25 μg/m3 increased the risk of osteoporosis by 16%. The cortical site (i.e. femoral neck) is more likely to be adversely affected by PM2.5 exposure than trabecular sites (i.e. lumbar spine) (Adami et al. 2022). Therefore, the effect of air pollution on osteoporosis is evidenced by reductions in bone strength, BMD, and T-scores. Despite solid observations, the exact effect of PM2.5 on bone mineral, bone matrix, bone structure, and susceptibility at different sites requires further investigation. These studies have summarized the epidemiological data in Table 1.
Summary of epidemiological evidences on the effects of PM2.5 on bone health.
| Age | Years: Mean[SD] | Sample size | Period | Average exposure to air pollution | Key findings | Reference |
|---|---|---|---|---|---|---|
| 40 to 69 | 56.5[8.1] | 430,120 | 2006 to 2010 | PM2.5: 10.0[1.1] μg/m3 | ↑ osteoporotic fracture risk | Yu et al. (2023) |
| PM10: 19.3[2.0] μg/m3 | ||||||
| PM2.5–10: 6.4[0.9] μg/m3 | ||||||
| NO2: 29.1[9.2] μg/m3 | ||||||
| NOx: 43.9[15.6] μg/m3 | ||||||
| ≥65/30 to 79 | ≥65.0/47.5[12.8] | 9,200,000/692 | 2003 to 2010/2002 to 2012 | PM2.5: 3.0 to 22.0 μg/m3 | ↑ osteoporotic fracture risk | Prada et al. (2017) |
| ↓ BMD (femoral neck and ultradistal radius) | ||||||
| 18 to 79 | 55.8[10.8] | 8,033 | 2015 to 2017 | PM1: 56.6[1.8] μg/m3 | ↑ osteoporosis risk | Qiao et al. (2020) |
| PM2.5: 72.1[1.9] μg/m3 | ||||||
| PM10: 129.1[4.0] μg/m3 | ||||||
| NO2: 37.3[1.7] μg/m3 | ||||||
| ≥40 |
| 237,149 | 2002 to 2015 | PM2.5: 23.1[4.4] μg/m3 | ↑ osteoporotic risk | Shin et al. (2021) |
| PM10: 53.0[4.9] μg/m3 | ||||||
| NO2: 25.3[1.9] μg/m3 | ||||||
| CO: 5.9[0.7] μg/m3 | ||||||
| SO2: 5.7[0.5] μg/m3 | ||||||
| Around 65 | 65 years+(79.80%) | 5,044 | 2016 to 2021 | PM2.5: 33.0[28.0] and 56.8[39.6] μg/m3 | ↑ osteoporotic fracture risk | Zhang et al. (2023) |
| PM10: 70.4[50.4] and 114.7[69.1] μg/m3 | ||||||
| NO2:32.3[16.8] and 41.9[18.4] μg/m3 | ||||||
| CO: 641.6[299.7] and 955.4[484.4] μg/m3 | ||||||
| 30 to 79 | 52.5[11.4] | 66,598 | 2018 to 2019 | PM1: 13.5 to 53.6 μg/m3 | ↓ bone strength | Wu et al. (2021) |
| PM2.5: 18.2 to 105.3 μg/m3 | ||||||
| PM10: 33.3 to 165.2 μg/m3 | ||||||
| NO2: 10.0 to 63.0 μg/m3 | ||||||
| 18 to 66 | 34.4 | 1,173 | 2002 to 2008 | PM2.5: 17.4 μg/m3 | ↓ BMD (whole-body, pelvic) | Chen et al. (2015) |
| O3: 40.7 μg/m3 | ||||||
| NO2: 25.6 μg/m3 | ||||||
| 36 | 35.7[14.0] | 3,717 | 2009 to 2012 | PM2.5: 32.8[2.5] μg/m3 | ↓ BMD and bone mineral content (spine and hip) | Ranzani et al. (2020) |
| Black carbon: 2.5[0.2] μg/m3 | ||||||
| 40 to 73 | 55.8[7.5] and 55.1[7.5] | 29,766 | 2014 to 2020 | PM2.5: 9.9[1.0] μg/m3 | ↓ BMD (heel, femoral neck, and lumbar spine) | Ge et al. (2023) |
| 55 | 54.6[13.6] | 1,845 | 2014 to 2018 | PM2.5: 52.6 μg/m3 | ↑ osteoporotic risk | Zhang et al. (2022a) |
| PM10: 85.8 μg/m3 | ↓ BMD T-score (femoral neck and total hip) | |||||
| O3: 56.5 μg/m3 | ||||||
| NO2: 37.8 μg/m3 | ||||||
| CO: 1.1 μg/m3 | ||||||
| SO2: 10.9 μg/m3 | ||||||
| 30 to 70 | 51.2[10.4] | 27,033 | 2012 to 2018 | PM2.5: 26.1[8.5] and 25.3[7.9] μg/m3 | ↓ T-score | Su et al. (2023) |
| PM10: 54.6[14.2] and 52.6[12.8] μg/m3 | ||||||
| 58 to 73 | 65.1[11.0] | 59,950 | 2013 to 2019 | PM2.5: 16.0 μg/m3 | ↓ T-score levels (femoral neck and lumbar spine) | Adami et al. (2022) |
| PM10: 25.0 μg/m3 |
Possible pathologic mechanisms of PM2.5 and osteoporosis
The potential pathological processes by which PM2.5 mediates osteoporosis include inflammation, oxidative stress, and endocrine disruption. This section summarizes relevant information.
Inflammation
Numerous studies have demonstrated that exposure to air pollutants induces inflammatory responses in alveolar macrophages and airway epithelial cells, leading to systemic inflammation in extrapulmonary organs (Guan et al. 2019). Bone is a target organ where PM2.5 induces an inflammatory response. During inflammation, the differentiation and activity of osteoclasts and osteoblasts are disturbed, leading to an imbalance in bone resorption and osteogenesis. It has been shown that immune cells are activated and proinflammatory cytokines are released in response to PM2.5 exposure (Arias-Pérez et al. 2020), with tumor necrosis factor-α (TNF-α) and interleukin-6 (IL-6) contributing to osteoporosis and bone remodeling (Wang and He 2020).
Although the impairment in osteogenesis is relatively limited, TNF-α is well known to enhance osteoclast differentiation and bone resorption by directly upregulating the expression of receptor activator for nuclear factor-κ B ligand (RANKL) in both in vitro and in vivo models (Marahleh et al. 2019). This coincides with PM2.5’s effects on bone homeostasis in C57BL/6 male mice exposed to PM2.5 through a whole-body inhalational exposure system for 6 months. On one hand, PM2.5 inhibited osteogenesis by suppressing osteocalcin levels in the serum and femur. On the other hand, PM2.5 stimulated the expression of RANKL to promote osteoclastogenesis in the distal femur (Ge et al. 2023). Given the presence of TNF-α staining around the femur growth plate in PM2.5-exposed mice, further exploration is warranted to determine whether TNF-α is key in PM2.5-induced bone metabolic disorders. As expected, TNF-α neutralization by a mouse TNF-α neutralizing antibody (D2H4) completely rescued PM2.5-induced osteoclast differentiation and bone resorption through the Traf6/c-Fos pathway (Ge et al. 2023). We analyzed TNF-α levels impacting bone health (Table 2). In the ovariectomy model, bone resorption was accompanied with increased in TNF (116.5 to 157.5 pg/ml) and TNF-α at an IC50 of 600 pg/ml (median inhibition concentration of 50%) could dose-dependently inhibit osteoblast differentiation in vitro (Kitazawa et al. 1994; Gilbert et al. 2000). We further compared the concentration levels of TNF-α induced by PM2.5. In response to PM2.5 exposure, the TNF-α levels in serum of mice could be 600 to 800 pg/ml, and its levels in the medium of RAW264.7 cells were 300 to 600 pg/ml (Wang et al. 2022; Ge et al. 2023). PM2.5-induced levels of TNF-α were parallel to, or even beyond the levels that could cause bone damage. Thus, TNF-α-mediated osteoclast differentiation and bone resorption may be the key mechanism by which PM2.5 exposure impairs bone metabolic balance.
Comparison of biomodulators from different experimental models.
| Biomodulators | Concentration (pg/ml) | Model | Exposure methods | Key findings | Reference |
|---|---|---|---|---|---|
| TNF-α | 117 to 158 | mice | OVX | ↑ serum TNF | Kitazawa et al. (1994) |
| ↑ bone resorption | |||||
| IC50: 600 | fetal rat calvaria precursor cells and MC3T3-E1-14 | human TNF-α exogenous supplementation | ↓ osteoblast differentiation | Gilbert et al. (2000) | |
| 600 to 800 | mice | PM2.5 i.p. | ↑ serum TNF-α | Wang et al. (2022) | |
| 300 to 600 | RAW264.7 | PM2.5 incubation | ↑ osteoclast differentiation | Ge et al. (2023) | |
| IL-6 | 60 to 80 | mice | hind-limb suspension | ↓ BMD | He et al. (2020) |
| 300 to 500 | osteoblasts | recombinant human IL-6 exogenous supplementation | ↓ osteoblast differentiation | Peruzzi et al. (2012) | |
| 200 to 300 | mice | PM2.5 i.p. | ↑ serum IL-6 | Wang et al. (2022) | |
| 200 to 800 | BEAS-2B cells | PM2.5 incubation | ↑ IL-6 | Longhin et al. (2018) | |
| estradiol | 3 to 4 | rats | GX | ↓ tibial mass | Yarrow et al. (2008) |
| 2 to 4 | mice | PM2.5 whole-body exposure | ↓ blood estradiol | Qiu et al. (2018) | |
| testosterone | 140 to 260 | rats | GX | ↓ bone volume | Yarrow et al. (2008) |
| 180 to 380 | mice | PM2.5 whole-body exposure | ↓ plasma testosterone | Yang et al. (2019) |
BMD, bone mineral density; GX, gonadectomy; IC50, median inhibition concentration of 50%; i.p., intraperitoneal injection; OVX, ovariectomy.
IL-6 also plays an important role in bone metabolism. Adult male mice treated with an IL-6-neutralizing antibody showed attenuated bone loss, enhanced osteoblastogenesis, and suppressed osteoclastogenesis (He et al. 2020). Similar to TNF-α’s role in osteoclasts, IL-6 promotes osteoclastogenesis (O’Brien et al. 2016). Additionally, IL-6 inhibits osteoblast formation by interfering with the signaling pathway of osteoblast differentiation, further contributing to bone loss. IL-6 levels increased in response to PM2.5 in a time- and concentration-dependent manner in both observational (Zhu et al. 2021) and experimental studies (Liu et al. 2024). We compared the levels of IL-6 that induce bone damage and those induced by PM2.5 (Table 2). In the hind-limb suspension model, IL-6 levels were 60 to 80 pg/ml, which was associated with a decrease in BMD (He et al. 2020). In the osteoblast model, IL-6 levels were 300 to 500 pg/ml, leading to a reduction in osteoblast differentiation (Peruzzi et al. 2012). Correspondingly, the levels of IL-6 induced by PM2.5 in vitro and in vivo were 200 to 300 and 200 to 800 pg/ml, respectively (Longhin et al. 2018; Wang et al. 2022). Although the models exhibit inherent variability, the increase in IL-6 levels caused by PM2.5 may be the cause of bone damage. Taken together, the inflammatory cytokine IL-6 may be another pathological factor in PM2.5-induced osteoporosis.
Oxidative stress
Oxidative stress is characterized by the accumulation of reactive oxygen species (ROS) and reactive nitrogen species, resulting in cellular oxidative damage (Kimball et al. 2021). Sustained excess ROS disrupts the balance between osteoclastogenesis and osteoblastogenesis, thereby affecting bone health (Chandra and Rajawat 2021). In addition to direct injury caused by oxidative stress, research on bone destruction focuses on nuclear factor erythroid-2-related factor 2 (Nrf2), an intracellular transcription factor that combats oxidative stress. PM2.5-induced excessive ROS may trigger the nuclear translocation of Nrf2 to exert antioxidant effects (Deng et al. 2013). In the absence of Nrf2, excessive ROS production was observed, followed by the enhancement of RANKL-induced osteoclast differentiation and bone resorption, which was significantly rescued by N-acetylcysteine (NAC), a ROS inhibitor (Hyeon et al. 2013). These findings clearly indicate a role for Nrf2 in oxidative stress-mediated osteoclast differentiation and bone resorption in response to PM2.5.
Bone marrow-derived mesenchymal stem cells (BMSCs) can differentiate into osteoblasts, which play a role in maintaining bone homeostasis (Kou et al. 2020). PM2.5 exposure was found to reduce the number of BMSCs and inhibit their proliferation by increasing ROS levels. Accordingly, NAC treatment significantly attenuated the inhibition of BMSC proliferation and BMSC number induced by PM2.5, via the Akt signaling pathway (Cui et al. 2015). Therefore, oxidative stress contributes to PM2.5-induced osteoporosis by inhibiting osteoblast differentiation.
Endocrine disruption
Bone metabolism is regulated by the endocrine system, primarily through sex hormones and parathyroid hormone (PTH). PM2.5-induced osteoporosis is mediated by endocrine disruption. The following section analyzes the possible endocrine factors associated with PM2.5-mediated osteoporosis.
Estrogen is primarily secreted by the ovaries and includes estrone, 17β-estradiol, estriol, and estetrol (Kumar and Goyal 2021). Besides enhancing the development of female secondary sex characteristics and maturation of sex organs, estrogen also affects bone homeostasis. It promotes osteoblast proliferation and differentiation by activating Wnt/β-catenin signaling and inhibits RANKL-induced osteoclast differentiation, reducing osteoclast formation. Estradiol exerts anti-osteoporotic effects through the ESR1-Keap1-Nrf2 axis-mediated activation of the stress response, upregulation of transmembrane protein 119 (Yang et al. 2023), and upregulation of SIRT1, which promotes autophagy and inhibits osteoblast apoptosis (Wang et al. 2021). Exposure to PM2.5 adversely affects female reproductive hormones. A recent study showed that PM2.5 exposure was associated with a decrease in estradiol during menopausal stages (Wang et al. 2024). Animal studies indicate that estrogen deficiency renders female rats susceptible to PM2.5 (Costa-Beber et al. 2021). When assessing estradiol levels, we observed that tibial mass in rats decreased at concentrations of 3.2 to 4.0 pg/ml, which is similar to that seen with the levels of estradiol (2 to 4 pg/ml) induced by PM2.5 (Yarrow et al. 2008; Qiu et al. 2018). However, considerable variability in the estradiol level alterations induced by PM2.5 is reported in the literature, emphasizing the need for further research to confirm the role of PM2.5 in mediating bone damage via estradiol reduction.
Testosterone is primarily secreted by the testes and plays an indirect but significant role in mediating age-related bone loss in men. One study demonstrated that testosterone treatment significantly increased volumetric BMD and bone strength in elderly men with low testosterone (Snyder et al. 2017). In contrast, testosterone deficiency reduces BMD and increases fracture risk in men due to decreased conversion of testosterone to estradiol and reduced effects of testosterone-mediated anti-apoptosis in osteoblasts and anti-proliferation/resorption in osteoclasts. There is strong evidence that long-term exposure to high PM2.5 levels is negatively correlated with testosterone levels (Qiu et al. 2018). Regarding immediate and short-term PM2.5 exposures, for each 10 µg/m3 increase in PM2.5, testosterone declined by 1.6% and maintained a downward trend over 0 to 30 d (Zheng et al. 2022). Similarly, we compared testosterone levels and observed that in the gonadectomy surgical model, testosterone concentrations of 140 to 260 pg/ml were associated with bone loss, which is a change that parallels alterations induced by PM2.5 exposure (180 to 380 pg/ml) (Yarrow et al. 2008; Yang et al. 2019). However, the concentration range reported here should be considered provisional. A meaningful interpretation of these changes necessitates investigation within the context of normal testosterone levels across various models and animal strains.
PTH is secreted by the parathyroid glands and regulates both bone catabolism and anabolism. During catabolism, PTH stimulates RANKL secretion and induces bone resorption by inhibiting osteoprotegerin expression via the PKA-CREB-AP1 pathway. In anabolism, PTH acts directly on osteoblasts to increase differentiation via the Cbfa1/Runx2, Smad3/Tmem119, and BMP signaling pathways. Although there are no direct data showing the effects of PM2.5 exposure on PTH levels, the interaction of vitamin D with PTH suggests a role for PTH in PM2.5-mediated osteoporosis. Vitamin D regulates the absorption of calcium and phosphorus in the intestine, thereby maintaining bone development. A study on 6-yr-old children showed that those living in a city with high PM2.5 levels had lower vitamin D levels than children in a control city (Calderon-Garciduenas et al. 2013). Vitamin D, circulating calcium, and PTH form a tightly controlled feedback loop, regulating bone health. Lower serum levels of vitamin D are positively associated with BMD, negatively correlated with PTH, and accompanied by accelerated bone loss by inhibiting osteoblastic bone formation and stimulating osteoclastic bone resorption (Gao et al. 2017; Yang et al. 2020). Thus, reduced calcium absorption due to lower vitamin D and PTH levels is a potential mechanism by which PM2.5 decreases BMD and induces bone turnover imbalance and osteoporosis.
Secondary effects of PM2.5 on osteoporosis via other organs
In addition to the direct induction of osteoporosis by PM2.5, studies suggest that PM2.5 may impair bone metabolism through secondary effects stemming from injuries to other organs. This implies a potential crosstalk between the skeletal system and other bodily systems. The respiratory tract is the primary target of air pollution due to its role as the initial point of air inhalation, followed by the cardiovascular, metabolic, urinary, and immune systems. This section classifies diseases leading to bone complications and evaluates the susceptibility factors or pathogenesis of these diseases associated with PM2.5. Below is a brief overview of the interactions between these systems and bone in response to PM2.5 exposure.
PM2.5, respiratory diseases, and osteoporosis
Chronic obstructive pulmonary disease (COPD) is widely recognized as being induced by long-term PM2.5 exposure (Yang et al. 2021b). Studies have shown that lower BMD is associated with reduced lung function in patients with respiratory diseases (Liu et al. 2015). The effects of PM2.5 on osteoporosis in COPD could be mediated through hypoxia, oxidative stress, and inflammation. Hypoxia, a key factor in COPD pathogenesis, directly disrupts bone remodeling (Usategui-Martín et al. 2022). Additionally, excessive ROS production and inflammation in COPD disturb bone metabolism. Thus, PM2.5 exposure-induced COPD may exacerbate osteoporosis’s pathological processes.
Asthma, an inflammatory respiratory disease characterized by airway hyperresponsiveness (Figueiredo et al. 2023), similarly affects bone health through hypoxia, inflammation, and oxidative stress (Ma et al. 2022). Asthma, primarily a neutrophil-mediated inflammation, involves TNF-α (Han et al. 2022) and IL-6 (Di Pompo et al. 2021), which inhibit osteoblasts, activate osteoclasts, and disrupt bone remodeling. Studies have shown that PM2.5 exposure increases asthma morbidity, thereby increasing the risk of osteoporosis via hypoxia, inflammation, and oxidative stress.
PM2.5, cardiovascular disorders, and osteoporosis
Atherosclerosis, a common cardiovascular disease, may be associated with osteoporosis through several pathways. Atherosclerosis involves chronic low-grade inflammation, which enriches immune cells (Ley 2021) and accelerates bone loss by stimulating osteoclast activity, bone resorption, and destruction, increasing osteoporosis risk. Additionally, oxidative stress from excess ROS, a common mechanism leading to atherosclerosis, is associated with low BMD and osteoporosis (Kimball et al. 2021). Vitamin D deficiency is another pathological mechanism linking osteoporosis and atherosclerosis (Szekanecz et al. 2019). Evidence from epidemiological and animal studies indicates a correlation between PM2.5 exposure and atherosclerosis (Sun et al. 2005; Bevan et al. 2021), suggesting that inflammation, oxidative stress, and vitamin D deficiency are key mechanisms through which PM2.5-triggered atherosclerosis may contribute to osteoporosis.
Hypertension, another prevalent cardiovascular disease, is linked to bone health. Hypertension predicts bone loss and osteoporosis, associated with increased calcium excretion and compensatory activation of the parathyroid glands, stimulating bone remodeling (Silva and Bilezikian 2015). Inflammation and oxidative stress, which induce endothelial dysfunction and vascular damage (Guzik and Touyz 2017), are associated with hypertension. Epidemiological and animal studies have established a positive correlation between ambient PM2.5 exposure and hypertension (Du et al. 2020; Zhao et al. 2022). Therefore, PM2.5 may mediate osteoporosis in the context of hypertension through calcium loss-induced PTH secretion and inflammation- and oxidative stress-stimulated bone remodeling.
PM2.5, metabolic disorders, and osteoporosis
Diabetes mellitus, characterized by hyperglycemia due to dysfunction in insulin secretion or action, is predominantly type II diabetes mellitus (T2DM). Bone fragility is a common complication of T2DM. An animal study (Eckhardt et al. 2020) showed that the advanced glycation end-product signaling-enhancing receptor pathway and T2DM-induced accumulation of senescent cells in the bone may trigger disturbances in bone remodeling. Systemic energy and substance metabolism, which require glucose, amino acids, and fatty acids for energy production, play a crucial role in maintaining bone homeostasis. Disturbed glucose metabolism caused by T2DM renders the bone energy deficient (Lecka-Czernik and Rosen 2015), leading to osteoporosis. Studies have demonstrated that long-term exposure to ambient PM2.5 induces or exacerbates T2DM, as evidenced by glucose tolerance impairment, insulin resistance, and energy metabolic disorders in mice fed normal chow, high-fat chow, and genetically diabetic mice (Liu et al. 2014). Coupled with chronic inflammation and oxidative stress (Halim and Halim 2019), it is speculated that advanced glycation end products, cellular senescence (Eckhardt et al. 2020), and glucose metabolic disturbances under diabetic conditions may contribute to PM2.5-mediated osteoporosis.
Nonalcoholic fatty liver disease (NAFLD) is characterized by the intracellular deposition of lipids in hepatocytes and accounts for more than 50% of chronic liver disease cases (Yin et al. 2023). Osteoporosis is a common complication in patients with chronic liver disease (Handzlik-Orlik et al. 2016). The effect of NAFLD on bone health may be mediated by 3 secreted proteins. First, insulin-like growth factor 1 (IGF1) produced by hepatocytes is an important regulator of bone growth and remodeling, promoting the differentiation and activity of osteoblasts while inhibiting osteoclast apoptosis (Zhao et al. 2023). Second, fibroblast growth factor 21 (FGF21) secreted by hepatocytes inhibits osteoclastogenesis and stimulates adipogenesis in BMSCs by potentiating peroxisome proliferator-activated receptors and regulating bone remodeling (Wei et al. 2012). Third, osteopontin, secreted mainly by osteoblasts, regulates lipid synthesis and is associated with hepatic steatosis. It interferes with normal bone metabolism by promoting osteoclast proliferation and differentiation and inhibiting osteoblast activity (Si et al. 2020). Generally, serum levels of IGF1 are reduced, whereas those of FGF21 and osteopontin are elevated in patients with NAFLD, ultimately inhibiting osteogenesis, enhancing bone resorption, and disturbing bone homeostasis (Zhao et al. 2023). Both epidemiological and animal studies have found a positive correlation between exposure to environmental PM2.5 and NAFLD (Li et al. 2020; Yang et al. 2021a). Therefore, in the context of NAFLD, chronic exposure to PM2.5 could induce osteoporosis through IGF1, FGF21, and osteopontin-mediated bone remodeling.
PM2.5, kidney diseases, and osteoporosis
Chronic kidney disease (CKD) is characterized by a decline in renal function for at least 3 months, evidenced by a glomerular filtration rate below 60 ml/min per 1.73 m2 or the presence of markers of renal injury. CKD contributes to the development of bone disease, accompanied by disturbances in systemic mineral and bone metabolism markers such as low blood calcium, high blood phosphorus, and reduced vitamin D hormone levels (Lalayiannis et al. 2023). These disturbances ultimately lead to disorders in bone metabolism via a “kidney-bone axis,” resulting in reduced bone strength, cortical bone degeneration, increased cortical porosity, and osteoporosis (Lalayiannis et al. 2023).
Interestingly, the “kidney-bone axis” is also known as the “Kidney-Governing-Bone” theory in traditional Chinese medicine (TCM) clinical practice. According to the Yellow Emperor’s Classic of Internal Medicine, the kidney stores essence, which generates the marrow to engender and nourish bones. Therefore, tonifying kidney essence is widely believed to play an important role in treating various bone diseases. The prevalence of CKD is also associated with air pollution (Bowe et al. 2019). Both short-term (Bi et al. 2021) and long-term (Mehta et al. 2016) exposure to PM2.5 is strongly linked to impaired renal function, leading to kidney disease. In conclusion, both TCM theory and Western medical observations support an increased risk of osteoporosis following kidney injury, which may contribute to PM2.5-mediated osteoporosis.
PM2.5, autoimmune diseases, and osteoporosis
Systemic lupus erythematosus (SLE) is an autoimmune disease characterized by the production of multiple autoantibodies and the involvement of multiple organs and systems (Accapezzato et al. 2023). Bone involvement is one of the most common causes of disability in SLE. The incidence of osteoporosis is significantly higher in patients with SLE (Rella et al. 2022), caused by chronic systemic inflammation, vitamin D deficiency, and decreased sex hormone levels (Bultink 2018). An animal study showed that chronic exposure to PM2.5 in SLE mice accelerated SLE development, causing structural and functional damage to the kidneys (Yariwake et al. 2021). Thus, PM2.5 exposure may contribute to bone loss in SLE due to inflammation, sex hormone deficiency, or decreased vitamin D levels.
Sjögren’s syndrome (SS) is a chronic autoimmune disease characterized by sicca symptoms, fatigue, and myoarthralgia (André and Böckle 2022). During SS development, a large number of innate immune cells such as dendritic cells, macrophages, and natural killer cells accumulate in the exocrine glands, leading to tissue inflammation (Kiripolsky et al. 2017). The expression levels of enzymes producing ROS and reactive nitrogen species are elevated, whereas the antioxidant system is suppressed during the immune process of SS. Although the salivary and lacrimal glands are the primary targets of SS, the musculoskeletal system is also involved, and bone complications generally occur (Jonsson et al. 2018). Studies have shown that PM2.5 exposure significantly increases the risk of hospitalization for SS (Zhang et al. 2022b). This suggests a potential contribution of inflammation and oxidative stress to PM2.5-impaired bone metabolism in SS.
Future perspectives
Air pollution is ranked as the top factor contributing to the global burden of disease (GBD 2021; Risk Factors Collaborators 2024), yet it remains a largely neglected risk factor for osteoporosis. Recent epidemiological studies have indicated an association between PM2.5, decreased BMD, and an increased risk of fractures. The link between air pollution and impaired bone metabolism has begun to draw attention from toxicologists, helping to explain the osteoporosis epidemic, particularly in countries with severe air pollution. Inflammation, oxidative stress, and endocrine disturbances are the main pathological factors that induce bone remodeling. However, attention should also be paid to the crosstalk between bone and other organs in the respiratory, cardiovascular, metabolic, urinary, and autoimmune systems, which also contribute to disturbances in bone metabolism and osteoporosis (Fig. 1).
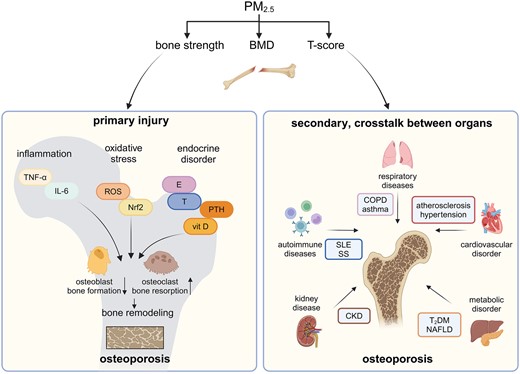
Primary and secondary effects of PM2.5 on bone. PM2.5, fine particulate matter with an aerodynamic diameter of ≤2.5 μm; BMD, bone mineral density; TNF-α, tumor necrosis factor-α; IL-6, interleukin-6; ROS, reactive oxygen species; Nrf2, nuclear factor erythroid-2-related factor 2; E, estrogen; T, testosterone; PTH, parathyroid hormone; vit D, vitamin D; COPD, chronic obstructive pulmonary disease; T2DM, diabetes mellitus type 2; NAFLD, nonalcoholic fatty liver disease; CKD, chronic kidney disease; SLE, systemic lupus erythematosus; SS, Sjögren’s syndrome. (Created with BioRender.com)
Based on the aforementioned evidence, future studies are warranted to gain insight into the underlying mechanisms, which are yet to be fully explored. Additionally, detailed exploration of susceptibility factors is needed to develop reasonable and feasible measures to protect vulnerable populations from air pollution. Finally, the link between PM2.5 exposure-mediated osteoporosis and diseases in other organs requires further investigation. With global climate change, increasing ozone pollution, emerging pollutants, and multifactorial exposure to environmental factors, these issues are likely to become of greater concern in the near future.
Funding
This work was supported by the National Natural Science Foundation of China (grant numbers 82273590 and 82173480).
Conflicts of interest. The authors declared no potential conflicts of interest with respect to the research, authorship, and/or publication of this article.
References
Author notes
Jiyang Zhang and Hanshu Chu contributed equally to this work.

Comments