


Abstract
Animal studies are a critical component in biomedical research, pharmaceutical product development, and regulatory submissions. There is a worldwide effort in toxicology toward “reducing, refining, and replacing” animal use. Here, we proposed a deep generative adversarial network (GAN)-based framework capable of deriving new animal results from existing animal studies without additional experiments. To prove the concept, we employed this Tox-GAN framework to generate both gene activities and expression profiles for multiple doses and treatment durations in toxicogenomics (TGx). Using the pre-existing rat liver TGx data from the Open Toxicogenomics Project-Genomics-Assisted Toxicity Evaluation System (Open TG-GATES), we generated Tox-GAN transcriptomic profiles with high similarity (0.997 ± 0.002 in intensity and 0.740 ± 0.082 in fold change) to the corresponding real gene expression profiles. Consequently, Tox-GAN showed an outstanding performance in 2 critical TGx applications, gaining a molecular understanding of underlying toxicological mechanisms and gene expression-based biomarker development. For the former, over 87% agreement in Gene Ontology was found between Tox-GAN results and real gene expression data. For the latter, the concordance of biomarkers between real and generated data was high in both predictive performance and biomarker genes. We also demonstrated that the Tox-GAN models constructed with the Open TG-GATES data were capable of generating transcriptomic profiles reported in DrugMatrix. Finally, we demonstrated potential utility for Tox-GAN in aiding chemical-based read-across. To the best of our knowledge, the proposed Tox-GAN model is novel in its ability to generate in vivo transcriptomic profiles at different treatment conditions from chemical structures. Overall, Tox-GAN holds great promise for generating high-quality toxicogenomic profiles without animal experimentation.
Animal models are critical to assessing and avoiding human risk from exposure to potential hazards in biomedical research and pharmaceutical product development and are required for regulatory submission (Shanks et al., 2009). Toxicogenomics (TGx) incorporates genomics technologies and bioinformatics into conventional toxicology studies, including animal models to address critical toxicological challenges (Liu et al., 2019). TGx has been widely applied in 2 areas: understanding underlying toxicity mechanisms (Monroe et al., 2020; Podtelezhnikov et al., 2020) such as developing adverse outcome pathways (AbdulHameed et al., 2019; Bell et al., 2016) and enhancing predictive toxicology (Kohonen et al., 2017; Li et al., 2017, 2019). Although in vivo TGx is desirable, profiling thousands of compounds with animals on different doses and treatment durations is impractical. Attempts to generate such in vivo TGx data for a large number of compounds are limited, and only 2 large publicly available in vivo TGx datasets have been available since the inception of TGx some 2 decades ago (Liu et al., 2019). The Open Toxicogenomics Project-Genomics-Assisted Toxicity Evaluation system (Open TG-GATEs; Igarashi et al., 2015) was generated by a Japanese consortium over 10 years while DrugMatrix (Ganter et al., 2006a) was conducted by a private company and can be accessed through the National Toxicology Program (NTP). Even with these resource-intensive efforts, both datasets were only able to study a few hundred compounds focusing on limited organs (eg, only liver and kidney in TG-GATEs). These past endeavors highlight significant challenges in the area of in vivo TGx.
Alongside this, a global effort is underway to modernize toxicology and risk assessment (Liu et al., 2017a; Rice, 2012). Specifically, tremendous efforts have been made or are ongoing to develop alternative toxicity and risk assessment methods, emphasizing the 3Rs principle (ie, refine, reduce, and replace animal testings; Flecknell, 2002). In Europe, some high-profile programs promote the 3R and are developing nonanimal risk assessment strategies, such as the Framework Program 7 (https://ec.europa.eu/defence-industry-space/eu-space-policy/space-research-and-innovation/seventh-framework-programme-fp7_en, last accessed January 4, 2022), Horizon 2020 (https://ec.europa.eu/defence-industry-space/eu-space-policy/space-research-and-innovation/horizon-2020_en, last accessed January 4, 2022), and ONTOX (Vinken et al., 2021). In the United States, governmental agency-initiated efforts, including Tox21 (Richard et al., 2021), ToxCast (Li et al., 2017), and advancing regulatory sciences (Hamburg, 2011), advocate the modernization of toxicity assessment based on new methods. Thus, research on the development of new approach methodologies such as in vitro and in silico approaches is actively pursued for their potential to replace or reduce animal usage in toxicology and risk assessment(Luechtefeld et al., 2018; Van Noorden, 2018).
Artificial intelligence (AI) is changing the landscape of biomedical fields (May, 2021; Yu et al., 2018). Notably, various deep learning-based models have been applied in toxicology in 2 particular aspects: predictive models (Li et al., 2021; Mayr et al., 2016), and generative models (Green et al., 2021). Most efforts in toxicology have been focused on predictive models. For example, deep learning algorithms such as convolutional neural network, deep neural network (DNN), autoencoder have been applied to predict different toxicological endpoints such as drug-induced liver injury (Li et al., 2020) and cardiotoxicity (Cai et al., 2019). However, the generative approach offers unique advantages in comparison to predictive modeling. Concerning 3Rs, a generative approach could produce data without conducting animal studies. There has been some work in generative models using generative adversarial networks (GANs) in de novo drug discovery (Méndez-Lucio et al., 2020) and single-cell sequencing inference (Umarov et al., 2021). For example, Méndez-Lucio et al. (2020) proposed a conditional GAN (CGAN) model to automatically design molecules with a high probability of inducing a desired biological response to facilitate de novo drug discovery. In addition, Umarov et al. (2021) proposed a DeepCellState, a deep learning autoencoder-based framework to infer the drug-induced transcriptional state from 1 cell type to another.
In this study, we proposed a novel deep GAN model (Tox-GAN) and applied it to infer TGx response in rat liver based on chemical structure information and treatment conditions. To evaluate the proposed Tox-GAN model, we employed the rat in vivo repeated dose transcriptomic profiles from the Open TG-GATEs database. We assessed the concordance between the generated transcriptomic profiles by Tox-GAN and real profiles at both gene and pathway levels. Furthermore, we investigated the predictive power of the transcriptomic profiles generated by Tox-GAN as biomarkers for liver-related toxicity prediction. Also, we demonstrated the potential application of the proposed Tox-GAN to aid the chemical structure-based Read-across. To the best of our knowledge, Tox-GAN is the first report using GAN for TGx as an alternative to animal models.
MATERIALS AND METHODS
In Vivo TGx Data
The Open TG-GATEs; Igarashi et al., 2015) was employed to develop the Tox-GAN model, which is a large-scale publicly available TGx database that stores transcriptomic profiles and pathological data derived from in vivo (ie, rat liver and kidney) and in vitro (ie, rat primary hepatocyte and human primary hepatocyte) exposure to 170 compounds at multiple dosages and time points. In this study, we focused on the rat liver in vivo repeated dose (ie, InVivo_liver) generated by following the standard in vivo experiment protocols with 3 dose levels (low, middle, and high) and 4 treatment duration (3, 7, 14, and 28 days), where the rat liver tissues were isolated and transcriptomic profiles were generated 24 h after the treatment. The gene expression data (raw CEL files), CEL file attributes, and corresponding pathological findings were downloaded from the website https://dbarchive.biosciencedbc.jp/en/open-tggates/download.html, accessed in January 2021. A total of 6551 transcriptomic profiles (ie, 4901 treated and 1650 controls) in 1637 treatment conditions (compound/duration/dose combinations) were obtained, corresponding to 138 compounds. The detailed information of transcriptomic profiles and their associated pathological findings were listed in Supplementary Table S1.
Microarray Data Normalization
Microarray data of InVivo_liver performed using the Affymetrix GeneChip Rat Genome 230 2.0 array were normalized with robust multi-array average (RMA; Irizarry et al., 2003). The normalized microarray data by using RMA was log2-scale values. The probes showing nonspecific binding or lacking annotations were dropped. In cases where multiple probes were assigned to a single gene, the average signal intensity of probes was used. The normalization process resulted in the expression values of 20 197 genes. Fold change values of each treatment condition (ie, compound/dose/duration) were calculated with the ratio of the treatment versus the average of the matched control group.
Molecular Representation
To develop the Tox-GAN for inferring transcriptomic profiles, we transformed chemical structure information into a numeric molecular representation. First, the canonical simplified molecular-input line-entry system format of 138 compounds was retrieved from the PubChem (Kim et al., 2021) database using PubChemPy (Swain, 2014; Supplementary Table 2). Then, molecular representations were calculated using a Python package, Mordred (Moriwaki et al., 2018), generating 1826 2- and 3-dimensional molecular descriptors for each compound.
Tox-GAN Overview
GANs are a set of unsupervised deep learning approaches that can generate new data with similar statistical distribution as the real data (Goodfellow et al., 2014). A GAN consisted of 2 models: the generator Gand the discriminator D, coordinating with each other. In our case, the generator Gwas trained to generate the transcriptomic profiles at a particular time and dose combination for a compound. Then, the generated transcriptomic profile was passed to discriminator Dto compare with the real transcriptomic profile at the same treatment conditions (ie, the same time/dose combination). If the generated transcriptomic profiles were different from the real transcriptomic profiles, the discriminator Dwould provide feedback to the generator G for improvement. The process will be repeated until the discriminator D cannot distinguish the generated transcriptomic profile from real ones. Eventually, the trained generator G could infer the transcriptomic profile at a particular time and dose combination based on the chemical information.
In this study, we developed the Tox-GAN by the combination of CGANs and the Wasserstein-GAN (WGAN) with gradient penalty to infer transcriptomic profiles based on chemical information (Figure 1). CGAN allows generating a transcriptomic profile in the specific treatment condition (ie, compounds/dose/duration; Mirza and Osindero, 2014). In WGAN, the loss function was calculated using the Wasserstein distance, improving training stability (Arjovsky et al., 2017). Gulrajani et al. (2017) further improved the training of WGAN by using an alternative to clipping weights, replacing a Lipschitz constraint on the critic with penalizing the norm of the gradient of the critic concerning its input (see ref. Gulrajani et al., 2017; for more technical details), which was applied in this study.
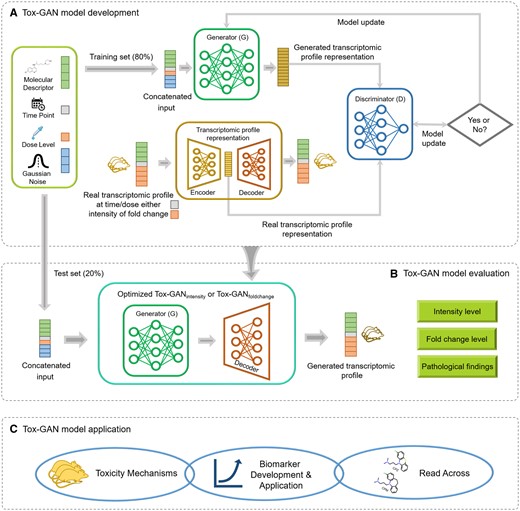
Tox-generative adversarial network (GAN) overview: We developed a Tox-GAN model with 80% of the data (A) which was evaluated with 20% of the data (B) and the model’s application was then assessed in mechanistic evaluation, biomarker development, and read-across. Specifically, (A) Tox-GAN model development. First, the concatenated information of the molecular descriptor, dosage, treatment duration, and Gaussian noise from the training set was input to the Generator G to generate the transcriptomic profile representation. Second, the real transcriptomic profile representation was generated from the real transcriptomic profiles through an autoencoder. Third, the discriminator D compared the generated and real transcriptomic profile presentation. The process was finalized until the discriminator D could not distinguish the generated and real transcriptomic profile representations. B, Tox-GAN model evaluation. The optimized Tox-GAN model was used to generate the transcriptomic profiles in the test and evaluated in the intensity, fold change, and pathological findings levels. C, Tox-GAN model application. The Tox-GAN model was applied to the 28-day repeated dose toxicity studies, predictive toxicology (eg, liver necrosis prediction), and read-across.
The construction of the generator Gand the discriminator Din Tox-GAN was elucidated in further detail below.
Generator architecture
The generator G receives 4 inputs. The first one was the molecular representation of a chemical (s), an 1826-dimensional vector of molecular descriptor values. The second input was the dose level of a compound administrated to the rat (d). For the in vivo studies in the Open TG-GATEs database, the ratio among low, middle, and high dose levels was set as 1:3:10, and we used the same setting here. The third input denotes the time point (3, 7, 14, and 28 days) of a rat (t) was treated. The final input was a 1000-dimensional Gaussian noise vector (n) sampled from a normal distribution. The Gaussian noise input aims to make the generator encode noisy inputs and decode them to noise-free outputs. If the generator is well-trained, it will have the ability to denoise and potentially improve the robustness of the model. All these 4 inputs were concatenated into a 2828-dimensional vector and were scaled to the range between 0 and 1. The concatenated 2828-dimensional vector was as input to pass into the generator G, resulting in , where was a generated representation of transcriptomic profile. The generator G (s, d, t, n) was a fully connected neural network with 4 hidden layers, 4096, 4096, 2048, and 2048 nodes. The LeakRelu as activation function was used in each layer and followed by a batch normalization procedure. The output layer followed by a tanh activation function with 1826 neurons (), was equal to the dimensionality of the real transcriptomic representation.
Discriminator architecture
The discriminatorDwas used to distinguish the generated transcriptomic representation from real ones. Considering the high dimension of transcriptomic profile (ie, 31 099 probe sets used in Rat Genome 230 2.0 Array), we developed a 5 hidden layer autoencoder to reduce the dimensions transcriptomic profiles, consisting of encoder and decoder parts. Specifically, the encoder part included an input layer with 31 099 nodes (ie, number of probes), followed by 3 hidden layers, and the sizes are 15 550 (= 31 099/2), 7775 (= 15 550/2), 1826 (the number of molecular descriptors), respectively. The decoder was the reversed order hidden layers of the encoder (ie, 1826, 7775, and 15 550 nodes), followed by the output layer (ie, the same as the input layer with 31 099 nodes). We employed the activation function the Rectified Linear Unit (ReLU) in all the hidden layers used and the sigmoid activation in the output layer. To avoid overfitting, we applied dropout with a drop rate of 0.5 and batch normalization. We used RMSprop as an optimizer and set the learning rate as 0.0001. The batch size was 256, and the number of epochs 1000 with early stopping was adopted. The autoencoder was trained to minimize the loss by measuring the difference between input and output for each training epoch. Finally, the shared hidden layer (ie, an 1826-dimensional vector, ) between encoder and decoder was extracted as a high-level representation of real transcriptomic profile in the discriminatorD. Furthermore, the decoder part was extracted from the well-trained autoencoder, which is used to reconstruct the transcriptomic profile based on the generated transcriptomic profile from the generator G.
We developed a discriminatorD, which was a 5-layer fully connected neural network. The input of the discriminatorDwas the generated transcriptomic representation () and the real transcriptomic representation () under the specific treatment condition. Followed by 3 hidden layers, the sizes of hidden neurons were 4096, 1024, and 256, respectively. We used the activation function LeakRelu in all the 3 hidden layers with the angle of the negative slope 0.2. To avoid the overfitting, we used dropout with the rate of 0.4 after each hidden layer.
Development of Tox-GAN Models
We developed 2 Tox-GAN models (Tox-GANintensity and Tox-GANfoldchange) to infer the transcriptomic profile in the intensity and fold change level, respectively. Of the 138 compounds, transcriptomic profiles of 110 compounds (approximately 80%) were randomly selected as a training set, and the remaining transcriptomic profiles of 28 compounds were used as a test set. Consequently, For Tox-GANintensity and Tox-GANfoldchange, the 4901 intensity-based transcriptomic profiles were randomly split into a training set (80%: 3909 transcriptomic profiles) and test set (20%: 992 transcriptomic profiles).
Inferring Gene Activity and Expression Profiles With Tox-GAN
To investigate the performance of the proposed Tox-GAN, we applied the optimized Tox-GAN model to infer the transcriptomic profiles in the test set and evaluate the results. Specifically, for each treatment condition (compound/time/dose combination), 100 inferred transcriptomic profiles were generated by the strategy introduced above by using Tox-GANintensity and Tox-GANfoldchange, respectively. Then, the t-distributed stochastic neighbor embedding (t-SNE) was used to visualize the distribution between the generated transcriptomic profiles and real ones. Furthermore, the Pearson correlation coefficient (rge, re) was calculated between the averaged generated transcriptomic profiles and real ones to further quantitatively evaluate the performance of Tox-GANs. Here, we provided Pearson correlation coefficients (rge, re) for all the transcriptomic profiles and ones in different pathological findings.
Inferring Toxicity Mechanisms With Tox-GAN
The 28-day repeated dose toxicity studies are commonly used to detect safety signals and to understand toxicity mechanisms. To investigate the proposed Tox-GAN for facilitating the understanding of toxicity mechanisms, we evaluated the concordance between the generated transcriptomic profiles and their corresponding real ones in a 28-day in vivo TGx setting. The Pearson correlation coefficients (rge, re) between the generated transcriptomic profiles by the proposed Tox-GANfoldchange and their corresponding real ones were calculated at low, medium, and high doses in 28 days. Moreover, to investigate whether the inferred transcriptomic profiles in high dose/28 days by the proposed Tox-GANfoldchange could represent the same toxicity mechanisms as the real ones, we compared the generated transcriptomic profiles and real ones, of which the transcriptomic profiles in high dose/28 days were provided in the Open TG-GATEs database by carrying out gene ontology (GO) enrichment analysis. Specifically, for both generated fold change data and real one, the differentially expressed genes (DEGs) in each treatment condition were determined with an absolute fold change of more than 1.5 (Supplementary Table 3). The average values were used to represent genes with multiple probes sets. Then, GO enrichment analysis was performed with the DEGs in each treatment condition by using TopGO (Alexa and Rahnenfuhre, 2019). The Benjamini-Hochberg multiple testing corrections were used, and only GO terms with adjusted p values < .05 were considered. Finally, the heatmap was used to visualize the shared and distinct GO terms enriched by DEGs obtained from the generated fold change data and the real one in each treatment condition.
Verification of Tox-GAN Model by Control Analyses
Intensity profiles are highly dependent on the tissue of origin, and thus one would expect that any 2 profiles derived from rat liver would be highly correlated. Similarly, many compounds induce common xenobiotic stress responses in the liver. Thus, one would expect the fold-change profiles for many different chemical treatments to show at least moderate correlation. Therefore, control analyses were imperative to verify the generated transcriptomic profiles from the proposed Tox-GAN model. For that, we carried out the control analyses across intensity, fold change, and GO levels. Specifically, we calculated the Pearson correlation coefficients between pairs from treatment (ie, compound/time/dose combination) based on real transcriptomic profiles as controls for intensity and fold change levels, respectively. Subsequently, the distribution of 1 339 066 (1637 × 1636/2) Pearson correlation coefficients for intensity and fold change levels were generated as controls, respectively. Then, we compared the distribution of real transcriptomic profiles and those generated to the control distribution with a Wilcoxon rank-sum test. For GO level, the GO terms were enriched in each of 25 high dose/28-day treatment conditions using TopGO (Alexa and Rahnenfuhre, 2019). Then, the R package GOSemSim (Yu et al., 2010), which considered the parent-child relationships of GO terms organized as a directed acrylic graph, was used to calculate the similarities between sets of enriched GO terms. Similarities of enriched GO terms between pairs from treatment (ie, compound/time/dose combination) were calculated as controls. Next, we compared the similarity distribution yielded by real and generated profiles to controls with a Wilcoxon rank-sum test.
Applicability Domain of the Tox-GAN Model
To define the applicability domain of the proposed Tox-GAN model, we investigated Pearson correlation coefficients between the generated transcriptomic profiles and real profiles for each therapeutic category defined by the WHO Anatomical Therapeutic Chemical (ATC) Classification System for Tox-GANinternsity and Tox-GANfoldchange, respectively. The ATC classification system consists of 5 levels to characterize a compound according to (1) the system/organ the compound acts on, (2) therapeutic use, (3) pharmacological functions, (4) chemical properties, and (5) the compound itself. Here, we employed the first level of ATC codes to divide the compounds based on the system/organ the compound acts on (Supplementary Table 2).
Tox-GAN for Toxicity Pathways
Furthermore, we investigated Pearson correlation coefficients between the generated transcriptomic profiles and real profiles within gene sets involved in different toxicity-related pathways. Specifically, we downloaded the gene-pathway associations (version updated on September 29, 2021) from the Comparative Toxicogenomics Database (CTD; Davis et al., 2017). There are a total of 135 789 gene-pathway relationships, corresponding to 11 586 genes and 2363 pathways. The gene symbols (ie, Entrez Gene IDs) in the CTD were based on Homo sapiens. We mapped Entrez gene IDs from H. sapiens to Rattus norvegicus based on NCBI HomoloGene database (https://ftp.ncbi.nih.gov/pub/HomoloGene/, last accessed October 20, 2021). We only retained pathways containing more than 200 genes for further analysis, obtaining a total of 106 toxicity-related pathways (Supplementary Table 4). Then, we calculated Pearson correlation coefficients between generated transcriptomic profiles using Tox-GANfoldchange and their corresponding real profiles within the gene sets involved in the 106 toxicity-related pathways. Finally, we ranked the toxicity-related pathways based on the average Pearson correlation coefficient.
Biomarker Development—Liver Necrosis Prediction
Liver necrosis was employed to explore the potential application of the Tox-GAN model in biomarker development. Necrosis is a common finding in acute and chronic liver disease. The accurate prediction of liver necrosis is of great importance for early detection and prevention of severe liver-related symptoms (Krishna, 2017). First, we mapped treatment conditions in rat liver repeated dose onto different pathological findings. Here, we hypothesized that the liver necrosis signal was embedded in transcriptomic profiles under different treatment conditions. In other words, for each treatment condition, if there is at least 1 sample that has necrosis finding, we consider the transcriptomic profiles under this treatment condition have necrosis signal. Eventually, we obtained 115 treatment conditions with liver necrosis (Supplementary Table 5). Second, we randomly selected 115 of 531 treatment conditions without liver necrosis as negatives. Third, all replicates under the given treatment were averaged for the real transcriptomic data under the 230 treatment conditions (115 liver necrosis and 115 nonliver necrosis). For the generated transcriptomic profiles, 100 generated transcriptomic profiles under each of the 230 treatment conditions were inferred using the developed Tox-GANintensity model and averaged. Next, the 230 treatment conditions (115 liver necrosis and 115 nonliver necrosis) were stratified divided into a training set (80%: 184 treatment conditions, 552 transcriptomic profiles) and test set (20%: 46 treatment conditions, 136 transcriptomic profiles) by preserving the 1:1 ratio of positives and negatives. Finally, we developed DNN models to predict liver necrosis based on 2 scenarios: (1) develop the DNN model with the real transcriptomic profiles in the training set and predict the real transcriptomic profiles in the independent test set (2) develop the DNN model with the generated transcriptomic profiles in the training set and predict the real transcriptomic profiles in the independent test set. Here, we use the same test set consisting of the real transcriptomic profiles to investigate whether the DNN model developed by generated transcriptomic profiles could achieve comparable prediction power compared with the DNN model with the real transcriptomic profiles.
We developed a 7 hidden layer DNN (LeCun et al., 2015) fed with a 3 hidden layer (consisting of 1000, 1000, and 1000 U) autoencoder model for liver necrosis prediction based on the 2 aforementioned scenarios. A DNN is a multilayer neural network consisting of fully connected hidden layer(s) between an input layer and an output layer, composed of 1000 hidden units in each hidden layer. The input layer loaded with the transcriptomic profile and the output layer provided a probability of liver necrosis classification. We used the activation function ReLU for all the hidden layers and applied the dropout with a drop rate of 0.5 and batch normalization to avoid overfitting. We used the sigmoid activation function with a threshold of 0.5 for liver necrosis prediction for the output layer. Our model provided a binary result where 1 (if the sigmoid output value of the output layer > 0.5) represents liver necrosis and 0 represents nonliver necrosis. The binary cross-entropy loss function was employed to calculate the loss between the predicted value and the actual value. The input batch size was 16, Adam was applied as the optimizer, and the learning rate was 0.0001. The number of epochs was 1000, with an early stopping strategy implemented.
One of the essential applications of the transcriptome-based predictive models is to facilitate biomarker development. Here, we conducted a comparative analysis between the relative importance of individual genes in their liver necrosis DNN models to investigate the consistency between potential biomarkers derived from DNN models based on generated transcriptomic profiles and real profiles. We extracted the important genes that contributed to the developed DNN models based on the real transcriptomic profiles and generated profiles by using the Deep Approximate Shapley Propagation (DASP) method (Ancona et al., 2019). The Shapley value is a method from coalitional game theory, which is used to explain important features in the model contributing to the DNN model output. The top rank-ordered features in the 2 DNN models (ie, based on generated transcriptomic profiles and real ones) were extracted using the DASP method. The percentage of overlapping genes (POGs) was calculated to compare the 2 rank-ordered gene lists. The POG represented the number of shared genes between the important genes derived from the 2 DNN models divided by L, the number of genes in each subset of the ranked gene list. In this study, L was set from 5 to 300.
Read-Across
Read-across exploits chemical information to predict toxicity based on the hypothesis that compounds with similar chemical structures share similar toxicological profiles (Ball et al., 2016). A major concern in standard read-across applications is that of “activity cliffs” where chemicals with similar structures have large differences in bioactivity and resulting hazards. In vitro and in vivo screening methods, including transcriptomics, may overcome this limitation. Specifically, information on biological data-based read-across (eg, TGx) could add extra value to this application (Liu et al., 2019; Zhu et al., 2016). We examined whether the generated transcriptomic profiles using Tox-GAN could have improved discriminational power to distinguish compounds with similar chemical structures. We calculated the pairwise similarity (ie, Tanimoto coefficients) between any 2 chemical structures of 138 compounds based on extended connectivity fingerprint using Pipeline Pilot v8.0 (Accelrys, Biovia, and Dassault Systems). A total of 9453 (138 × 137/2) pairwise similarities were generated for the 138 compounds. Then, we employed the developed Tox-GANfoldchange to generate the transcriptomic profiles of all 138 compounds at all 12 time and dose conditions (3 doses × 4 durations). Next, we calculated pairwise similarities (ie, Pearson correlation coefficients) of a total of 9453 drug pairs at each of 12 time and dose combinations (Supplementary Table 6). Finally, we employed our published Pair Ranking (PRank) method to assess the concordance of pairwise similarities between chemical space and transcriptomic space (Liu et al., 2017b).
External Validation of the Tox-GAN Model With DrugMatrix
To further validate the proposed Tox-GAN model, we employed another large publicly available TGx dataset (ie, DrugMatrix; Ganter et al., 2006b). DrugMatrix is a comprehensive rat TGx resource made public by the NTP, containing TGx data on 636 compounds across 7 different tissues. We downloaded data for rat liver assayed by Affymetrix microarray technology from the Gene Expression Omnibus (https://www.ncbi.nlm.nih.gov/geo/, last accessed October 15, 2021) with accession number GSE57815, which contains 2218 gene expression profiles sampled from male Sprague-Dawley rat liver tissue treatment with 200 compounds and 279 vehicle control-treated liver samples from male Sprague-Dawley rats kept in matched conditions. We downloaded the compound dose information of the DrugMatrix Database from ftp://anonftp.niehs.nih.gov/ntp-cebs/datatype/Drug_Matrix/DrugMatrixPostgreSqlDatabase.tar.gz (last accessed October 15, 2021). Compounds were administered in multiple doses (generally 2 doses) and for different durations (0.25–7 days). Of the 200 compounds, 38 compounds were included in the Open TG-GATEs. Chemical structures of 3 compounds were not available. The average gene expression was calculated to represent its transcriptomic response if 1 compound was administrated using different vehicles. In total, 500 collapsed transcriptomic profiles at different compound/dose/time combinations of 159 compounds were achieved as an independent validation dataset (Supplementary Table 7). We employed the same microarray data preprocessing approaches (ie, RMA normalization) to process transcriptomic profiles in DrugMatrix.
Dose level is one of the inputs for the developed Tox-GAN models. In TG-GATEs, the maximum tolerated dose (MTD) representing each compound’s upper limit of tolerability was estimated from a preliminary 7-day repeated dosing study using a computerized stratified random grouping method based on individual body weight, which was considered as the highest dose level. Then, low/middle/high doses were assigned with a ratio low, middle, and high dose of 1:3:10 of MTD dose (Uehara et al. 2010). In DrugMatrix, both the MTD as well as the fully effective dose was used. The MTD was determined by a 5-day daily dosing range-finding study, while the effective or low dose was intended to be approximate the fully effective pharmacologically active dose (Ganter et al., 2005). Considering the divergence of the dose designs in the 2 databases, we employed the following strategy to assign the dose level of DrugMatrix samples. If compounds with more than 3 doses were used, it was relatively straightforward to assign the dose level of profiling samples as low/middle/high according to their dose values. Otherwise, considering the dose used in DrugMatrix is higher than in TG-GATEs in general, we set DrugMatrix’s dose level as high/middle (Supplementary Table 7). Furthermore, the control samples in the 2 different databases are also different. In TG-GATEs, transcriptomic profiles in different treatment conditions had matched controls. However, the shared controls across compounds were used in DrugMatrix. Therefore, we only employed Tox-GANintenisty to carry out the external validation study. Transcriptomic profiles in the independent validation dataset were generated in each treatment condition using Tox-GANintensity. Specifically, for each treatment condition, we generated 100 transcriptomic profiles by resampling 100 vectors of noises. Then, the Pearson correlation coefficients between averaged generated transcriptomic profiles and corresponding real ones were calculated.
Code Availability
Data preparation was performed using R. GO enrichment was evaluated using TopGO (Alexa and Rahnenfuhre, 2019). All the AI approaches, including the autoencoders, DNNs, and the GANs, were built and trained using PyTorch version 1.4.0 with CUDA 10.1 under open-source Python (version 3.8.5). The t-SNE analysis was carried out by using Python scikit-learn package (version 0.23.2). The scripts used to generate results and the developed Tox-GAN models in this study are available at https://github.com/XC-NCTR/Tox-GAN.
RESULTS
Tox-GAN Enabling Transcriptomic Profile Inference Based on Chemical Information
Figure 1 illustrates the architecture of the Tox-GAN model. Considering the high dimensions of the transcriptomic profiles of Open TG-GATEs data (ie, InVivo_liver), we developed an autoencoder to reduce the dimensions to allow extraction and incorporation as a transcriptomic representation in the Tox-GAN model. Meanwhile, the decoder part of the autoencoder was frozen to reconstruct the transcriptomic profile. In our proposed Tox-GAN model, the generator G received a concatenated vector consisting of 4 types of information (ie, molecular representation, time point, dose level, and random noise sampled from a Gaussian distribution) as an input to produce representations of transcriptomic profiles induced by a particular treatment condition. Meanwhile, the discriminator D was tasked to distinguish between the generated transcriptomic representations and real ones. At each training step, as the generator Gtried to produce transcriptomic profiles similar to the real ones, the discriminator D became better in distinguishing between gene expression data produced by the generator and provided feedback to update the generator. The process continued until the discriminator could not distinguish the generated transcriptomic profiles from the real ones.
To obtain the optimized Tox-GAN models, we proposed a hybrid approach by combining the minimum loss function of the WGAN with a postoptimization strategy (see Materials and Methods section). Supplementary Figure 1 illustrates the respective trend of loss along with training epochs based on the training set for Tox-GANintensity and Tox_GANfoldchange. The generator G and the discriminator D losses tended to be stable after 3k and 5k epochs for Tox-GANintensity and Tox_GANfoldchange, respectively. Furthermore, the similarity between the generated transcriptomic profiles and their corresponding real ones reached the maximum (ie, the average of rge, re = 0.997 ± 0.001 for Tox-GANintensity and rge, re = 0.753 ± 0.082 for Tox-GANfoldchange) at 7k and 10k epochs for Tox-GANintensity and Tox_GANfoldchange (Figure 2). Eventually, the optimized Tox-GANintensity was derived from 7k checkpoints, and the optimized Tox-GANfoldchange was derived from 10k checkpoints for transcriptomic profile inference.
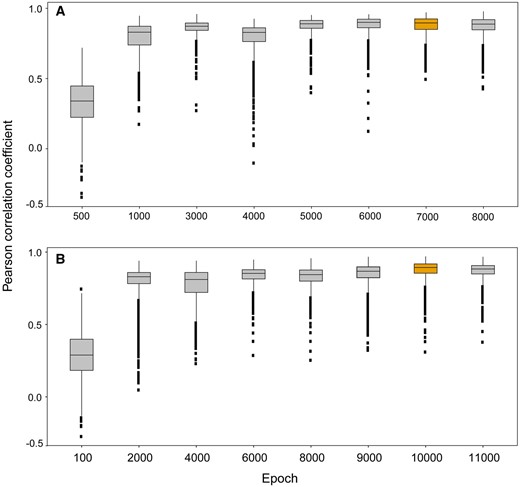
The optimization of Tox-generative adversarial network (GAN) models. The Pearson correlation coefficient between the generated transcriptomic profiles and their corresponding real ones in training set across different training epochs for (A) Tox-GANintensity and (B) Tox-GANfoldchange, respectively. The training epochs corresponding to optimized Tox-GAN models were highlighted in yellow color.
To investigate the performance of the optimized Tox-GANintensity and Tox_GANfoldchange models, we applied the models to infer transcriptomic profiles in the test set. The t-SNE plots depicted the distribution of generated transcriptomic profiles, and real ones were well matched within the Gaussian distribution for both Tox-GANintensity and Tox_GANfoldchange models (Figure 3). Furthermore, the average and standard deviation of Pearson correlation coefficients (rge, re) between the generated transcriptomic profile and their corresponding real ones were 0.997 ± 0.002 and 0.740 ± 0.082 for Tox-GANintensity and Tox_GANfoldchange, suggesting the strong capability of the proposed Tox-GAN for inferring transcriptomic profiles in both intensity and fold change levels.
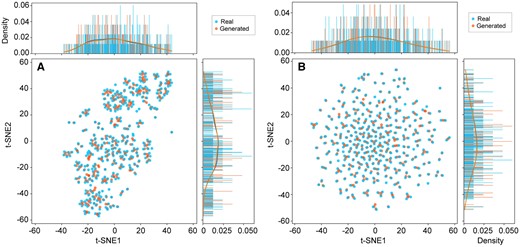
t-Distributed stochastic neighbor embedding visualization and probability density of the generated and real transcriptomic profiles in the test set. The blue and orange points are the real and their corresponding generated ones from (A) Tox-GANintensity and (B) Tox-GANfoldchange, respectively.
To further investigate whether the performance of Tox-GAN models was influenced by specific pathological findings, we calculated Pearson correlation coefficients (rge, re) between the generated transcriptomic profiles and their corresponding real ones for each specific pathological finding in the test set (Figure 4). The generated transcriptomic profiles and the corresponding real ones had high similarity with an average rge, re of 0.997 ± 0.002 for Tox-GANintensity, indicating transcriptomic profiles produced Tox-GAN could well capture the genomic responses in different phenotypes (Figure 4). The pathological findings with the highest and lowest average Pearson correlation coefficients were Hypertrophy (ie, rge, re = 0.997 ± 0.001) and Eosinophilic change (ie, rge, re = 0.996 ± 0.001).
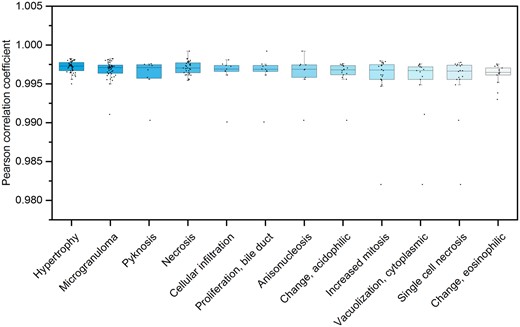
The distribution of Pearson correlation coefficient between generated transcriptomic profiles from Tox-GANintensity and their corresponding real ones across pathological findings in the test set: the treatment conditions were categorized into different pathological findings. Then, the distributions of Pearson correlation coefficients between the generated transcriptomic profiles and their corresponding real ones under each pathological finding were presented.
Considering a Gaussian noise vector was part of the input of the Tox-GAN model, we further investigated whether the robustness of the Tox-GAN model with different Gaussian noise as the input. For that, we employed the trained Tox-GAN models (ie, Tox-GANinternsity and Tox-GANfoldchange) to infer the transcriptomic profiles in the test set with different Gaussian noise and repeated 3 times. For each treatment condition, an average of 100 generated transcriptomic profiles were calculated using compound chemical representation and 100 different random noises at specific doses and time combinations. Then, we compared the Pearson correlation coefficients between the real transcriptomic profiles and generated profiles among the 3 times (Supplementary Figure 2). The distributions of Pearson correlation coefficients in the 3 runs were the same for both Tox-GANinternsity and Tox-GANfoldchange, indicating the robustness of the Tox-GAN model despite variants of Gaussian noise.
Tox-GAN Facilitating Understanding of Toxicity Mechanisms
The 28-day repeated dose toxicity study is a standard toxicity experimental design to assess safety of a compound. To verify the potential utility of the proposed Tox-GAN to predict the genomic response in the 28-day repeated dose toxicity study, we conducted a comprehensive comparison of the generated transcriptomic profiles with their actual profiles at both gene and functional levels. The boxplots illustrate the correlation between the generated transcriptomic profiles and their real profiles in the test set for different dosing regimens on 28 days (Figs. 5A and 5B). For Tox-GANintensity, the average and standard deviation of Pearson correlation coefficients (rge, re) were 0.997 ± 0.001, 0.997 ± 0.001, and 0.997 ± 0.001 for low/medium/high dose on 28 days, respectively. For Tox-GANfoldchange, the average and standard deviation of Pearson correlation coefficients (rge, re) were 0.715 ± 0.059, 0.738 ± 0.059, and 0.781 ± 0.071 for low/medium/high dose on 28 days, respectively. The high Pearson correlation coefficients (rge, re) suggested the potential utility of the proposed Tox-GAN to refine the 28-day repeated dose toxicity study.
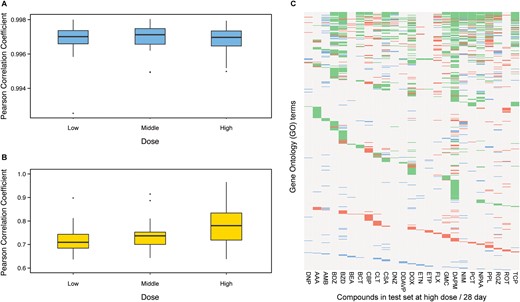
Application of Tox-generative adversarial network (GAN) in 28-day repeated dose toxicity studies in the test set: The box plot of the Pearson correlation coefficient between the generated transcriptomic profiles and their corresponding real ones in different dose levels in the 28-day repeated dose toxicity studies in the test set using Tox-GANintensity (A) and Tox-GANfoldchange (B), respectively. In the plot (C), the concordance in enriched gene ontology (GO) terms based on differentially expressed gene (DEGs) between generated transcriptomic profiles from Tox-GANfoldchange and their corresponding real ones at high dose/28-day conditions in the test set were presented. DEGs were these with fold change of >1.5 between treated and matched control conditions. The green, blue and red dots denote the GO terms that are agreed between the generated transcriptomic profiles and their corresponding real ones, only appeared in the generated transcriptomic profiles, or only appeared in the real transcriptomic profiles, respectively.
Moreover, we carried out GO enrichment analysis to compare the generated transcriptomic profiles and their corresponding ones at a high dose/28 days to confirm whether the same biological processes were detected (Figure 5C). Since the DEGs were derived from fold change values for each treatment condition, the evaluation was carried out using Tox-GANfoldchange only (Supplementary Table 3). Consequently, there were 839 GO terms enriched by real and/or generated transcriptomic profiles at the 25 high dose/28-day conditions in the test set, in which 796 GO terms were enriched by all of the 25 real profiles and 658 GO terms were enriched by all the generated profiles. The average concordance between the generated transcriptomic profiles and their corresponding ones of the 25 compounds in the test set is 0.870, indicating that the generated transcriptomic profiles could reflect actual profiles.
Generated Transcriptomic Profiles and Enriched GO Terms Against Control
Control analyses were employed to justify whether the generated transcriptomic profiles and enriched GO terms could represent the real profiles in the test set using a Wilcoxon rank-sum test (Figure 6). For Tox-GANintensity, the average Pearson correlation coefficient (0.997 ± 0.002) between the generated transcriptomic profiles and their corresponding real profiles in the test set is higher than the ones (0.986 ± 0.008) generated between different treatment conditions (ie, controls) with a p value 1.437 × 10−207. Similarly, we observed the same trend in the control analyses for Tox-GANfoldchange with an average Pearson correlation coefficient of 0.750 ± 0.082 and 0.041 ± 0.098 for generated versus real profiles in the test set and controls, respectively (p = 2.682 × 10−218)In the GO terms level, the average similarity score (ie, 0.870 ± 0.153) between enriched GO terms of generated profiles and those of real profiles in the test set with high dose/28-day conditions was much higher than that from 2 different random treatment conditions (ie, 0.388 ± 0.15) with a p value 4.958 × 10⁻¹⁶. Altogether, it is indicated that the generated transcriptomic profiles and enriched GO terms by the proposed Tox-GAN could well represent the real profiles.
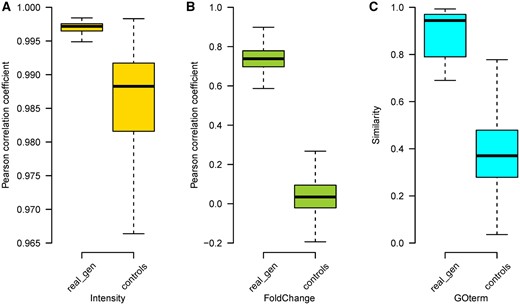
Control analyses of Tox-generative adversarial network results in the test set: The Pearson correlation coefficients between pairs of every 2 treatments (ie, compound/time/dose combination) based on real transcriptomic profiles were calculated as controls. The Pearson correlation coefficients (real_gen) between generated profiles and their corresponding real profiles in the test set were calculated against the background rates for both expression intensity (A) and fold change (B). For gene ontology (GO) term (C), similarities of enriched GO terms between pairs of any 2 treatments were used as the background rate for comparison with the enriched GO terms generated from differentially expressed genes between the generated and real transcriptomic expression profiles at high dose/28-day conditions in the test set. The GO terms similarity was calculated by using R package GOSemSim.
Applicability Domains of the Tox-GAN Model
Considering the compounds cover wide therapeutic classes, we explored the applicability domain of the Tox-GANs model to facilitate real-world applications. Figure 7 illustrated the distribution of the Pearson correlation coefficients between the generated transcriptomic profiles and the real profiles for each therapeutic category. For Tox-GANintensity, the average Pearson correlation coefficients for all the therapeutic categories are over 0.995. Among them, the top therapeutic categories with the highest/lowest average Pearson correlation coefficients were H—systemic hormonal preparations, excluding sex hormones and insulins (rge, re = 0.997 ± 6.798 × 10⁻⁴) and V—various (rge, re = 0.997 ± 0.001), respectively. However, the distributions of Pearson correlation coefficients between the 2 therapeutic categories were not statistically significant. For Tox-GANfoldchange, the average Pearson correlation coefficients of the therapeutic category P—antiparasitic products, insecticides, and repellents (rge, re = 0.795 ± 0.075) outperformed other therapeutic categories, and the therapeutic category V—various yielded the lowest average Pearson correlation coefficient (rge, re = 0.723 ± 0.058).
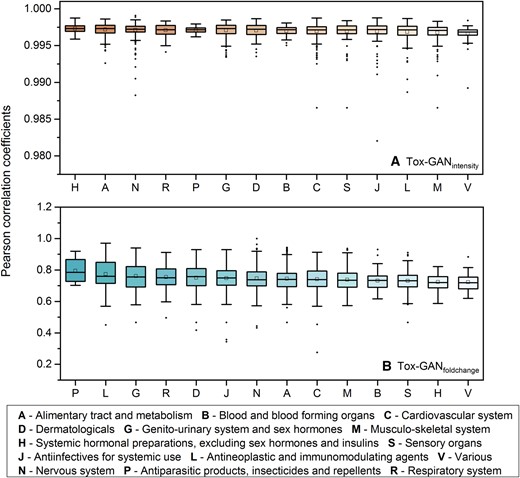
Tox-generative adversarial network (GAN) performance across different drug classes: Distribution of Pearson correlation coefficients between generated transcriptomic profiles and their corresponding real ones in different therapeutic categories for (A) Tox-GANintenisty and (B) Tox-GANfoldchange, where the compounds were mapped onto the first level of WHO ATC Classification. Here, the whole dataset (ie, training set + test set) was employed in the analysis.
Tox-GAN for Toxicity Pathways
Figure 8 illustrated the distribution of Pearson correlation coefficients between generated transcriptomic profiles using Tox-GANfoldchange and their corresponding real profiles within the gene sets involved in each of 106 toxicity-related pathways. The average Pearson correlation coefficients were in a range of 0.777 ± 0.109 to 0.736 ± 0.146 (Supplementary Table 4). The top-ranked pathways with the highest average Pearson correlation coefficients were metabolism-related pathways such as Metabolism of carbohydrates (rge,re = 0.777 ± 0.109), Metabolism of amino acids and derivatives (rge,re = 0.773 ± 0.108), and Metabolism of lipids and lipoproteins (rge,re = 0.770 ± 0.101). The 5 toxicity-related pathways with the lowest average Pearson correlation coefficients includes Olfactory transduction (rge, re = 0.736 ± 0.146), G-protein-coupled receptor (GPCR) ligand binding (rge,re = 0.739 ± 0.092), Transmission across Chemical Synapses (rge,re = 0.739 ± 0.105), Neuroactive ligand-receptor interaction (rge,re = 0.740 ± 0.100), and Neuronal System (rge, re = 0.741 ± 0.095).
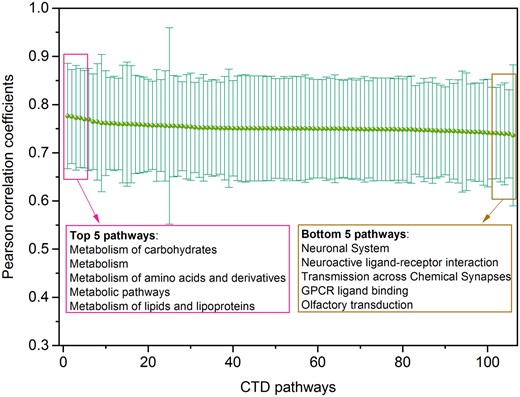
Pathway analysis of Tox-generative adversarial network (GAN) results: Distribution of Pearson correlation coefficients between generated transcriptomic profiles and their corresponding real ones with gene sets involved in different toxicity-related pathways, where the transcriptomic profiles were generated using Tox-GANfoldchange. There are a total of 106 toxicity-related pathways with at least 200 genes involved extracted from Comparative Toxicogenomics Database . The pink and brown boxes listed the top/down 5 pathways with the highest/lowest average Pearson correlation coefficients.
Tox-GAN Enhancing Biomarker Development—Liver Necrosis Prediction
One of the applications of TGx is to enhance predictive toxicology with biomarker discovery. To demonstrate the potential of the Tox-GAN model in biomarker development, we developed 2 DNN models for liver necrosis prediction using the same training samples, but one with real transcriptomic profiles (scenario No. 1) and the other with generated transcriptomic profiles (scenario No. 2) and both models were subsequently applied to the same test set with real profiles (Figure 9A; see Materials and Methods section). We also compared the concordance in prediction between 2 scenarios on the individual sample levels and presented them in the 2 × 2 contingency table. As summarized in Figures 9B and 9C, both analyses revealed high comparability between 2 scenarios and highlighted the potential utility of Tox-GAN in predictive toxicology.
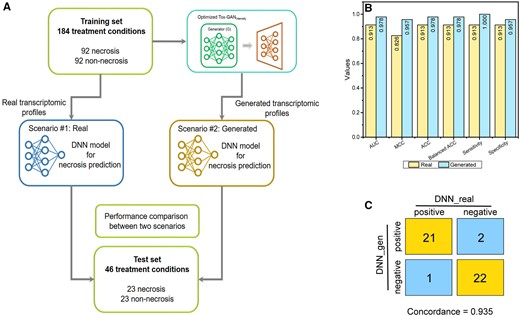
Tox-generative adversarial network for Biomarker Development: (A) 2 scenarios of biomarker development for necrosis were constructed, where scenario No. 1 used the real data, whereas scenario No. 2 was the generated data. In both scenarios, the same 230 treatment conditions were divided into the training and test sets with a ratio of 8:2. For each scenario, a deep neural network (DNN) model was developed which was further evaluated with the test set. B, The performance metrics of the developed DNN models on the test set for both scenarios, where the light yellow and blue colors represent scenarios No. 1 (ie, DNN with real transcriptomic profiles) and No. 2 (ie, DNN with generated transcriptomic profiles), respectively. C, The 2 × 2 contingency matrix compared predictions of 2 scenarios where the predicted probabilistic values of 0.5 separated positives (necrosis) from negatives (no necrosis).
We also closely examined and compared the underlying genes as the biomarkers from both scenarios. Specifically, the POGs was calculated based on shared genes between rank-ordered gene lists from the 2 DNN models using the DAMP method (Ancona et al., 2019; see Materials and Methods section and Supplementary Table 8). As illustrated in Figure 10, the highest concordance (ie, average POG > 0.824 in the top 300 important genes) was obtained between 2 rank-order important genes lists, demonstrating the DNN model developed by generated transcriptomic profiles could well represent real profiles for potential biomarker identification.
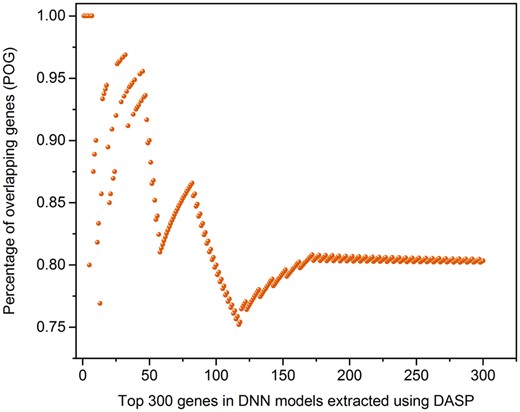
The concordance of biomarker genes between Tox-generative adversarial network (GAN) model versus the model from the real data: Percentage of overlapping genes between the top-ranking genes derived from liver necrosis deep neural network (DNN) models based on generated transcriptomic profiles and real ones were compared where the generated transcriptomic profiles were from Tox-GANintensity. The important genes were extracted from DNN models using the Deep Approximate Shapley Propagation method.
Tox-GAN Aiding Read-Across
One possible enhancement in read-across is incorporating biological profiles to improve the performance of chemical information-based read-across (Zhu et al., 2016). To examine if Tox-GAN could aid chemical information-based read-across, we investigated the concordance of pairwise similarities based on chemical structures and generated transcriptomic profiles by using the PRank method (Liu et al. 2017b; Figure 11). The PRank scores between chemical space and TGx space (ie, generated transcriptomic profiles and real ones) were in a range of 0.501–0.693 for different time and dose combinations, which implied no strong concordance between chemical space and TGx space. Furthermore, the high concordance (ie, PRank scores: in a range of 0.726–0.969) between generated transcriptomic profiles and real profiles at all time and dose combinations were obtained, especially in the high dose and long duration setting (PRank scores > 0.940 at high dose of 8, 15, and 29 days). Moreover, the concordance between chemical structure and generated transcriptomic profiles and real ones were very similar, indicating the potential utility in replacing the need for real transcriptomic profiles. Figure 12 illustrates the similarity between the generated transcriptomic profiles using Tox-GANfoldchange at high dose/28 days condition of top 15 compound pairs with highest chemical similarity. Here, the similarities (ie, Tanimoto correlation coefficients) of the top 15 compound pairs were in the range of 0.51–0.81. Noticeably, not all high chemical similarity pairs were from the same pharmacological class, indicating their toxicological profiles could be very different (Supplementary Table 6). In general, the similarities between transcriptomic profiles (in the range of −0.22 to 0.45) were much smaller than those of chemical structure, suggesting the transcriptomic profiles may offer a distinct benefit for read-across. Furthermore, the similarity based on the generated transcriptomic profiles was very similar to the real transcriptomic profiles, demonstrating the utility of the Tox-GAN model in the biological profile-based read-across. It was also worth emphasizing that expression similarities are often lower than chemical similarities, and differences should be considered in relative terms.
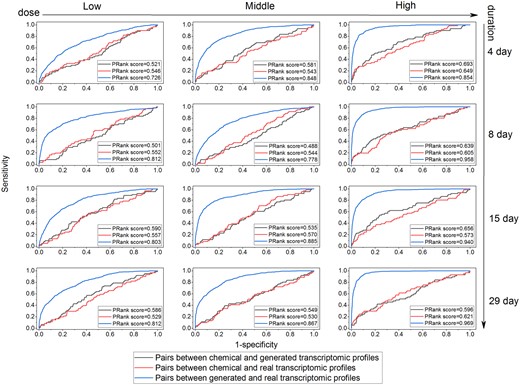
Chemical space versus transcriptomic spaces through pairwise similarity assessment of drugs: Pairwise similarities of drugs based on either transcriptomic data or chemical data were calculated using Prank algorithm. Tox-GANfoldchange was employed to generate transcriptomic profiles. The receiver operating characteristic-area under the curve analysis compared pairwise similarities based on chemical and generated transcriptomic profiles, chemical and real transcriptomic profiles, and real and generated transcriptomic profiles were represented with gray, red, and blue color, respectively.
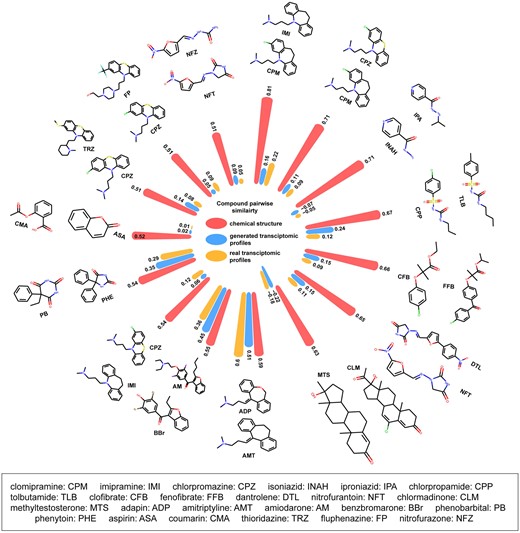
Application of Tox-generative adversarial network (GAN) in read-across. The circle bar plot illustrates the similarities between the top 15 drug pairs in the chemical space, generated transcriptomic profiles, and corresponding real ones with red, blue, and yellow colors, respectively. The chemical structures of drug pairs were illustrated.
Tox-GAN Validation with DrugMatrix Data
Tox-GAN was developed on the data from TG-GATEs, and its validity was further validated with the data from DrugMatrix (see Materials and Methods section). Specifically, Tox-GANintensity was used to generate transcriptomics profiles of 500 treatment conditions (compound/time/dose combination) and then compared with their real transcriptomic data reported in DrugMatrix (Figure 13). The overall average and standard deviation of Pearson correlation coefficients between averaged generated transcriptomic profiles, and their corresponding real ones were 0.978 ± 0.004. There is no statistical difference in Pearson correlation coefficient distributions under different time and dose conditions. We observed that the overall real-generated correlation (rge, re = 0.978 ± 0.004) was slightly lower in DrugMatrix than in the TG-GATEs test set (rge, re = 0.997 ± 0.002), which may be due to the potential batch effect of transcriptomic profiles between the TG-GATEs and DrugMatrix.
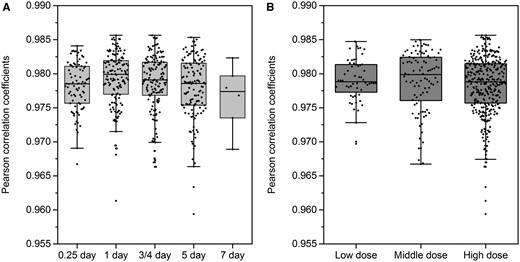
The distribution of Pearson correlation coefficients between generated transcriptomic profiles and their corresponding real ones in different (A) time point and (B) doses in DrugMatrix: the 500 transcriptomic profiles in different treatment condition of DrugMatrix were generated using Tox-GANintensity. Here, the 500 transcriptomic profiles in the DrugMatrix serve as an independent test set, where the compounds are not overlapped with the compounds in the Open Toxicogenomics Project-Genomics-Assisted Toxicity Evaluation system database.
DISCUSSION
Animal models are integral to the assessment of toxicity for regulatory applications in many sectors. These animal studies provide invaluable information and play a critical role in evaluating risk-benefit profiles for new drugs before the initiation of clinical trials. Meanwhile, the 21st century toxicology is increasingly moving toward 3Rs animal uses. We hypothesized that the accumulated animal data in the past could be learned with AI to generate new animal results without conducing animal studies. For that, we proposed a GAN-based framework titled Tox-GAN to learn from the existing animal data to the point that it could generate new animal data just from chemical information in combination of dosage and treatment durations. We tested the framework on TGx studies and we found that the developed Tox-GAN models could generate transcriptomic profiles that were highly correlated with their actual profiles both in intensity and in fold changes. Furthermore, we demonstrated that Tox-GAN could facilitate understanding toxicity mechanisms, enhance biomarker development in predictive toxicology (ie, liver necrosis prediction), and aid read-across applications. The publicly accessible Tox-GAN algorithm through https://github.com/XC-NCTR/Tox-GAN can be utilized by the community to estimate in vivo transcriptomic profiles without the need for animal studies.
GANs, as generative models, have shown some promise in the field of biomedicine (Green et al., 2021; Méndez-Lucio et al., 2020; Umarov et al., 2021). In toxicology, eliminating animal use is one of the primary goals for next-generation toxicology. However, training a GAN model is a challenging task due to the nature of the distribution estimation. Many different GAN architectures have been proposed to improve training efficacy and target-specific data generation (https://github.com/hindupuravinash/the-gan-zoo). In Tox-GAN, besides adopting the integrated CGAN and WGAN-GP for enabling the treatment condition-specific inference, we implemented a postmodification strategy to select the optimized Tox-GAN with generated transcriptomic profiles closest to the corresponding actual profiles.
One of the challenges in predictive toxicology is the limited sample size for machine learning model development (Liu et al., 2019; Muratov et al., 2020). TGx studies typically contain only a few hundred compounds, which may not be sufficient to develop a robust model for a real-world application. Some initial efforts have been made to explore the possibility of using transcriptomic profiles generated from immortalized cell lines (Kohonen et al., 2017; Li et al., 2020). We developed Tox-GAN using in vivo repeated dose transcriptomic profiles from the Open TG-GATEs project to prove the concept. The proposed Tox-GAN model architecture could be further utilized to transform biological information from 1 type to another. For example, the LINCS L1000 data contains the transcriptomic profiles of more than 20K compounds across more than 100 different cell cultures and species, a great resource to further expand the Tox-GAN model to address additional toxicological questions (Subramanian et al., 2017).
The rationale behind chemical-based read-across is that the compounds with similar chemical structures result in similar toxicities. However, concerns have been raised on the hypothesis of chemical structure based on read-across due to its high false-positive rates (Zhu et al., 2016). Here, we explored the potential of the proposed Tox-GAN model for aiding chemical-based read-across. For example, the 2 compounds, Doxepin and Amitriptyline have similar therapeutic usage and toxicity profiles, both are used for antidepression purposes and could cause mild and transient serum enzyme elevations but is a rare cause of clinically apparent acute cholestatic liver injury. We observed that their chemical structures were similar (ie, Tanimoto similarity = 0.59), and their generated transcriptomic profiles were also similar (Pearson correlation coefficient r = .51). However, for the 2 compounds, Isoniazid and iproniazid, they differed minimally in terms of structure (ie, Tanimoto similarity = 0.71) but exhibited profound differences in terms of toxicity. Isoniazid is widely used in tuberculosis treatment, whereas iproniazid is an antidepressant that has been withdrawn from the market due to severe liver toxicity. We observed their considerable divergence between the generated transcriptomic profiles (Pearson correlation coefficient r = −.07).
The proposed Tox-GAN model aims to infer transcriptomic profiles in TGx to reduce animal use. The Tox-GAN model could be considered as a virtual experiment framework to generate animal data. Therefore, the generated transcriptomic profiles for unseen compounds are similar those generated via experimentation under the TG-GATEs experiment design. To validate the proposed Tox-GAN model, we employed another large TGx dataset (ie, DrugMatrix), the inference results (rge, re = 0.978 ± 0.004) are encouraging. However, the small numerical difference between real versus generated and controls (Figure 6) suggests that further study on external fold change datasets will be needed. There are still opportunities to further improve the model to expand its general utility in real-world applications. Specifically, the current input of dose level in Tox-GAN is just specified by 3 simple levels (ie, low, middle, and high), limiting its application in inferring transcriptomic profiles at different doses. Furthermore, the Tox-GANfoldchange could only support the matched control design, which also hinders its application. With that said, we position the proposed Tox-GAN model in the experiment design-specific inference framework to infer transcriptomic profiles following TG-GATEs experimental protocol.
There are opportunities to improve the proposed Tox-GAN model even further. First, tens of thousands of hypermeter combinations could be further fine-tuned, enhancing the Tox-GAN model performance. However, we could not implement such an expansive search of the entire hypermeter space with limited computational resources, which requires a cloud computing system or a massive supercomputer. Second, the current version of Tox-GAN was developed to infer transcriptomic profiles for rat liver repeated-dose data. Further work on transforming chemical information to histological pathology images will be worthy of investigation and could offer the opportunity to further reduce animal use. Finally, the proposed Tox-GAN was developed by integrating CGAN and WGAN. Considering different GAN architectures have been proposed, we recommend further investigation on these different GAN architectures to further improve performance.
GANs provided a unique solution for inferring different profiles from limited or from no information. To the best of our best knowledge, the proposed Tox-GAN is the first report of the application of GAN models to TGx. Our study offers an opportunity to motivate the community in exploring the potential of GAN models to address different biomedical questions.
SUPPLEMENTARY DATA
Supplementary data are available at Toxicological Sciences online.
AUTHORS CONTRIBUTIONS
Z.L. and W.T. conceived and designed the study. X.C. and Z.L. performed the model development and computational analysis. Z.L. and X.C. wrote the article. R.R., W.T., and Z.L. revised the article. All authors read and approved the final article.
Disclaimer: This article reflects the views of the authors and does not necessarily reflect those of the Food and Drug Administration. Any mention of commercial products is for clarification only and is not intended as approval, endorsement, or recommendation.
ACKNOWLEDGMENTS
X.C. is grateful to the National Center for Toxicological Research (NCTR) of the U.S. Food and Drug Administration (FDA) for postdoctoral support through the Oak Ridge Institute for Science and Education (ORISE).
DECLARATION OF CONFLICTING INTERESTS
R.R. is cofounder and codirector of ApconiX, an integrated toxicology and ion channel company that provides expert advice on nonclinical aspects of drug discovery and drug development to academia, industry, and not-for-profit organizations. R.R. was an FDA contractor during the duration of this project.

Comments