


Abstract
Brominated flame retardants (BFR) are molecules added to consumer products to reduce fire hazards. They were banned in North America and Europe because of their persistence and biomagnification. However, BFR are still released in the environment due to continued use of products manufactured before restriction, and from waste and recycling processes of those products. As a result, they remain sources of chronic environmental and human exposure worldwide. BFR are well-characterized endocrine disruptors. They have been associated with a wide range of alterations in endocrine and reproductive systems both in humans and experimental models in vivo and in vitro. Paradoxically, the effects of BFR on mammary glands, whose development and carcinogenesis are mainly under hormonal dependency are poorly known. There is increasing weight of evidence that exposure to endocrine disruptors promotes breast cancer, especially if the exposure occurs during sensitivity windows. For the mammary gland, these windows include the perinatal life, puberty, and pregnancy, as important remodeling of the organ happens during those periods. The peak of exposure to BFRs happened during late 1990s and beginning of 2000s in most countries. Women who were pregnant at that time are reaching menopause while their daughters are 20–30 years old. It is thus important to better understand the effects of BFRs on mammary gland development and breast cancer to determine whether these women are more at risk. Thus, this review aims to propose a comprehensive review of data reporting the effects of exposure to BFR on female endocrine and reproductive systems, with a particular focus on mammary gland development and of a potential increased risk of breast cancer.
Fire retardants are molecules added to combustible materials such as foam, plastics, textiles, and wood products, among others, to reduce fire hazards and meet safety standards (Alaee et al., 2003). Brominated flame retardants (BFR) represent a diverse group of fire retardants that have a bromine in their structure (Alaee et al., 2003). Two of the most widely used BFR in the last decades were hexabromocyclododecane (HBCDD) and the polybrominated diphenyl ethers (PBDEs). PBDEs are a large family of 209 compounds that contain a common diphenyl ether core but differ in the degree of bromination (Rahman et al., 2001). In the market, PBDEs were available in mixtures of several congeners that were blended in commercial formulations (Alaee et al., 2003). Decabromodiphenyl ether, octabromodiphenyl ether, and pentabromodiphenyl ether represented the major commercial mixtures of PBDEs (Birnbaum and Staskal, 2004). They were mainly used in polyurethane furniture foams, carpet underlay, and epoxy resins in electrical and electronic equipment (Alaee et al., 2003).
BFR are either bound to the matrix as reactive mixtures or dissolved in the polymer materials as additives; PBDEs and HBCDD were additive flame retardants (Eljarrat and Barceló, 2011). Because they are noncovalently bound to the polymers, PBDEs, and HBCDD consistently leach out from the products to the environment (Besis and Samara, 2012). Consequently, they are found in air, water, soil, sediment, and accumulate in living organisms, both in industrial and isolated areas such as the arctic (Birnbaum and Staskal, 2004; Darnerud ,2003). BFR are lipophilic molecules that bioaccumulate and in most cases persist in the environment (Segev et al., 2009). Accordingly, PBDEs and HBCDD have been classified as persistent organic pollutants, and their use, sale, offer for sale, and importation have been restricted in Europe and North America (Environment and Climate Change Canada, 2011; Environment Canada, 2008). In addition, they were identified for global removal by the Stockholm Convention (http://chm.pops.int/TheConvention/ThePOPs/ListingofPOPs/tabid/2509). Although commercial use of PBDEs and HBCDD has been prohibited several years ago, their presence in existing products, as well as recycling and waste stream processes of products containing BFR remain current and future sources of environmental release of BFR and of human exposure (Abbasi et al., 2019; Alaee et al., 2003; Shaw et al., 2010; Sjodin et al., 2003).
Nonoccupationally related human exposure to BFR is more likely to occur in indoor areas (Butt et al., 2004; Wilford et al., 2005), as demonstrated by greater concentrations of PBDEs in indoor samples rather than outdoor ones (Butt et al., 2004; Stapleton et al., 2005; Wilford et al., 2005). Exposure to BFR occurs mostly through ingestion and inhalation of house dust and through food consumption (Allen et al., 2006; Bocio et al., 2003; Schecter et al., 2004; Stapleton et al., 2005). BFR are detected in several human tissues such as serum, adipose tissue, placenta, umbilical cord, and breast milk (Jakobsson et al., 2012; Johnson-Restrepo et al., 2005; Mazdai et al., 2003; Morland et al., 2005; Schecter et al., 2003, 2010; She et al., 2002; Sjodin et al., 2004; Toms et al., 2009a,b; Zota et al., 2013). Toddlers represent the most exposed population primarily due to indirect contamination in utero and through breast milk (Chen et al., 2014; Frederiksen et al., 2010; Herbstman et al., 2007; Leonetti et al., 2016; Schecter et al., 2003; Zhao et al., 2013), but also because of their closer proximity to the ground and of their propensity for hand-to-mouth contacts (Jones-Otazo et al., 2005; Stapleton et al., 2005, 2008; Toms et al., 2009b). Although it varies considerably between countries and areas, the highest daily intake of PBDEs from the environment (air, dust, etc.), food, and water range from ≈10 to 2600 ng/kg/bw for infants, and from ≈1 to 2.5 ng/kg/bw for adults for PBDEs (Fromme et al., 2016; Health Canada, 2006). These values are typically below the regulatory limits imposed by most countries (U.S EPA., 2017; Health Canada, 2006). Nevertheless, the overall weight of evidence from the last decade has raised concerns about the potential of PBDEs and HBCDD to be associated with, or to elicit, various adverse health effects in humans and wildlife. Most of the studies using PBDEs, and to a lesser extent HBCDD, have reported alteration in endocrine, neurodevelopmental, reproductive, and developmental systems, which were summarized in multiple comprehensive reviews (Alaee et al., 2003; Berghuis et al., 2015; Darnerud et al., 2001; Eljarrat and Barceló, 2011; Shaw et al., 2010; Sjodin et al., 2003; Wu et al., 2020). However, only a limited number of studies have analyzed the potential of BFR to affect the mammary gland, whose function, development, and carcinogenesis is highly regulated by ovarian and other systemic hormones (Brisken and Ataca, 2015; Dianati et al., 2017; Gouesse et al., 2019, 2021; Kodavanti et al., 2010). Thus, this work aims to propose a comprehensive review of data reporting the effects of exposure to BFR, focusing on female endocrine and reproductive systems, and on mammary gland development and risk for breast cancer.
EFFECTS OF EXPOSURE TO BFRs ON FEMALE ENDOCRINE AND REPRODUCTIVE SYSTEMS
Effects of PBDEs and HBCDD on Thyroid Homeostasis
Several studies have analyzed the relationship between circulating hormone levels and concentrations of PBDEs in various tissues in women. Interestingly, exposure to PBDEs seemed to affect mainly the thyroid hormones (Table 1), probably due to their structural resemblance to thyroxine (T4), the precursor of triiodothyronine (T3). Thyroid hormones in serum are regulated by negative feedbacks: when the levels of hormones decrease, the pituitary gland secretes thyroid stimulating hormone (TSH), thus stimulating the secretion of thyroid hormones. Elevated plasma levels of BDE-47, -100, and total PBDEs were associated with an increased prevalence of hypothyroidism among Canadian women aged 30–50 years (Oulhote et al., 2016). Similarly, higher serum concentrations of BDE-47, -99, and -100, as well as the sum of all PBDEs, were associated with increased odds of having thyroid diseases in a population of women from the National Health and Examination Survey (Allen et al., 2016). However, the risks were greater in postmenopausal women, suggesting that low estrogen levels during menopause could enhance the negative impact of PBDEs on thyroid hormone signaling (Allen et al., 2016). Studies in animal models have confirmed the effects of exposure to PBDEs on T4, T3, and TSH levels (Table 1). A decrease in serum T4 levels was commonly reported in female rodents following exposure to PBDEs, as well as decreased or increased T3 serum levels (Fowles et al., 1994; Hallgren et al., 2001; Richardson et al., 2008; Stoker et al., 2004; Van der Ven et al., 2008; Zhou et al., 2001, 2002). In toddlers, a cross-sectional study of 80 young U.S. children (35 girls vs 45 boys aged 1–5) reported that serum PBDE congeners (BDE-47, -99, and -100) were associated with higher TSH concentrations, a tendency toward decreased levels of total T4 and increased levels of free T3 (Jacobson et al., 2016). Similar positive relationship between serum total PBDEs levels (Han et al., 2011) or BDE-47 (Kiciński et al., 2012) and TSH were found in children (boys and girls) living in electronic waste areas in China, and in Belgium teenagers (boys and girls), respectively.
Effects of Brominated Flame Retardants on Thyroid Homeostasis
| Type of Exposure/Populations Exposed | Compounds | Doses or Levels Measured | Effects | Species | References |
|---|---|---|---|---|---|
| Adults | BDE-47, -100, and ΣPBDEs | 9.0, 0.9, and 16.0 ng/g of lipids (geometric mean) | Hypothyroidism | Human | Oulhote et al. (2016) |
| BDE-47, -99, -100, and ΣPBDEs | 19.6, below limit of dertection (LOD), and 3.7 ng/g of lipids (geometric mean) | Thyroid diseases | Human | Allen et al. (2016) | |
| HBCDD | 104.9 ng/g of lipids (geometric mean) | Thyroid abnormalities | Human | Li et al. (2014) | |
| DE-71 | Acute single doses of DE-71 of 0, 0.8, 4.0, 20, 100, or 500 mg/kg or subchronic daily doses totaling 0, 250, 500, or 1000 mg/kg over a 14-day period | Decreased T4 levels; increased/decreased T3 levels | Mice | Fowles et al. (1994) | |
| Tetra- and pentabromodiphenyl ethers | 50 or 500 mg/kg BW | Decreased total and free T4 | Mice and rats | Hallgren et al. (2001) | |
| BDE-47 | 0, 3, 10, or 100 mg/kg/day | Decreased total T4 | Mice | Richardson et al. (2008) | |
| DE-71 | 0–30 mg/kg/day | Decreased total T4 | Rats | Van der Ven et al. (2008) | |
| HBCDD | 0, 0.3, 1, 3, 10, 30, 100, and 200 mg/kg/day | Increased weight of the pituitary and thyroid glands; altered histology of the thyroid gland; increased TSH; decreased levels of free T4 | Rats | Van der Ven et al. (2006) | |
| Infant, toddler, and teenagers | BDE-47, -99, -100, and ΣPBDEs | 0.15, 0.04, 0.02, and 0.25 ng/ml (geometric mean) | Higher TSH concentrations; decreases of total T4; increased levels of free T3 | Human | Jacobson et al. (2016) |
| ΣPBDEs | 664.28 ng/g of lipids (average) | Higher TSH concentrations | Human | Han et al. (2011) | |
| BDE-99 and -100 | Between ≤limit of detection and 12, and between ≤limit of detection and 42 ng/g of lipids | Decreased free T3 | Human | Kiciński et al. (2012) | |
| BDE-47 | Between ≤limit of detection and 104 ng/g of lipids | higher TSH concentrations | Human | Kiciński et al. (2012) | |
| ΣPBDEs | 7 ng/g of lipids (median) | Decreased free T3, increased free T4, increased TSH | Human | Kiciński et al. (2012) | |
| HBCDD | 49.5 μg/kg of BW/day | Altered histology of the thyroid gland | Mice | Rasinger et al. (2018) | |
| HBCDD, BDE-47 | 199 mg/kg bw/day and 450 µg/kg bw/day; | Altered histology of the thyroid gland | Mice | Maranghi et al. (2013) | |
| Pregnancy | BDE-28, -47, -99, -100, -153, and ΣPBDEs | 0.6, 15.3, 4.5, 2.8, 2.4, and 26.5 ng/g lipids (geometric mean) | Lower levels of TSH around the 27th week of gestation; subclinical hyperthyroidism (low TSH but normal T4) | Human | Chevrier et al. (2010) |
| BDE-47 and -85 and ΣPBDE of pentabromodiphenyl ethers | 43.1, 0.82, and 85.8 ng/g of lipids (geometric mean) | Higher TSH prior to second trimester | Human | Zota et al. (2011) | |
| BDE-207 | 1.63 ng/g of lipids (geometric mean) | Lower TSH prior to second trimester | Human | Zota et al. (2011) | |
| PBDEs metabolites | 0.092 ng/g of lipids (geometric mean) | Higher TSH prior to second trimester | Human | Zota et al. (2011) | |
| BDE-47, -99, and -100 | 16.5, 4.72, and 4.19 ng/g of lipids (geometric mean) | Higher total and free T4, increased T3, between 18 and 28 weeks of gestation | Human | Stapleton et al. (2011) | |
| BDE-47 | 1.05 ng/g of lipids (median) | Decreased total T3 | Human | Kim et al. (2013) | |
| ΣPBDEs | 2.13 ng/g of lipids (median) | Decreased free and total T3 and increased T4 levels, prior to delivery | Human | Kim et al. (2013) | |
| BDE-47, -99 and ΣPBDEs | 21.47, 2.32, and 30.92 ng/g of lipids (50th percentile) | Decreased total T3 and T4; increased free T3 and free T4 < 20 weeks of pregnancy | Human | Abdelouahab et al. (2013) | |
| BDE-99 | 2.32 ng/g of lipids (50th percentile) | Decreased total T4 at delivery | Human | Abdelouahab et al. (2013) | |
| BDE-47 and ΣPBDEs | 21.47 and 30.92 ng/g of lipids (50th percentile) | Decreased free T3 at delivery | Human | Abdelouahab et al. (2013) | |
| BDE-154 and -153 | 2.081 and 4.218 ng/g of lipids (mean) | Higher TSH | Human | Kim et al. (2012) | |
| BDE-154 and -153 | 2.081 and 4.218 ng/g of lipids (mean) | Decreased T3 levels | Human | Kim et al. (2012) | |
| BDE-49 and -66 | 5.567 and 0.055 ng/g of lipids (mean) | Increased T4 levels | Human | Kim et al. (2012) | |
| DE-71 | 18 mg/kg BW/day | Decreased T4 levels | Rats | Ellis-Hutchings et al. (2006) | |
| DE-71 | 1.7, 10.2, and 30.6 mg/kg/day | Decreased T4 levels | Rats | Kodavanti et al. (2010) | |
| DE-71 | 0.3, 3.0, or 30 mg/kg/day | Decreased T4 and T3 levels | Rats | Bowers et al. (2015) | |
| DE-71 | 30 or 60 mg/kg mg/kg/day | Decreased T4 levels | Rats | Stoker et al. (2004) | |
| DE-71 | 1, 10, and 30 mg/kg/day | Decreased T4 | Rats | Zhou et al. (2002) | |
| BDE-99 | 60 or 300 μg/kg BW | Decreased total T4 and T3 levels | Rats | Kuriyama et al. (2007) | |
| BDE-47 | 3.2 mg/kg feed | Decreased total T4 and T3 levels | Rats | Wang et al. (2011) | |
| Mixture of DE-71, DE-79, BDE 209, and HBCDD | 250 and 750 mg/kg | Decreased T4 levels | Rats | Tung et al. (2016) | |
| HBCDD | 1500 or 15 000 ppm | Decreases in size of thyroid follicle, increases in serum levels of TSH, decreased T4 levels | Rats | Ema et al. (2008) | |
| Deca-BDE | 1500 and 2500 mg/kg | Decreased T4 and T3 levels | Mice | Chi et al. (2011) | |
| Perinatal, gestational, and lactational | BDE-47, -99, and ΣPBDEs | 20.5 (mean), 2.3 (mean), and 30.92 (50th percentile) ng/g of lipids | Decreased levels of total T4 and free T4 in umbilical-cord | Human | Abdelouahab et al. (2013) |
| BDE-47 and ΣPBDEs | 21.1 and 39.6 ng/g of lipids (geometric mean) | Decreased TSH levels | Human | Vuong et al. (2018) | |
| BDE-99 and ΣPBDEs | 4.8 and 39.6 ng/g of lipids (geometric mean) | Increased free T3 levels | Human | Vuong et al. 2018 | |
| BDE-47, -99, -100,-153, and ΣPBDEs | 15.3, 4.2, 2.7, 2.3, and 28.0 ng/g of lipids (geometric mean) | No effects on TSH | Human | Chevrier et al., (2011) | |
| BDE-99 and -100 | 2.02 and 1.56 ng/g of lipids (geometric mean) | Increased T3 placental levels | Human | Leonetti et al. (2016) | |
| BDE-47 and -99 | 3.0 and 3.0 ng/g of lipids (median) | Increased TSH | Human | Kim et al. (2015) | |
| BDE-47, 99, 153, 154, 209, and HBCDD | 0.95, 0.26, 0.42, 0.03, 0.25, and 0.54 ng/g of lipids (median) | No effects on TSH | Human | Eggesbo et al. (2011) | |
| HBCDD | From < Method detection limits to 166 ng/g lipid (mean: 8.55 ng/g lipid) | Hypothyroidism | Human | Kim and Oh (2014) | |
| HBCDD | 150, 1500, or 15 000 ppm | Decreases in size of thyroid follicle and increases in serum levels of TSH | Rats | Ema et al. (2008) | |
| DE-71 | 5 and 25 mg/kg dose groups | decreased levels of T4 and T3 | Rats | Bondy et al. (2013) | |
| DE-71 | 18 mg/kg | Decreased levels of T4 | Rats | Ellis-Hutchings et al. (2006) | |
| DE-71 | 10 and 30 mg/kb/day | Decreased T4 | Rats | Zhou et al. (2002) | |
| DE-71 | 10.2 or 30.6 mg/kg/day | Decreased T4 | Rats | Kodavanti et al. (2010) | |
| DE-71 | 30 and ≥3 mg/kg/day | Decreased T4 and T3 levels | Rats | Bowers et al. (2015) | |
| BDE-99 | 1 mg/kg/day (estimated LOAEL) and 2 mg/kg/day | Decreased levels of T4 and T3 | Rats | Blanco et al. (2013) | |
| Mixture of DE-71, DE-79, BDE 209, and HBCDD | 250 and 750 mg/kg | Decreased T4 levels | Rats | Tung et al. (2016) | |
| BDE-209 | 5, 40, or 320 mg/kg of BW/day | Decreased T4 | Rats | Kim et al. (2009) | |
| BDE-47 | BDE-47 (3.2 and 32 mg/kg feed) | Decreased total T4 and T3 levels | Rats | Wang et al. (2011) |
Although less studied, HBCDD also seemed to affect thyroid hormone signaling. A limited number of studies have investigated the relationship between HBCDD concentrations in human tissues and the levels of thyroid hormones, and their results were contradictory (Table 1). On one hand, HBCDD measured in serum did not show significant effects on levels of free T4, T3, and TSH in teenagers in Belgium (Kiciński et al., 2012). On the other hand, higher serum levels of HBCDD were associated with thyroid abnormalities in women and men residing near a production source of HBCDD (Li et al., 2014). The differences in the age or in levels of exposure between the studied populations could potentially explain this discrepancy. In virgin female Wistar rats, a 28-day exposure to HBCDD resulted in increased weight of the pituitary and thyroid glands, altered histology of the thyroid gland, and increased TSH immunostaining in thyrotropic cells (van der Ven et al., 2006). The female rats also exhibited decreased levels of free T4, but levels of total T3 were not affected (van der Ven et al., 2006). Altered histology of the thyroid gland was also observed in juvenile mice exposed to dietary levels of HBCDD within the lowest observed adverse effect (LOAEL) range (Maranghi et al., 2013).
Studies have demonstrated that pregnant women exposed to PBDEs also showed dysregulation of thyroid hormone homeostasis (Table 1). Different associations were observed, depending on the stage of pregnancy. For instance, exposure to PBDEs was associated with lower levels of TSH around the 27th week of gestation, while no association was observed when analyzing free or total T4 levels (Chevrier et al., 2010). In contrast, a study on second trimester pregnant women reported a positive association between TSH and serum concentrations of lower-brominated PBDE congeners, individual hydroxylated PBDE metabolites, and their sum, whereas finding a negative association with BDE-207 (ZoTa et al., 2011). Significant positive association between serum levels of BDE-47, -99, and -100 with free and total T4 was also observed in a cohort of North-Carolina women during the third trimester of pregnancy (Stapleton et al., 2011). When analyzing maternal blood collected prior to delivery, studies have found either significant negative association with PBDEs and free and total T3, and positive association with free T4 (Kim et al., 2013), or no association between these endpoints (Mazdai et al., 2003). Changes in thyroid homeostasis were also observed in a cohort of women in Quebec, where maternal serum concentration of PBDEs, collected at < 20 weeks of pregnancy, was significantly inversely associated with T3 and T4 but positively correlated with free T3 and free T4 (Abdelouahab et al., 2013). When hormone measurements were undertaken on maternal blood collected at delivery; however, there was an inverse relationship between maternal free T3 and total T4 and the levels of PBDEs in the serum collected at < 20 weeks (Abdelouahab et al., 2013). To our knowledge, no study has reported effects of BFRs on other hormones during pregnancy. Thereby, although some discrepancies are found between those studies, potentially due to the PBDEs congeners analyzed, the level of exposure, the time of exposure, and/or potential other confounding factors, an exposure to PBDEs seems to impact the thyroid homeostasis in pregnant women.
Interestingly, in both humans and animals, direct exposure of mothers to BFRs during pregnancy and/or lactation can also influence thyroid hormone homeostasis in infants (Table 1). For example, lower cord blood levels of free T4, but not total T4, T3, nor TSH, were associated to higher PBDEs concentrations found in maternal serum (Abdelouahab et al., 2013). Other studies analyzing the relationship between PBDEs levels in cord blood and serum levels of thyroid hormones in infants pointed out that in utero exposure to PBDEs may impact development of the endocrine system in offspring (Kim et al., 2012, 2015; Lin et al., 2011). Repeated serum measurement of thyroid hormones and PBDEs levels in 162 mother-child pairs showed that prenatal exposure to PBDEs was associated with significant decrease in TSH levels in female offspring at 3 years (Vuong et al., 2018). HBCDD has been measured in the serum of pregnant women and their infants (Meijer et al., 2008), as well as in human breast milk (Ryan and Rawn, 2014; Wemken et al., 2020), resulting in a higher daily intake of HBCDD in breastfed babies (Wang et al., 2020). However, there are limited studies analyzing the links between HBCDD and effects on the thyroid signaling in mothers and infants, and the results are divergent. In one study, no correlations were observed between levels of HBCDD found in mothers’ breast milk and the serum levels of TSH in the babies (Eggesbo et al., 2011). In another study, no differences were observed in serum levels of HBCDD or thyroid hormones between infants suffering from hypothyroidism and control (Kim and Oh, 2014), although the authors hypothesized that therapeutic injection of synthetic T4 medication could explain the absence of effects (Kim et al., 2012). However, levels of HBCDD were higher in serum of mothers of infants with congenital hypothyroidism compared with control mothers (Kim and Oh, 2014), suggesting that maternal exposure to HBCDD could influence the risk of hypothyroidism in the infant.
In rats, HBCDD triggered both decreases in size of thyroid follicle and increases in serum levels of TSH in F0 and F1 female, but serum T4 levels were decreased only in dams (Ema et al., 2008). Similarly, in one-generation studies in rats, gestational and lactational exposure to PBDEs resulted in lower maternal levels of serum T4 (Bondy et al., 2013; Chi et al., 2011; Ellis-Hutchings et al., 2006; Kodavanti et al., 2010; Kuriyama et al., 2007; Wang et al., 2011), sometimes associated with decreased T3 levels (Bowers et al., 2015; Chi et al., 2011; Zhang et al., 2009). Interestingly, thyroid hormones homeostasis was also impaired in pups exposed to PBDEs during in utero life and/or during lactation, as decreased levels of T4 and/or T3 has been found in several studies (Blanco et al., 2013; Bondy et al., 2013; Bowers et al., 2015; Ellis-Hutchings et al., 2006; Kodavanti et al., 2010; Tung et al., 2016; Wang et al., 2011; Zhang et al., 2009; Zhou et al., 2002).
Effects of PBDEs and HBCDD on Other Endocrine Pathways
Altogether, these studies suggested that PBDEs and HBCDD can alter the thyroid homeostasis in women. However, less information is available regarding other endocrine perturbations induced by these compounds, especially in humans. To our knowledge, only 2 studies have investigated the relationship between PBDEs and the estrogenic signaling in women. In both studies, serum PBDEs were not associated with markers of the estrogenic pathway analyzed by the authors (Karmaus et al., 2011; Wan et al., 2010). However, a few in vivo and in vitro studies showed the potency of PBDEs and their metabolites to exhibit estrogen (ER)-, progesterone (PR), and androgen (AR) receptors-, agonistic and antiagonistic activities (Hamers et al., 2006; Kojima et al., 2009; Meerts et al., 2001; Mercado-Feliciano and Bigsby, 2008a,b; Stoker et al., 2005). Using in vitro assay (CALUX bioassays [H4IIE, U-2 OS, T47-D cells], Estradiol sulfotransferase assay, TTR-binding assay, and T-Screen [GH3 cells]), Hamers et al. (2006) tested 27 individual BFRs, including 19 PBDEs and HBCDD, for their endocrine properties. Although they did not find AR- or PR-agonistic activities for any BFRs, most of them were antiandrogenic and antiprogestagenic, the more potent being BDE-19 and -100, and -19, respectively. Similar to other studies using T47-D cells, they also showed that low-brominated PBDEs (≤ hexa-brominated BDE-155) were estrogenic, whereas high-brominated PBDEs were antiestrogenic (tetra-brominated BDE-79, and all hepta-brominated PBDEs). Using similar in vitro assays as mentioned earlier, PBDEs and their metabolites have also been shown to inhibit the estradiol sulfotransferase, to increase the bioavailability of endogenous estrogens (Hamers et al., 2008; Kester et al., 2002), and to inhibit the aromatase activity in human placenta microsome fractions (Canton et al., 2008). In addition, it has also been demonstrated that PBDEs metabolites possess endocrine disruptive properties in various cells lines (Kojima et al., 2009; Mercado-Feliciano and Bigsby 2008a; Ren and Guo, 2013).
Similarly, a few in vitro experiments demonstrated that HBCDD can disrupt sex steroid axis (Hamers et al., 2006). HBCDD can act as an estrogen antagonist in transactivation assays using Chinese hamster ovary cells (Kojima et al., 2009) but also enhance estrogenic (Dorosh et al., 2011) and androgenic activity (Christen et al., 2010) in MCF-7 and MDA-kb2 cells, respectively. This ability of HBCDD to interfere with ovarian steroidogenesis was confirmed using an in vitro co-coculture model of granulosa and theca porcine cells that exhibited increases sex hormone secretion when exposed to a mixture containing high levels of HBCDD (Gregoraszczuk et al., 2008). Moreover, it has been suggested that HBCDD may alter ovulation as demonstrated by its ability to disrupts cell signaling in FSH-stimulated primary granulosa cells isolated from juvenile 21- to 24-day-old female rats (Fa et al., 2014).
Together, these data suggest that PBDEs and HBCDD may dysregulate various endocrine pathways within cells, which might impact the development and function of hormone-dependent organs.
Effects of PBDEs and HBCDD on Reproductive Organs and During Pregnancy
Only a few studies have assessed the relationship between exposure to PBDEs and reproductive endpoints in women (Table 2), and, to the best of our knowledge, no study has analyzed the effects of HBCDD in this context. Higher serum PBDEs concentrations were associated with an earlier age at menarche in a cohort of 271 adolescents in the United States (Chen et al., 2011). In adult women, disrupted menstrual cycle length was associated with BDE-74 and -153 plasma concentrations in a cohort of 42 Cree First Nations women in Canada (Wainman et al., 2016). Similarly, Chao et al. (2007, 2010) found a positive association between longer menstrual cycle and serum PBDEs concentration in breast milk obtained from women from southern Taiwan, and no significant effects in women from central Taiwan. However, these findings were questionable because of the small sample size of 46 and 20 women. Higher levels of BDE-47, -99, -100, and 153 in maternal serum of women from an agricultural region of California were associated with an extended time before pregnancy in one study (Harley et al., 2010). When analyzing pathologic reproductive situations, such as early pregnancy loss, it was shown that women exhibiting high levels of BDE-153 in the follicular fluid had increased risks of implantation failure (Johnson et al., 2012). However, no association was found between PBDE serum concentration in women and polycystic ovary syndrome (PCOS) (Vagi et al., 2014). Although results from these studies are difficult to compare due to the different types of samples used to measure PBDEs, age of the participants, and levels of exposure (Table 2), it seems that PBDE-47 and -153 are the dominant congeners, in term of levels founds in women, and could be linked with the adverse effects observed.
Effects of Polybrominated Diphenyl Ethers on Reproductive Endpoints in Women
| Populations Studied | Region/Country | Compounds (Main Detected, Decreasing Order) | Levels Measured (ng/g Lipids) | Sample Analyzed | Effects | References |
|---|---|---|---|---|---|---|
| 271 adolescent girls (age 12–19 years) | NHANES 2003–2004, USA | BDE-47, -153, -99, and -100 | 26.2, 6.1, 5.5, and 4.3 (median) | Serum | Earlier age at menarche | Chen et al. (2011) |
| 31 women (19.9–42.6 years old) | Remote Cree First Nation communities in subarctic Canada | BDE-47 and -153 | 14.1 and 4.5 (geometric mean) | Plasma | Disrupted menstrual cycle length | Wainman et al. (2016) |
| 46 women (22–41 years old) | Southern Taiwan | BDE-153, -47, and -209 | 1.08, 0.571, and 0.471 (arithmetic mean) | Breast milk | Longer menstrual cycle | Chao et al. (2010) |
| 20 women (24–36 years old) | Central Taiwan | BDE-47 and -153 | 1.52 and 0.871 (arithmetic mean) | Breast milk | No significant effects on cycle and menstrual length | Chao et al. (2007) |
| 223 women (21.5–27.3 years old) | CHAMACOS study, 1999–2000, Salinas Valley, an agricultural region of California (USA) | BDE-47, -99, -100, and 153 | 14.9, 4.4, 2.8, and 2.5 (geometric mean) | Maternal serum | Extended time before pregnancy | Harley et al. (2010) |
| 65 women (27–44 years old) going through in vitro fertilization or intracytoplasmic sperm injection procedures | Boston area (USA) | BDE-153 | 0.007 (mean) | Follicular fluid | Elevated odds of failed implantation | Johnson et al. (2012) |
| 52 women with PCOS (18–45 years old) | Los Angeles (USA) | BDE-47, -153, -100, -99, and -28 | 24.9, 5.1, 4.8, 4.7, and 1.9 (geometric mean) | Serum | No association between PBDEs and POCS | Vagi et al. (2014) |
A few studies have also been published using in vivo models exposed to PBDEs and HBCDD. In animals, most of the studies reported no changes in uterine weight, number of pregnancies, gestation length, successful delivery, litter size, number of alive pups, and sex ratio upon exposure to PBDEs during pregnancy for the dams (Cheng et al., 2009; Koenig et al., 2012; Ta et al., 2011; Zhao et al., 2014). However, associations were found between exposure to PBDEs and disrupted steroidogenesis and folliculogenesis in adult females (Lefevre et al., 2016). In Juvenile 22-day-old mice, low doses of HBCDD, based on dietary human exposure, led to histopathological changes in the uterus and disruption of sex steroid hormones, as demonstrated by decreased serum levels of 17β-estradiol (Rasinger et al., 2018) and an increase of testosterone to 17β-estradiol ratio (Maranghi et al., 2013; Rasinger et al., 2018).
Effects of a Perinatal, Gestational, or Lactational Exposure to PBDEs and HBCDD
In humans, a few studies have focused on the effects of maternal exposure to PBDEs on reproductive development in offspring. Although Leijs et al. (2008) did not find any association between current exposure to PBDEs and age at menarche in a small cohort of girls, prenatal exposure to high levels of PBDEs was correlated to later age at menarche in a larger population (Harley et al., 2017). In contrast, dysregulation of reproductive development was more frequently reported in animals exposed to PBDEs, or to a mixture of PBDEs and HBCDD, in utero, through lactation, or during early postnatal life (Allais et al., 2020; Lilienthal et al., 2006; Stoker et al., 2004; Talsness et al., 2008). Specifically, BFR exposure has been reported to either delay (PBDE-99, 10 mg/kg/day; DE-71, 60 mg/kg/day; Lilienthal et al., 2006; Stoker et al., 2004) or advance puberty (mixture of DE-71, DE-79, BDE-209, and HBCDD; 0, 0.06, 20, or 60 mg/kg/day; Allais et al., 2020). This impairment in the timing of puberty was associated with alteration of the number, maturation, and functional markers of ovarian follicles (Allais et al., 2020; Lilienthal et al., 2006; Talsness et al., 2008). Such disruption in ovarian development and function was supported by in vitro studies using porcine antral follicles that exhibited an altered steroid hormone production and expression of steroidogenic enzymes following exposure to PBDEs metabolites (Karpeta et al., 2013), or to a mixture reflecting human blood levels of PBDEs (Karpeta and Gregoraszczuk, 2010). In a 2-generation study, exposure to HBCDD resulted in a significant reduction in the number of the primordial follicles in the ovary of F1 females (Ema et al., 2008). Premating, gestational, and lactational exposure to HBCDD also led to a delayed vaginal opening in rat female pups (van der Ven et al., 2009).
Altogether, these findings highlight the potential of PBDEs and HBCDD to disrupt endocrine and reproductive signaling in human and in experimental models. Thyroid homeostasis seems to be the major target, but BFRs can also exhibit ER-, PR-, and AR-, agonistic and antiagonistic activities (Hamers et al., 2006; Kojima et al., 2009; Meerts et al., 2001; Mercado-Feliciano and Bigsby 2008a,b). Although more studies are required to confirm these findings and establish a better portrait, these data suggest that direct or indirect exposure to BFRs may impair reproductive development or capacities in the individual and its descendants. Paradoxically, even though mammary gland is one of the most hormone-dependent organs both in terms of development and carcinogenesis, only a few studies have evaluated how they could be affected by BFR exposure.
OVERVIEW OF MAMMARY GLAND DEVELOPMENT AND HORMONE ACTION
The rodent mammary gland development resembles that of humans and occurs in a multistage manner (Masso-Welch et al., 2000; Richert et al., 2000; Russo and Russo, 2004). Development starts during embryonic life, continues exponentially during puberty, and reaches maturity throughout the pregnancy-lactation cycle (Figure 1; Hassiotou and Geddes, 2013; Masso-Welch et al., 2000; Russo and Russo, 2004).
Systemic Hormone-Independent Development
In utero development of the mammary glands begins between 4 and 5 weeks postconception in humans (Hassiotou and Geddes, 2013; Javed and Lteif, 2013; Russo and Russo, 2004) and around 10th to 11th day of gestation in rodents (Hens and Wysolmerski, 2005; Macias and Hinck, 2012). Development starts as epidermal cells aggregate and thicken on the ventral side of the embryo along the encephalo-caudal axis to form symmetrical ridges or milk lines (Cowie, 1974). The mammary lines will resolve into pairs of placodes at the cervical, thoracic, abdominal, and inguinal regions in the rodents, and in 1 pair in the thoracic region in humans, where the future mammary glands will form (Hassiotou and Geddes, 2013; Hens and Wysolmerski, 2005; Macias and Hinck, 2012). Development progresses as the placodes expand to form mammary buds that invaginate in the dermis. The surrounding mesenchyme differentiates into the fat pad, fills with fibroblasts, and supports epithelial growth and ductal branching (Cowin and Wysolmerski, 2010; Macias and Hinck, 2012; Richert et al., 2000; Robinson et al., 1999; Sternlicht, 2006). At birth, the mammary gland is rudimentary and only consists of small ducts surrounded by the fat pad (Figure 1; Cowie, 1974; Cowin and Wysolmerski, 2010; Macias and Hinck, 2012; Russo and Russo, 2004). From birth throughout the prepubertal period, both human and rodent mammary glands grow isometrically with the overall body (Masso-Welch et al., 2000; Russo and Russo, 2004) while circulating gonadal hormones progressively increase (Bell, 2018).
It has been demonstrated that hormone receptors, such as ER and prolactin, are expressed in the developing fetus and in neonatal humans (Keeling et al., 2000; Naccarato et al., 2000) and rodents (Heuberger et al., 1982; Hovey et al., 2002). However, even though the fetuses are exposed to high levels of maternal hormones, it is generally admitted that prenatal and prepubertal development of the mammary glands occurs independently of systemic hormones action (ie, estrogens, progesterone, and prolactin; Brisken and O’Malley, 2010; Couse and Korach, 1999). Maternal hormones are said to have organizational effects as they can induce permanent changes in the tissue during early development, which will enable further action of activational hormones later in life (Bell, 2018; Berenbaum and Beltz, 2011; Schulz et al., 2009; Wallen, 2009).
Systemic Hormone-Dependent Development
Puberty defines the period of maturation of the hypothalamic-pituitary-gonadal axis and of the reproductive systems (Bell, 2018). It is characterized by the onset of menstruation in female humans, and vaginal opening as well as regular estrous cycles in rodents (Bell, 2018). It generally begins around 9–12 years of age in humans, between postnatal day (PND) 35 and 42 in rats (Masso-Welch et al., 2000), and as early as PND 26 in mice (Brust et al., 2015). However, it has been demonstrated that the menarche is a late event; the mammary gland development is normally well-advanced when menstruation begins (Drife, 1986).
After birth, the ducts that composed the mammary gland are relatively quiescent until the rise of steroid hormones that trigger the onset of puberty. The ducts will gradually stratify to form multilayered club-like structures called terminal end buds (TEBs) at the end of the primary ducts (around week 3 in mice; Figure 1; Daniel et al., 1987; Sternlicht, 2006). TEBs are composed of an outer single layer of caps cells that are precursors of the myoepithelial lineage and express basal markers (Smooth Muscle Actin [SMA], P-cadherin, protein 63 [p63], and cytokeratin 14 [K14]; Deugnier et al., 2006). These cells are surrounding an inner multilayer of body cells expressing luminal markers (cytokeratin 18/8 [CK18/8] and E-cadherin; Daniel et al., 1987, 1995; Paine and Lewis, 2017; Sternlicht, 2006), as well as the ER and PR, that will give rise to the luminal layer of the developing ducts (Daniel et al., 1987, 1995; Paine and Lewis, 2017; Sternlicht, 2006). At the onset of puberty, the TEBs will start elongating to form the branching network. Along with proliferation and differentiation of TEBs into new ducts, major apoptosis occurs in the TEB body layer to contribute to lumen formation (Humphreys et al., 1996; Sreekumar et al., 2017). In addition to increases in systemic estrogens concentrations (Bocchinfuso and Korach, 1997; Daniel et al., 1987; Sternlicht et al., 2006), ductal elongation is regulated by complex endocrine and paracrine signals such as growth hormone, Insulin-like growth hormones, and epithelial growth factor (EGF), coming from both the epithelial and stromal compartments (Brisken and Ataca, 2015; Hovey and Aimo, 2010; Hovey et al., 1998, 1999; Sakakura et al., 1976). As ducts elongate, they bifurcate and undergo side branching, mainly under progesterone action (Haslam, 1988; Humphreys et al., 1996, 1997a,b; Lydon et al., 1995; Paine and Lewis, 2017).
At adulthood, the ductal tree has reached the edges of the fat pad and TEBs are no longer visible (Masso-Welch et al., 2000; Medina, 1996; Richert et al., 2000). Rhythmic ovarian cycles will sustain mammary development by inducing cycles of proliferation and regression throughout reproductive life (Hovey et al., 2002). Progesterone and prolactin trigger additional development that leads to the formation of tertiary branches and alveolar buds during each ovarian cycle to prepare for a potential pregnancy (Brisken, 2002; Fata et al., 2001).
During pregnancy, the mammary glands undergo the final stages of development in preparation for lactation (Figure 1). Combined action of progesterone, prolactin, thyroid hormones as well as local growth factors such as WNT, RANKL (receptor activator of nuclear factor kappa-B ligand) and EGF stimulates cell proliferation and leads to the differentiation of bilayered milk-secreting structures called alveoli (Gallego et al., 2001; Geddes, 2007; Joshi et al., 1986; Macias and Hinck, 2012; Munford, 1963a,b; Neville et al., 2002; Traurig, 1967). Throughout lactation, suction from the newborns triggers prolactin and oxytocin release, which stimulates contraction of the myoepithelial cells surrounding the alveoli and leads to milk ejection towards the lactiferous ducts to feed the newborn (Hassiotou and Geddes, 2013; Lollivier et al., 2006). The hormonal stimulation also contributes to the maintenance of milk production (Geddes, 2007; Pang and Hartmann, 2007). Lactation lasts about 3 weeks in rodents and varies between 3 and 24 months in women.
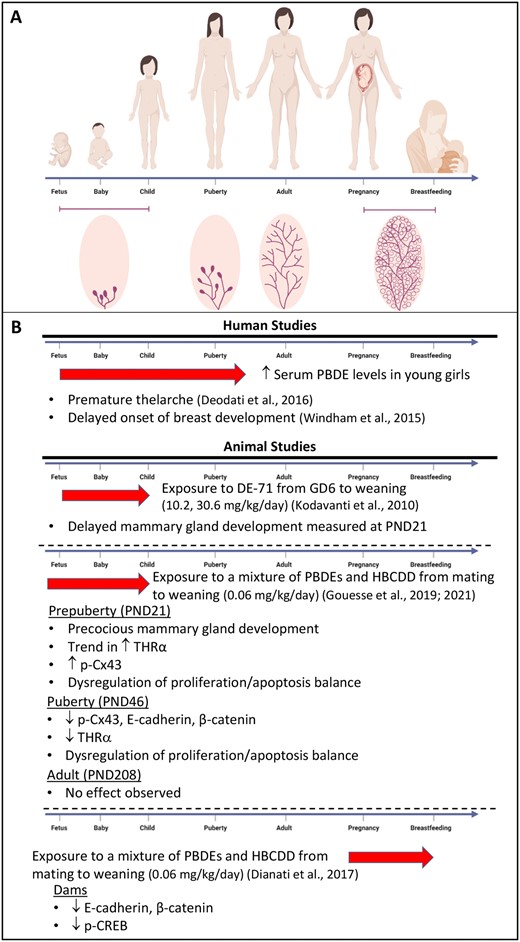
Effects of brominated flame retardants on mammary gland. A, Schematic representation of the mammary gland development during early life (fetus, baby, and child), puberty, adult life, pregnancy, and breastfeeding. B, Highlights of the effects of brominated flame retardants in human and animal mammary gland. The red arrows represent the window of exposure. For humans, although polybrominated diphenyl ether (PBDE) levels were measured in young girls, exposure to PBDEs likely began in prenatal life.
At weaning, major apoptosis of the alveoli results in regression of the glands to the pregestational stage (Holst et al., 1987; Hurley, 1989; Li et al., 1997; Lund et al., 1996; Marti et al., 1997). All these morphological and structural changes will be repeated during each pregnancy until the onset of menopause where decreases in circulating levels of estrogen and progesterone will cause an irreversible involution (Hassiotou and Geddes, 2013; Macias and Hinck, 2012; Russo and Russo, 2004).
Thyroid Hormones in Mammary Gland
Only a few studies have investigated the role of thyroid hormones on mammary gland development. It has been demonstrated that the thyroid receptors α and β (THRα and THRβ) are expressed in both the epithelium and the stroma in cows during lactation (Capuco et al., 2008). In rats, THRα1 mRNA was detected at all stages of mammary gland development, peaking at day 18 of pregnancy, whereas THRβ1 was mainly expressed during lactation (Anguiano et al., 2004). THRα1 has also been detected in epithelial cells in human breast (Alyusuf et al., 2014). Accordingly, thyroid hormones are known to play an important role during lactation, by controlling the level of prolactin binding and potentiating the effects of lactogenic and galactopoietic hormones (Bhattacharjee and Vonderhaar, 1984; Bhattacharya and Vonderhaar, 1979; Brisken and Ataca, 2015; Capuco et al., 1999, 2008; Vonderhaar and Greco, 1979, 1982; Vonderhaar et al., 1986). Interestingly, thyroid hormones are also important for the proper development of the mammary gland, as it was significantly reduced in mice treated with thiouracil to induce hypothyroidism (Vonderhaar and Greco, 1979). In opposite, mice treated with T4 harbored increased mammary gland development, showing enhanced lobuloalveolar development (Vonderhaar and Greco, 1979). Thus, without being indispensable, thyroid hormones play an important role in regulating mammary postnatal development, specifically in tertiary branching and alveolar budding processes, as well as during lactation.
EFFECTS OF PBDES AND HBCDD ON THE MAMMARY GLANDS
The above-mentioned studies illustrated that BFR can have endocrine disruptive effects on the female reproductive system, acting on various hormonal pathways. Given that development of the mammary gland and progression of breast cancer are tightly related to the hormonal balance, one can assume that exposure to BFR may influence these 2 processes.
Effects of PBDEs on the Human Mammary Gland
The limited number of studies that evaluated the effects of PBDEs exposure on mammary gland development in human reported contradictory findings. On one hand, higher serum PBDEs levels (median 44.66 ng/g) were associated with premature thelarche in a population of 124 girls in Rome (Italy; Deodati et al., 2016). On the other hand, a delayed onset of Tanner stage 2 breast development was reported when comparing the highest and lowest exposed girls in United States (Windham et al., 2015). Of note, mean serum levels of PBDEs were highly variable in this study, ranging from 31.4 to 1398.6 ng/g, likely correlated with geographic location (higher in California compared with Ohio; Windham et al., 2010; Figure 1). A third study did not find any association between current PBDEs serum levels (8.2 ng/g) and thelarche. However, this lack of effects may likely result from the low levels of exposure compared with the 2 other studies, or the low number of girls in the cohort (n = 9; Leijs et al., 2008). To the best of our knowledge, no study has analyzed the effects of exposure to HBCDD on mammary gland development or pathogenesis in humans. More studies are thus required to have a better portrait of the effects of BFRs in human breast. Similarly, experimental studies on the effects of BFR on the mammary gland remain extremely limited, and somewhat contradictory.
Effects of PBDEs and HBCDD on Mammary Gland During Pregnancy in Dams
To our knowledge, our group was the only one who has examined the effects of BFR on the mammary gland development and function during pregnancy (Figure 1). Female Sprague Dawley rats were exposed to a BFR mixture composed of 3 commercial mixtures of PBDEs (DE-71, -79, and BDE 209) and 1 HBCDD mixture prior to mating and during pregnancy and lactation. These BFR were combined to yield a ratio of PBDEs congeners and HBCDD comparable to their median levels in Boston house dust (Allen et al., 2008; Stapleton et al., 2008). The BFR mixture had no effects on lactation, as measured by growth of the pups from birth to weaning and by markers of milk synthesis (Dianati et al., 2017; Tung et al., 2016). However, exposure to the lower dose of the mixture, which was estimated to be a close approximation of maximum human exposure, led to down-regulation of junctional proteins likely through dysregulation of PKA and/or β-catenin signaling pathways in the dams’ mammary gland (Dianati et al., 2017). Interestingly, T4 serum levels were also reduced in dams exposed to the higher dose of the BFR mixture (Tung et al., 2016), suggesting that thyroid homeostasis could also be dysregulated in pups exposed in utero and during lactation from these dams, and impact mammary gland development in pups. Indeed, induction of hypothyroidism by thiouracil in mice, from midpregnancy through weaning and adulthood, resulted in delayed development of the mammary gland in pups as early as 3 weeks old up to adulthood (Vonderhaar and Greco, 1979).
Effects of In Utero and Lactational Exposure to PBDEs and HBCDD
Kodavanti et al. (2010) were the first to report adverse effects of a perinatal BFR exposure on mammary gland development in females. They used Long Evans rat dams exposed from gestational day 6 until pups’ weaning (PND 21), to 3 doses of DE-71. DE-71 is a widely used pentabromined commercial mixture known to have antiandrogenic activity (Stoker et al., 2004, 2005), thyroid disruptive activities (Ellis-Hutchings et al., 2006; Szabo et al., 2009; Zhou et al., 2001, 2002) and that induces delay in vaginal opening upon peripubertal exposure, suggesting antiestrogenic properties. Consistently, the mammary glands of PND 21 pups showed delayed ductal outgrowth, fewer lateral branches, and reduced TEB development, with these effects being more pronounced in the 10.2 mg/kg group (Figure 1; Kodavanti et al., 2010). At the same dose, a decreased level of T4 was measured in pups’ serum.
Contrary to the results reported by Kodavanti et al., in our hands in utero and lactational exposure to 0.06 mg/kg/day dose of the BFR mixture described above resulted in accelerated mammary gland development and ductal maturation at PND 21 pups (Figure 1; Gouesse et al., 2021). Although exposure to the 0.06 mg/kg/day affected gene expression in the ovary, the higher doses of the mixture also induced premature onset of vaginal opening, estrus cyclicity, and ovarian maturation (Allais et al., 2020). Serum T4 levels were also decreased, but only at the 2 higher doses (Tung et al., 2016). Thus, these data from this study suggested that exposure to low dose of an environmentally relevant mixture of BFR induces precocious mammary gland development, but also affect the overall maturation of the reproductive system, especially at higher doses (Gouesse et al., 2021).
The discrepancies between findings from both studies could be due to the strains of the animals used and the time of exposure, but more likely to the differences in the BFR mixture and their endocrine disruptive potency. DE-71 can exert potential antiestrogenic, thyroid disruptive, and antiandrogenic effects in vivo and in vitro (Ellis-Hutchings et al., 2006; Mercado-Feliciano and Bigsby, 2008a,b; Stoker et al., 2004; Szabo et al., 2009; Talsness et al., 2008; Zhou et al., 2001, 2002). In comparison, our BFR mixture—a blend of commercial mixtures of PBDEs and HBCDD—could elicit multiple endocrine disruptive activities, such as THR-, ER-, PR-, and AR-, agonistic, antagonistic, and potentiating activities or signaling disruption (Dang et al., 2007; Hamers et al., 2006, 2008; Kojima et al., 2009; Li et al., 2010; Meerts et al., 2000, 2001; Mercado-Feliciano and Bigsby, 2008a,b; Schriks et al., 2006, 2007; Yamada-Okabe et al., 2005). Interestingly, in both studies, a decreased in T4 serum levels is observed at some doses in both the dams and the pups (Kodavanti et al., 2010), although opposite effects are observed in mammary gland of the pups. Thyroid hormones seem not to be required for development of the mammary glands, but rather play a permissive and complex role (Brisken and Ataca, 2015; Vonderhaar and Greco, 1979). Thus, it is possible that in our experiment, the different mixtures act additively or even synergistically, resulting in a stimulating effect on mammary gland ductal elongation and maturation, compare to the effects of an exposure to DE-71 only (Diamanti-Kandarakis et al., 2009). Differences between the effects of exposure to single ED versus a mixture of EDs have also been reported in mice testes (Bunay et al., 2018).
In the study of Kodavanti et al., mammary gland development was not studied beyond PND 21; whether other stages of mammary gland development can be impacted by DE-71 remains unknown. To the best of our knowledge, our studies were the only ones that have analyzed the effects of in utero and lactational exposure to BFR on mammary gland development in pups around puberty (PND 46; Gouesse et al., 2019) and in adulthood (PND 208; Figure 1). We reported that, similar to the dams, exposure to 0.06 mg/kg/day of a mixture of BFR induced a dysregulation of junctional proteins at PND46. Although the apoptosis-proliferation balance was also dysregulated at PND46, no effects of the BFRs were observed on epithelial elongation, epithelial surface area, or the number of TEBs in treated animals. In adult animals, the treatments had no effects on parameters studied. Although we cannot exclude that BFR-induced changes that we did not analyze, the results suggest that the premature mammary gland development observed at PND21, and the molecular changes observed at PND46 do not impact the development of the mammary gland in adulthood. Nevertheless, we cannot rule out the hypothesis that the exposure could induce epigenetic changes (Dao et al., 2015; Du et al., 2018; Kamstra et al., 2014; Poston and Saha, 2019; Robinson et al., 2019; Suvorov et al., 2018; Zhang et al., 2013; Zhao et al., 2016) or other modifications that may result in observable effects during periods of intense remodeling of the glands such as pregnancy or involution. In addition, whether changes observed during early life render these animals more susceptible to breast cancer remained to be determined.
BFR-INDUCED DISRUPTION OF MAMMARY GLAND DEVELOPMENT: CAUSE FOR CONCERN?
In an effort to summarize the current literature reporting the effects of BFR on endocrine, reproductive systems, and on mammary gland development, this review highlighted major points that can be summarized below:
BFR, especially PBDEs and HBCDD are endocrine disruptor that mainly target thyroid hormone homeostasis, but also reproductive endpoints both in humans and experimental models.
The effects of BFR on the mammary gland differ based upon the nature of the exposure. Exposure to single commercial mixture or environmentally relevant mixtures of BFR target the mammary gland and reproductive endpoints but appear to elicit different effects.
The mammary gland is a highly dynamic organ that undergoes substantial changes at multiple stages of life. Thus, changes induced by endocrine-disrupting chemicals (EDC), such as BFR, vary upon developmental stages probably according to hormonal status and hormone responsiveness of the individual.
Cell-cell interaction, proliferation, and apoptosis, as well as thyroid signaling appear to be prime targets of BFR in the mammary gland.
Most of the major changes triggered by BFR exposure were at the low, environmentally relevant dose of exposure both in dams and pups. Thus, this highlights the importance to take into consideration environmentally relevant doses when analyzing the effects of EDCs such as BFR on animal models.
Many changes induced by BFR have been associated with breast cancer. Whether BFR increase breast cancer risk remained to be determined.
There is increased evidence supporting that exposure to endocrine disruptors is associated with higher risk of breast cancer in both human and animals, especially when exposure happen during sensitive windows of exposure. Our review highlights that both a single mixture and a blend of mixtures of BFR can alter hormonal balance, reproductive organs, and mammary gland development following direct exposure of the mother, but also their offspring, indirectly exposed during perinatal life. The greatest human exposure to BFR occurred in 1990–2000 (Eljarrat and Barceló, 2011). Thus, these data raise concerns on how BFR exposure could affect mammary glands of the women directly exposed, or their infants that were indirectly exposed, during the last 20–30 years. At the present time, these women are nearing menopause while their daughters are sexually mature and have already gone through, and/or may undergo pregnancy. It is thus important to understand whether those women are most at risk for breast cancer.
DECLARATION OF CONFLICTING INTERESTS
The authors declared no potential conflicts of interest with respect to the research, authorship, and/or publication of this article.
ACKNOWLEDGMENTS
Mike Wade is thanked for his kind review of the article before submission. Myriam Castonguay from the Intersectoral Centre for Endocrine Disruptor Analysis (CIAPE-ICEDA) is thanked for her contribution to the design of the figure.
REFERENCES
Environment and Climate Change Canada. (
Environment Canada. (
Health Canada. (
U.S. EPA. (

Comments