


Abstract
Triclosan is an antimicrobial chemical used in healthcare settings that can be absorbed through the skin. Exposure to triclosan has been positively associated with food and aeroallergy and asthma exacerbation in humans and, although not directly sensitizing, has been demonstrated to augment the allergic response in a mouse model of asthma. The skin barrier and microbiome are thought to play important roles in regulating inflammation and allergy and disruptions may contribute to development of allergic disease. To investigate potential connections of the skin barrier and microbiome with immune responses to triclosan, SKH1 mice were exposed dermally to triclosan (0.5–2%) or vehicle for up to 7 consecutive days. Exposure to 2% triclosan for 5–7 days on the skin was shown to increase transepidermal water loss levels. Seven days of dermal exposure to triclosan decreased filaggrin 2 and keratin 10 expression, but increased filaggrin and keratin 14 protein along with the danger signal S100a8 and interleukin-4. Dermal exposure to triclosan for 7 days also altered the alpha and beta diversity of the skin and gut microbiome. Specifically, dermal triclosan exposure increased the relative abundance of the Firmicutes family, Lachnospiraceae on the skin but decreased the abundance of Firmicutes family, Ruminococcaceae in the gut. Collectively, these results demonstrate that repeated dermal exposure to the antimicrobial chemical triclosan alters the skin barrier integrity and microbiome in mice, suggesting that these changes may contribute to the increase in allergic immune responses following dermal exposure to triclosan.
Triclosan is an antimicrobial chemical that was first used in surgical scrubs in healthcare settings in 1972, followed by incorporation into consumer products, including soaps, deodorants, toothpastes, and mouthwashes (Fang et al., 2010; Jones et al., 2000). Although the FDA banned the use of triclosan in consumer soaps in 2016 (FDA, 2016), triclosan is still used in some formulations of products used in healthcare settings. Triclosan exposure has been associated with negative health effects, including effects on the immune system (Anderson et al., 2019; Weatherly and Gosse, 2017). Positive associations have been documented between triclosan exposure and food allergy, aeroallergy, and asthma exacerbation in humans (Savage et al., 2012, 2014). Although triclosan itself was not identified as a sensitizer in mice (Anderson et al., 2016), dermal exposure to triclosan was demonstrated to augment the allergic response in a mouse model of asthma (Anderson et al., 2013) through a thymic stromal lymphopoietin (TSLP)-mediated pathway (Marshall et al., 2015). Additionally, exposure to triclosan was reported to enhance allergic responses in mouse models of peanut allergy (Tobar et al., 2016) and house dust mites (Hirota et al., 2019). Together these results demonstrate that exposure to triclosan is immunomodulatory and suggest that triclosan contributes to the development of allergic disease.
Exposure to triclosan primarily occurs through the skin or by ingestion, because triclosan is used in skin and mouthcare products. Healthcare workers using triclosan-containing soap were shown to have higher levels of urinary triclosan, showing that triclosan is absorbed through the skin (MacIsaac et al., 2014). In addition to being the largest organ in the body, the skin plays an essential role as a physical barrier and is very immunologically active. Disruptions in the integrity of the skin barrier or mutations in related genes have been associated with inflammatory and allergic diseases, including atopic dermatitis (AD; Kelleher et al., 2015), food allergy (Kelleher et al., 2016), and aeroallergen sensitization (Boralevi et al., 2008). Additionally, alterations in the skin barrier may increase the permeability of the skin (Rietz Liljedahl et al., 2021), increasing the sensitization potential of chemicals or allergens. There are many mediators in the skin that could influence immune function. Keratinocytes, the most abundant cell type of the epidermis, undergo a dynamic process of proliferation and terminal differentiation, ending in production of cornified envelope proteins and lipids, which are key components of the skin barrier (Goleva et al., 2019). Tight junctions between keratinocytes also contribute to the skin barrier and function (Goleva et al., 2019). The epidermal differentiation complex is a region of the genome that encodes cornified envelope proteins, including filaggrin (Flg), filaggrin 2 (Flg2), involucrin (Ivl), and loricrin (Lor) (Toulza et al., 2007; Wu et al., 2009). FLG loss-of-function mutations are associated with increased rates of AD and allergic disease (Drislane and Irvine, 2020). However, additional investigations into the mechanisms between skin barrier integrity and subsequent immune response are needed.
Although associations between skin integrity and allergic disease have been established, the contribution of the skin microbiome is just beginning to emerge. The microbiome has recently been identified as an important component of human health and is involved in the development and regulation of the immune system (Belkaid and Harrison, 2017). Disruption of the healthy microbiome, called dysbiosis, is associated with inflammatory and allergic diseases. The microbiome has been suggested to regulate T helper cell type 2 (Th2) immune responses, therefore dysbiosis may diminish the regulatory mechanisms and promote allergic disease development (McCoy et al., 2018). Many factors, including chemical exposure, have been shown to cause microbiome dysbiosis (Chiu et al., 2020; Gilbert et al., 2018; Jackson-Browne et al., 2019; Yee and Gilbert, 2016). Although a large amount of research has made associations between the gut microbiome and human health, relatively few studies have focused on the contribution of the skin microbiome. Of those limited studies, application of topical antibiotics has been shown to disrupt the skin microbiota in mice (SanMiguel et al., 2017) and topical application of antiseptics disrupted the skin microbiota in humans (SanMiguel et al., 2018). However, the impact of dermal exposure to the antimicrobial chemical triclosan on the skin microbiota of mice has not been investigated. In an effort to better understand the role of skin integrity and microbiome on the immune system, this study investigated the impact of repeated dermal exposure to triclosan on various factors related to barrier function and the contribution of commensal bacteria in mice.
MATERIALS AND METHODS
Animals
Female SKH1 mice (6–7 weeks old, Charles River) were purchased and allowed to acclimate for at least 1 week. SKH1 mice are the most commonly used hairless mouse strain and have previously been used to assess the skin microbiome (SanMiguel et al., 2017). Mice were randomly assigned to an exposure group and identified with tail markings made with a permanent marker. Mice were housed (3–5/cage; same exposure group) in ventilated plastic shoebox cages with autoclaved bedding and crinkle nest material. Harlan NIH-31 modified 6% irradiated rodent diet and tap water were available ad libitum. Housing facilities were maintained with a 12-h light/dark cycle. Specific measures were taken to control microorganisms: a dedicated bioexclusion room with limited access was used for the study, all equipment was wiped down with 70% ethanol prior to use, and animal cages were changed twice per week. All procedures were conducted under a class II type B2 biological safety cabinet (Baker SterilchemGARD). All animal experiments were performed in the AAALAC International accredited National Institute for Occupational Safety and Health animal facility in accordance with an animal protocol approved by the CDC-Morgantown Institutional Animal Care and Use Committee.
Triclosan exposures
Triclosan (CAS No. 3380-34-5) was purchased from Calbiochem (EMD Millipore Corp.). Acetone (CAS No. 67-41-1) was purchased from Sigma-Aldrich. Mice (5–6/group) were exposed once per day for 7 consecutive days to acetone (vehicle control) or to triclosan (0.5% and 2%) dissolved in acetone (w/v) on the entire dorsal back skin (100 µl/mouse). An additional unexposed (naïve) control group was included for the microbiome experiments. The concentrations were selected based on previous study findings where immune changes were observed following 0.75–3% triclosan and determined to be nontoxic (Anderson et al., 2013). Due to the larger application area and potential strain sensitivity, slightly lower concentrations were used (0.5% and 2%) in the present study. Acetone was selected as the vehicle based on solubility and historical control data for triclosan studies (Anderson et al., 2013, 2016; Marshall et al., 2015). Endpoints were evaluated following exposures up to 7 days because previous kinetic studies have demonstrated that multiple immune changes occurred during this triclosan exposure duration in mice (Anderson et al., 2020).
Transepidermal water loss measurements
Transepidermal water loss (TEWL) was determined daily prior to exposure (0%, 0.5%, and 2%) using a VapoMeter (Delfin) and small adapter on mouse dorsal skin per manufacturer’s instructions.
Euthanasia and skin collection
Animals were euthanized by CO2 inhalation 24 h after the final exposure. Back skin (1 cm2) was fixed in 4% paraformaldehyde or 10% formalin for immunofluorescence or histology, respectively. Back skin (1 cm2) was collected for western blot into tubes containing a steel bead and 750 µl T-PER with Halt Protease and Phosphatase Inhibitor cocktail and 0.5 M EDTA. Samples were processed on a TissueLyser II and supernatant was collected and frozen at −80°C until analyzed. Back skin (1 cm2) was collected for gene expression into tubes containing 500 µl RNAlater (Invitrogen) and frozen at −80°C until processed.
Histology
Formalin-fixed paraffin-embedded mouse skin (5 µm) was mounted on slides and stained with hematoxylin and eosin following standard procedures (1 slide/animal). Slides were brightfield imaged on an Olympus VS120 slide scanner at 40×. Epidermal thickness was measured using ImageJ from 1 random view/slide and 3 measurements per view were taken and averaged. For histopathology, prepared slides were transferred to Vet Path Services, Inc. Provantis pathology software v10.1.0.1 was utilized for data capture. Stained histologic sections were examined by light microscopy and observations were entered into Provantis by the nonblinded Study Pathologist. Histologic sections were of adequate size and quality for detailed evaluation. Histopathology grades were assigned as grade 1 (minimal), grade 2 (mild), grade 3 (moderate), grade 4 (marked), or grade 5 (severe) based on an increasing extent of change, unless otherwise specified.
Immunofluorescence imaging
Fixed mouse skin was cryopreserved in 30% sucrose, frozen in optimal cutting temperature compound, cryosectioned (5 µm), and mounted on slides. Skin sections (1 section/animal for each protein of interest) were washed with phosphate-buffered saline (PBS), blocked with blocking buffer (3% bovine serum albumin with 0.1% Triton in PBS) at room temperature for 1 h, and stained with primary antibody diluted in blocking buffer at 4°C overnight. The following primary antibodies were used: FLG (1:200; BioLegend 905804), FLG2 (1:200; NBP1-91901), keratin 10 (KRT10) (1:400; ab76318), and keratin 14 (KRT14) (1:500; NBP2-67585). Slides were washed, stained with secondary antibody (Alexa Fluor 594, 1:300) at room temperature for 1 h, washed, and stained with DAPI Fluoromount-G. Images were acquired at 20× using an Olympus VS120 Slide Scanner. Negative controls with secondary antibody only were included for each sample and consistently showed low background fluorescence (Supplementary Figure 1). Distribution (µm) was measured using ImageJ from 1 random view/slide and 3 measurements per view were taken and averaged.
Protein analysis
Total protein was quantified using the BCA protein assay (Pierce) per manufacturer’s instructions. Select proteins of interest were quantified using a capillary immunoassay. Optimal sample and antibody concentrations were determined using a linear range finding assay. Samples were prepared in sample buffer and fluorescent master mix, then denatured at 95°C for 5 min. Samples, antibodies (FLG, 0.4 mg/ml; FLG2, 0.4 mg/ml; KRT10, 0.2 mg/ml; KRT14, 0.4 mg/ml), and reagents were loaded and run on a Wes machine (ProteinSimple) using total protein 12–230 kDa assay with 18 s stacking matrix load time and 30 min separation time. The ProteinSimple Antirabbit and Total Protein Detection Modules were used. Peaks were automatically detected and manually inspected to confirm a peak signal-to-noise (S/N) ratio above 10 and peak height/baseline ratio above 3. Area under the curve was calculated for total protein and protein of interest using Compass software (ProteinSimple). Protein of interest was normalized to total protein. Proteins evaluated include FLG (1:50; BioLegend 905804), FLG2 (1:50; Bethyl A305-861A-M), KRT10 (1:150; ab76318), and KRT14 (1:50; ab197893).
Gene expression analysis
Total RNA was isolated from skin using the RNeasy kit per manufacturer’s instructions (Qiagen). A QIAcube (Qiagen) automated RNA isolation machine was utilized in conjunction with the RNA isolation kit. The concentration and purity of the RNA were determined using a NanoDrop Spectrophotometer (Thermo Scientific). Reverse transcription was performed using a High-Capacity cDNA Reverse Transcription Kit (Applied Biosystems) per manufacturer’s instructions. TaqMan Fast Universal PCR Master Mix (Applied Biosystems), cDNA, and gene-specific primers (TaqMan Gene Expression Assays) were combined and real-time quantitative PCR (qPCR) was performed per manufacturer’s instructions. MicroAmp Fast Optical 96-Well Reaction Plates were analyzed on a 7500 Fast Real-Time PCR System (Applied Biosystems) using cycling conditions per manufacturer’s instructions. Actb (Mm01205647_g1) was used as the reference gene. Data was collected and relative fold change compared with acetone (vehicle control) was calculated using the cycle threshold (Ct) and the method. Genes evaluated include Flg (Mm01716522_m1), Flg2 (Mm02744902_g1), Ivl (Mm00515219_s1), Lor (Mm01962650_s1), Krt10 (Mm03009921_m1), Krt14 (Mm00516876_m1), tight junction protein 1 (Tjp1) (Mm00493699_m1), occludin/ELL domain containing 1 (Ocel1) (Mm01349279_m1), integrin subunit beta like 1 (Itgbl1) (Mm01200043_m1), S100a8 (Mm00496696_g1), Tslp (Mm01157588_m1), e-cadherin (Cdh1) (Mm01247357_m1), Toll-like receptor 4 (Tlr4) (Mm00445273_m1), interleukin 4 (Il4) (Mm00445259_m1), and interleukin 22 (Il22) (Mm00444241_m1). For Il4 and Il22, the Ct was undetected in some vehicle control samples, and for these undetected samples, the Ct was set at 40 to calculate fold change.
Bacterial collection and isolation
To collect commensal skin bacteria, a sterile foam tipped applicator (Puritan) was moistened with sterile 1× Dulbecco’s PBS (Mediatech, Inc.) and then used to swab the dorsal skin of the mouse. Mice were swabbed prior to exposure (day 0), throughout exposure (days 1 and 3), 1-day after the last exposure (day 7), and 1-week after the last exposure (day 13). These timepoints were selected based on previous results showing immune alterations following up to 7 days of triclosan exposure on mouse ears (Anderson et al., 2020). The swab was placed into a sterile 2.0 ml Safe-Lock Eppendorf tube and stored at −80°C until processed. Microbial DNA was isolated as previously described (Meisel et al., 2016), with several modifications. Briefly, cells were lysed by adding 300 µl Yeast Cell Lysis Solution from the MasterPure Yeast DNA Purification Kit (Epicentre) and 0.5 µl Ready-Lyse Lysozyme Solution (Epicentre) to each sample. Samples were incubated, mechanically lysed using 0.5 mm glass bead tubes (Qiagen), and then incubated a second time as previously described. Samples were placed on ice for 5 min. Protein was precipitated out of samples using 150 µl Protein Precipitation Reagent from the MasterPure Yeast DNA Purification Kit (Epicentre) and samples were vortexed for 10 s. Samples were centrifuged at maximum speed for 10 min, supernatant was transferred to a new tube, and 500 µl isopropanol (CAS No. 67-63-0) was added to supernatant. Samples were transferred to PureLink Genomic DNA columns (Invitrogen) and centrifuged. Purification steps were followed as per manufacturer’s instructions, with 50 µl elution volume. To collect gut bacteria, fecal pellets were collected into sterile 2.0 ml Safe-Lock tubes (Eppendorf) following euthanasia and stored at −80°C until processed. Fecal matter was weighed and recorded prior to isolation. Gut microbial DNA was isolated from the fecal matter using the DNeasy PowerSoil Kit (Qiagen) as per manufacturer’s instructions, with the following exception. Samples were vortexed vertically on a vortex mixer for 15 min. DNA was eluted with 100 µl of the elution buffer and frozen at −80°C until sequenced. DNA concentration was determined using a Qubit 2.0 Fluorometer (Invitrogen) and DNA quality was checked on agarose gels.
Microbiota sequencing
For the skin microbiota, the library was constructed using the 16S MetaVx Library Preparation (GENEWIZ, Inc.). Amplicons were constructed with 50 ng DNA or maximum volume for samples with low quantity. The bacterial 16S ribosomal RNA (rRNA) gene V3–V4 region was amplified using forward primers containing the sequence “CCTACGGRRBGCASCAGKVRVGAAT” and reverse primers containing the sequence “GGACTACNVGGGTWTCTAATCC”. For the gut microbiota, the V3–V4 region was amplified using forward primers containing the sequence “CCTACGGGNGGCWGCAG” and reverse primers containing the sequence “GACTACHVGGGTATCTAATCC.” Samples had unique barcodes for identification. Indexes/adaptors were added to the ends by PCR. Libraries were validated with Agilent 2100 Bioanalyzer (Agilent Technologies) and quantified using Qubit 2.0 Fluorometer or qPCR. DNA libraries were run on an Illumina MiSeq. Sequencing was performed with a 2 × 250 paired-end configuration. 16S rRNA gene sequencing reads have been deposited in the NCBI Sequence Read Archive under BioProject ID PRJNA734311.
Microbiome sequencing analysis
Paired-end sequencing reads were demultiplexed and analyzed by QIIME2 (Quantitative Insights Into Microbial Ecology; Bolyen et al., 2019). Briefly, DADA2 (Callahan et al., 2016) was used to trim, denoise, and join to generate counts on unique sequences (termed as features) in each sample. Taxonomy assignment of the features was done with a naïve Bayesian classifier against SILVA 132 database (Quast et al., 2013) at 99% similarity. For phylogenetic diversity analyses, features assigned to the kingdom Bacteria were used and singleton features were removed. Alpha (Shannon’s diversity index) and beta diversity metrics (weighted UniFrac distance) were computed and principal coordinates analysis plots using Emperor (Vázquez-Baeza et al., 2013) were generated for each of the beta diversity metrics.
Statistical analysis
One-way analysis of variance (ANOVA) was conducted for all experiments containing 3 or more groups followed by a Dunnett’s multiple comparison test. For TEWL and skin microbiome analysis, a repeated measures ANOVA was conducted followed by a Dunnett’s multiple comparison test compared with day 0. Unpaired t tests were conducted for experiments with 2 groups. Mann-Whitney test was conducted for KRT14 protein analysis due to unequal variance. Statistical analysis was conducted using GraphPad Prism (v. 5.0). All differences were considered significant at p < .05.
RESULTS
Repeated Exposure to Triclosan Disrupts the Skin Barrier Integrity
TEWL is a validated measurement for evaluating skin barrier integrity (Fluhr et al., 2006). Exposure to 2% triclosan significantly increased TEWL starting at day 5 and continued to increase through day 7 (Figure 1A). Seven days of dermal exposure to 2% triclosan also increased the epidermal thickness of mouse dorsal skin (Figs. 1B–E). Additionally, exposure to 2% triclosan resulted in dermal infiltration of neutrophils and mononuclear cells (6/6 moderate), epidermal hyperplasia (6/6 moderate), and epidermal hyperkeratosis (5/6 minimal, 1/6 mild). Vehicle-treated mice had minimal (3/3) to mild (3/3) dermal infiltration and no epidermal hyperplasia or hyperkeratosis. Minimal to mild dermal infiltration are part of the expected background findings in the skin of the SKH1 hairless mouse strain (Benavides et al., 2009). Mixed infiltrates in the dermis consisted of neutrophils and mononuclear cells, which were primarily localized to the deep dermis and dermal adipose layer in association with hair follicles and shafts. In some instances of moderate infiltration, inflammatory cells extended to involve the superficial dermis. No changes in TEWL or skin thickness were observed following exposure to 0.5% triclosan, therefore only 2% triclosan was evaluated in subsequent studies.
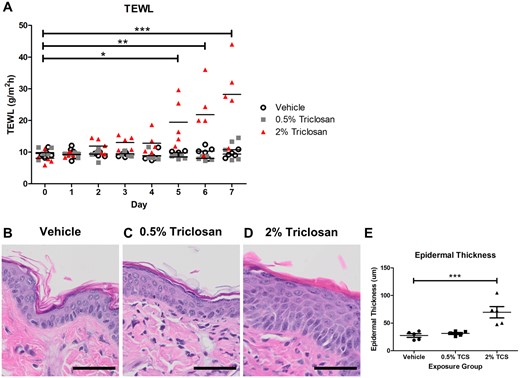
Repeated dermal exposure to triclosan disrupted the skin barrier integrity of mice. A, Transepidermal water loss (TEWL) of mouse skin throughout exposure to either vehicle or triclosan (0.5% and 2%). Points represent individual mice and bars represent mean of 5 mice/group. *p < .05, **p < .01, ***p < .001 versus day 0, by repeated measures analysis of variance (ANOVA) with Dunnett’s multiple comparison test. Representative hematoxylin and eosin images of dorsal skin following exposure to vehicle (B), 0.5% triclosan (C), or 2% triclosan (D). Scale bar = 50 µm. E, Epidermal thickness following dermal exposure to vehicle or triclosan (TCS, 0.5%, 2%). Points represent individual mice and bars represent the mean (± SEM) of 5 mice/group. ***p < .001 versus vehicle, by 1-way ANOVA with Dunnett’s multiple comparison test.
Dermal Exposure to Triclosan Results in Divergent FLG Responses
Dermal exposure to 2% triclosan for 7 days increased the distribution of the FLG layer in the epidermis in the dorsal skin of mice (Figs. 2A–C). Additionally, 7 days of exposure to 2% triclosan on mouse skin significantly increased FLG protein levels (Figs. 2D and 2E). Total protein was used as the loading control and was not changed between exposure groups (Supplementary Figure 2). The gene expression of Flg remained unchanged in the skin following 7 days of dermal 2% triclosan exposure (Figure 2F).
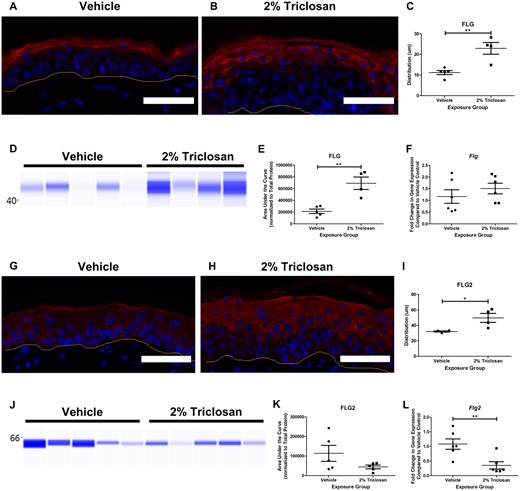
Seven days of dermal exposure to triclosan increased the filaggrin (FLG) protein and decreased the gene expression of filaggrin 2 (Flg2) in mouse skin. Representative images of FLG (red) and DAPI (blue) (A and B) and FLG2 (red) and DAPI (blue) (G-H) staining in the skin following 7 days of dermal exposure to vehicle or 2% triclosan on mice. Scale bar = 50 µm. Line indicates basement membrane. Distribution (µm) of FLG (C) and FLG2 (I) in epidermis. Points represent individual mice and bars represent the mean (± SEM) of 4–5 mice/group. *p < .05 and **p < .01, by unpaired t test. Immunoblot of FLG (D) and FLG2 (J) in skin following 7 days of dermal exposure to vehicle or 2% triclosan. Each lane represents an individual mouse. Area under the curve of FLG (E) and FLG2 (K) normalized to total protein. Points represent individual mice and bars represent the mean (± SEM) of 4–5 mice/group. **p < .01, by unpaired t test. Fold change in gene expression of Flg (F) and Flg2 (L) in skin compared with vehicle control following 7 days of dermal exposure to vehicle or 2% triclosan on mice. Points represent individual mice and bars represent the mean (± SEM) of 6 mice/group. **p < .01 versus vehicle, by unpaired t test.
Similar to FLG, FLG2 distribution was increased in the epidermal layer (Figs. 2G–I). Although 7 days of dermal exposure to 2% triclosan did not significantly change FLG2 protein levels (Figs. 2J and 2K), there was a decreasing trend in FLG2 protein in the 2% triclosan exposure group (44 286 ± 9483) compared with vehicle control (113 788 ± 41 019). Dermal exposure to 2% triclosan significantly decreased the gene expression of Flg2 in mouse skin (Figure 2L).
Dermal Triclosan Exposure Induces Differential Keratin Expression
Seven days of dermal exposure to 2% triclosan increased KRT10 distribution in the skin (Figs. 3A–C). Although triclosan exposure did not significantly impact KRT10 protein expression (Figs. 3D and 3E), the gene expression of Krt10 in mouse dorsal skin was significantly decreased (Figure 3F). Seven days of dermal exposure to 2% triclosan also increased the distribution of KRT14 in the skin (Figs. 4A–C) and the KRT14 protein level was significantly increased following 2% triclosan exposure (Figs. 4D and 4E). Additionally, dermal exposure to 2% triclosan for 7 days significantly increased the gene expression of Krt14 in mouse dorsal skin (Figure 4F). No significant changes in gene expression of Ivl, Lor, Tjp1, Ocel1, or Itgbl1 following 7 days of dermal 2% triclosan exposure were observed (Supplementary Figure 3).
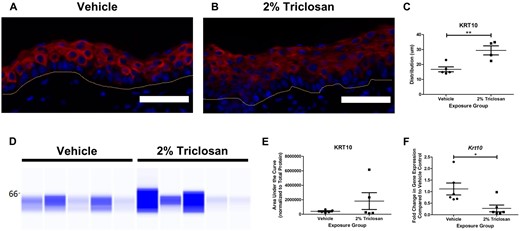
Seven days of dermal exposure to triclosan decreased the gene expression of keratin 10 (Krt10) in mouse skin. Representative images of KRT10 (red) and DAPI (blue) staining in the skin following 7 days of dermal exposure to vehicle (A) or 2% triclosan (B) on mice. Scale bar = 50 µm. Line indicates basement membrane. C, Distribution (µm) of KRT10 in epidermis. Points represent individual mice and bars represent the mean (± SEM) of 4–5 mice/group. **p < .01, by unpaired t test. D, Immunoblot of KRT10 in skin following 7 days of dermal exposure to vehicle or 2% triclosan. Each lane represents an individual mouse. E, Area under the curve of KRT10 normalized to total protein. Points represent individual mice and bars represent the mean (± SEM) of 5 mice/group. F, Fold change in gene expression of Krt10 in skin compared with vehicle control following 7 days of dermal exposure to vehicle or 2% triclosan on mice. Points represent individual mice and bars represent the mean (± SEM) of 6 mice/group. *p < .05 versus vehicle, by unpaired t test.
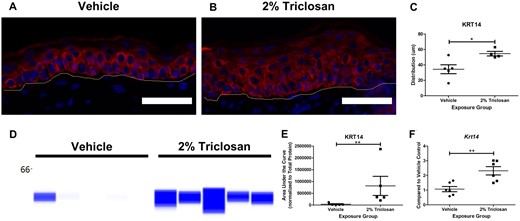
Seven days of dermal exposure to triclosan increased the expression of keratin 14 (KRT14) in mouse skin. Representative images of KRT14 (red) and DAPI (blue) staining in the skin following 7 days of dermal exposure to vehicle (A) or 2% triclosan (B) on mice. Scale bar = 50 µm. Line indicates basement membrane. C, Distribution (µm) of KRT14 in epidermis. Points represent individual mice and bars represent the mean (± SEM) of 4–5 mice/group. *p < .05, by unpaired t test. D, Immunoblot of KRT14 in skin following 7 days of dermal exposure to vehicle or 2% triclosan. Each lane represents an individual mouse. E, Area under the curve of KRT14 normalized to total protein. Points represent individual mice and bars represent the mean (± SEM) of 5 mice/group. **p < .01 versus vehicle, by Mann-Whitney test. F, Fold change in gene expression of Krt14 in skin compared with vehicle control following 7 days of dermal exposure to vehicle or 2% triclosan on mice. Points represent the individual mice and bars represent the mean (± SEM) of 6 mice/group. **p < .01 versus vehicle, by unpaired t test.
Triclosan Exposure on the Skin Increased Expression of Danger Signals and Cytokines
Previously, we have shown that 7 days of triclosan exposure on BALB/c mouse ears alters the expression of S100a8, Il4, Il22, Tslp, Cdh1, and Tlr4 (Anderson et al., 2020). Based on the kinetics from that study, the expression of these danger signals and cytokines were evaluated in SKH1 mice. Seven days of dermal exposure to 2% triclosan significantly increased the expression of the danger signal S100a8 and Th2 cytokine Il4 in hairless SKH1 mouse back skin (Figs. 5A and 5B). However, no significant changes in the expression of Il22, Tslp, Cdh1, Tlr4 in the skin were observed (Figs. 5C–F).
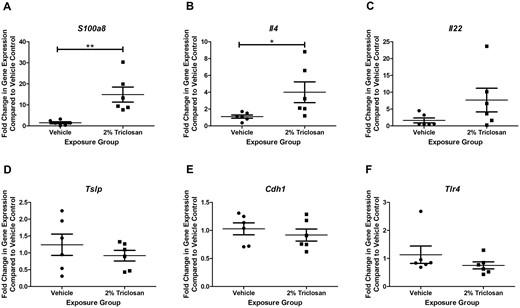
Seven days of dermal exposure to triclosan increased the expression of genes involved in the immune response. Fold change in expression compared with vehicle control of (A) S100a8, (B) Il4, (C) Il22, (D) Tslp, (E) Cdh1, and (F) Tlr4 following 7 days of dermal exposure to vehicle or 2% triclosan on mice. Points represent the individual mice and bars represent the mean (± SEM) of 6 mice/group. *p < .05, **p < .01 versus vehicle, by unpaired t test.
Dermal Triclosan Exposure Alters the Skin Microbiota
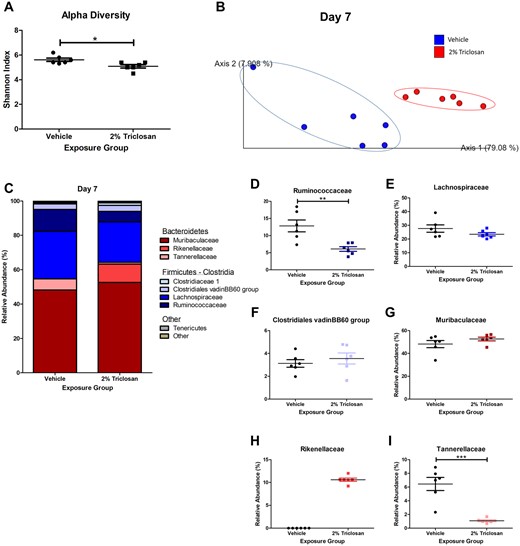
Seven days of dermal exposure to 2% triclosan significantly increased the alpha diversity, the diversity of microorganisms within each sample, at day 7 of the skin microbiota on mice (Figure 6A). This change in alpha diversity was restored similar to baseline levels 1 week after the final triclosan exposure (day 13). No significant difference between the naïve and vehicle groups was observed. Seven days of triclosan exposure also altered the beta diversity, the diversity between samples, compared with naïve and vehicle (Figure 6B). The composition of the skin microbiota was altered on day 7 following triclosan exposure with a greater abundance of Firmicutes compared with naïve and vehicle (Figure 6C). Specific changes in taxons within the Firmicutes phylum following 7 days of triclosan exposure included a significant increase in abundance of Lachnospiraceae (Figure 6D) and Clostridiales vadinBB60 group (Figure 6E). Relative abundance of Ruminococcaceae followed a similar trend but was less impressive (Figure 6F). The abundance of Enterobacteriaceae (phylum Proteobacteria) was modestly decreased following 7 days of dermal triclosan exposure (Figure 6G). The differences in relative abundance were restored similar to baseline levels by day 13. Together, these results show that 7 days of dermal exposure to 2% triclosan altered the composition of the skin microbiota on mice.

Seven days of dermal exposure to triclosan altered the composition of the skin microbiota on mice. A, Shannon index as a measure of alpha diversity of skin microbiota throughout 7 days of vehicle or 2% triclosan exposure on mouse skin or 1-week after the final triclosan exposure ended (day 13). An additional untreated (naïve) group was included. Points represent mean (± SEM) of 6 mice/group. *p < .05 versus day 0, by repeated measures ANOVA with Dunnett’s multiple comparison test. B, Weighted UniFrac as a measure of beta diversity of skin microbiota on day 7. Points represent individual mice. C, Relative abundance of taxa on day 7. Bars represent mean of 6 mice/group. Relative abundance of Lachnospiraceae (D), Clostridiales vadinBB60 group (E), Ruminococcaceae (F), and Enterobacteriaceae (G). Points represent mean (± SEM) of 6 mice/group. *p < .05, ***p < .001 versus day 0, by repeated measures ANOVA with Dunnett’s multiple comparison test.
Dermal Triclosan Exposure Alters the Gut Microbiota
Seven days of dermal exposure to 2% triclosan significantly decreased the alpha diversity of the gut microbiota in mice (Figure 7A). Beta diversity was also shifted between vehicle and 2% triclosan groups (Figure 7B). The composition of the gut microbiota was altered following 7 days of dermal exposure to triclosan with an increase in phylum Bacteroidetes and decrease in phylum Firmicutes relative abundance (Figure 7C). Specifically, 7 days of 2% triclosan exposure significantly decreased the relative abundance of Ruminococcaceae (phylum Firmicutes; Figure 7D). However, no remarkable change between Lachnospiraceae and Clostridiales vadinBB60 group were observed (Figs. 7E and 7F). Within the phylum Bacteroidetes, relative abundance of Muribaculaceae was unchanged with triclosan exposure (Figure 7G), but the abundance of Rikenellaceae was increased (Figure 7H) and abundance of Tannerellaceae was decreased (Figure 7I) following 7 days of 2% triclosan exposure on mice. Together, these results show that 7 days of dermal exposure to 2% triclosan altered the composition of the gut microbiota in mice.
Seven days of dermal exposure to triclosan altered the composition of the gut microbiota in mice. A, Shannon index as a measure of alpha diversity of gut microbiota following 7 days of dermal exposure to vehicle or 2% triclosan. Points represent individual mice and bars represent mean (± SEM) of 6 mice/group. *p < .05 versus vehicle, by unpaired t test. B, Weighted UniFrac as a measure of beta diversity of gut microbiota on day 7 following vehicle or 2% triclosan exposure. Points represent individual mice. C, Relative abundance of taxa on day 7 following vehicle or 2% triclosan exposure. Bars represent mean (± SEM) of 6 mice/group. Relative abundance of Ruminococcaceae (D), Lachnospiraceae (E), Clostridiales vadinBB60 group (F), Muribaculaceae (G), Rikenellaceae (H), and Tannerellaceae (I) following 7 days of dermal exposure to vehicle or 2% triclosan. Points represent individual mice and bars represent mean (± SEM) of 6 mice/group. **p < .01, ***p < .001 versus vehicle, by unpaired t test.
DISCUSSION
Absorption of chemicals through the skin is a major occupational concern as the CDC estimates that over 13 million workers in the United States are potentially exposed to chemicals with the capacity to be absorbed through the skin (Anderson and Meade, 2014; NORA, 2019). Many chemicals have been identified to have effects on the immune system and lead to occupational diseases (Kasemsarn et al., 2016). Investigations are needed to better understand the initiating factors and mechanism of immune dysfunction, occupational disease, and the relationship with the skin barrier integrity and skin microbiome (NORA, 2019).
The results of this study show that repeated dermal exposure to the immunomodulatory chemical triclosan alters the integrity of the skin barrier, skin microbiota, and gut microbiota in mice. Healthcare workers, who are typically exposed to high levels of antimicrobial chemicals and have higher rates of allergic disease (Kadivar and Belsito, 2015; Prodi et al., 2016), have been demonstrated to have high levels of TEWL and skin barrier disruption (Visscher et al., 2010). The findings described in this article support a link between higher rates of allergic disease and skin barrier disruption following triclosan exposure (Figure 1).
Exposure to chemicals, such as detergents, has been shown to influence epithelial barriers (Celebi Sozener et al., 2020), and damage to or alterations in the skin barrier are associated with the development of skin diseases (Kasemsarn et al., 2016). Although the relationship between AD and FLG has been well established (Cabanillas and Novak, 2016), studies investigating the influence of dermal chemical exposure on FLG are lacking. Contradictory to its role in AD, FLG expression was increased in this study following dermal triclosan exposure (Figure 2). The skin microenvironment plays an important role in regulating expression of skin barrier genes such as FLG and it is well established that certain cytokines (IL-4, IL-13, and IL-22) negatively modulate the expression of FLG (Gutowska-Owsiak et al., 2011; Howell et al., 2009). In contrast, aryl hydrocarbon receptor (AhR) signaling has been shown to promote the expression of FLG in the skin (Hidaka et al., 2017; van den Bogaard et al., 2013). Although Il4 was concurrently expressed in the skin (Figure 5) with FLG protein after triclosan exposure, it is possible that exposure to triclosan may also activate other pathways, such as AhR (Szychowski et al., 2016), resulting in competing pathways in the regulation of FLG following triclosan exposure. This is an area of research that requires additional investigation.
Although not as well documented as FLG, FLG2 mutations have also been associated with AD (Margolis et al., 2014), supporting the reduced Flg2 expression reported in this study (Figure 2). FLG2 contributes to the cornified envelope (Albérola et al., 2019) and plays a role in cell-cell adhesion (Mohamad et al., 2018), suggesting a contribution to skin integrity. Although FLG and FLG2 have been shown to have similar expression patterns in cultured human keratinocytes (Wu et al., 2009), other work highlights the differential regulation of FLG and FLG2 (Gutowska-Owsiak et al., 2011; Hansmann et al., 2012). The mechanism behind differential regulation of these genes due to chemical exposure is unclear, but it is possible that increased FLG may compensate for decreased FLG2 in an effort to restore skin barrier integrity. Additionally, timing may be an influencing factor as expression differences were only investigated at the peak of TEWL (7 days post exposure).
In addition to FLG, keratinocytes are critical in the formation of an intact skin barrier. Keratinocytes produce keratins, which are involved in cell structure and metabolism (Pan et al., 2013). Decreased levels of KRT10 in the skin have been positively associated with AD, and Th2 cytokines have been shown to negatively regulate KRT10 (Totsuka et al., 2017), suggesting that KRT10 plays a role in inflammatory and allergic diseases. Consistent with these findings, our results show decreased Krt10 gene expression along with increased Il4 expression, following triclosan exposure (Figs. 3F and 5B). Krt10 plays a critical role in the skin as homozygous Krt10 deficient mice die shortly following birth (Jensen et al., 2000; Porter et al., 1996), and is expressed by keratinocytes in the differentiation phase (Moll et al., 2008). Increased epidermal thickness (Figure 1) along with decreased Krt10 further supports impairment of keratinocyte differentiation and is consistent with other studies in the literature (Fang et al., 2015). In contrast to KRT10, a marker of keratinocyte proliferation, KRT14, was increased following triclosan exposure (Figure 4), suggesting effects on keratinocyte proliferation also consistent with the literature (Wu et al., 2015) and histopathology (Figure 1). Due to the important role that keratins play in skin structure and integrity, alterations in the normal keratin expression patterns, increased proliferation but delayed differentiation, following triclosan exposure may be a contributing factor to the disruptions observed in skin barrier integrity.
Although an intact skin barrier requires a physiological keratinization process, it also depends upon a normal skin microbiome. In these studies, 7 days of dermal exposure to triclosan increased the alpha diversity of the skin microbiota on mice, demonstrating that triclosan exposure leads to dysbiosis of the skin microbiome (Figure 6). Furthermore, the abundance of Firmicutes, specifically the families Lachnospiraceae and Clostridiales vadinBB60 group, was enriched. Although Lachnospiraceae in the gut are considered beneficial (Sorbara et al., 2020), the role for Lachnospiraceae on the skin has not been defined. However, Lachnospiraceae have previously been identified on the skin of mice (Gimblet et al., 2017) and topical exposure to antibiotics was shown to reduce the abundance of Lachnospiraceae on mouse skin (SanMiguel et al., 2017). The skin microbiome is critical for maintaining homeostasis of the skin, supporting barrier integrity, and resisting colonization of pathogens (Baldwin et al., 2017; Byrd et al., 2018). Mice lacking a microbiome have been shown to have altered expression of skin barrier genes (Meisel et al., 2018). Dysbiosis of the skin microbiota is also thought to contribute to inflammatory and allergic skin diseases (Belkaid and Tamoutounour, 2016). The skin microbiome has been demonstrated to interact with and influence the integrity of the skin barrier and subsequently the development of skin diseases (Baldwin et al., 2017). The return of the microbiota similar to the untreated mice 7 days after the last application of triclosan demonstrates that these changes in the microbiota are reversible, aligning with previous findings in fish where the gut microbiota was restored 1–2 weeks post a 7-day triclosan exposure (Narrowe et al., 2015). Our results demonstrate changes in the skin microbiota following dermal triclosan exposure and suggest that these changes may influence the skin barrier and immune responses.
Interestingly, in contrast to the skin, the alpha diversity of the gut microbiota was decreased in mice, suggesting divergent impacts on the microbiome due to triclosan exposure (Figure 7). Specifically, dermal exposure to triclosan reduced the abundance of Ruminococcaceae (phylum Firmicutes) in the gut. Decreased abundance of genera in the Lachnospiraceae and Ruminococcaceae families in the gut have been associated with increased rates of allergic disease (Simonyté Sjodin et al., 2019), suggesting that these commensal microorganisms are involved in regulating allergic immune responses. Previous studies have shown that oral or environmental exposure to triclosan alters the gut microbiota in humans (Bever et al., 2018), rats (Hu et al., 2016), mice (Gao et al., 2017; Yang et al., 2018), and fish (Gaulke et al., 2016; Narrowe et al., 2015). Specifically, exposure to triclosan either through drinking water or diet was shown to decrease the alpha diversity of the gut microbiota of mice (Gao et al., 2017; Yang et al., 2018). Triclosan has also been shown to be absorbed through mouse skin and excreted through feces (Fang et al., 2016). These results align with the result of our study and expand the findings by demonstrating that exposure to triclosan on the skin impacts the gut microbiome. In the present study, in addition to exposure through the skin, there is the potential for oral exposure due to group housing and grooming practices. The skin and gut have different microbial compositions and thus are likely to respond uniquely to antimicrobial chemical exposures and thus is an area of research that requires additional investigation. Additionally, disruption of the skin barrier may influence the absorption of triclosan, resulting in a greater impact on the skin microbiota and gut microbiota. Together, these differences in diversity and relative abundance of commensal microorganisms demonstrate a disruption in homeostasis of the microbiota due to triclosan exposure.
Although the observed changes in skin integrity and microbiome were not evident until 7 days post exposure, early immune changes have been reported in the skin following triclosan exposure. Our laboratory has previously shown that triclosan induces expression of Tslp, S100a8, Il4, Il22 and decreases expression of Cdh1, in some cases as early as 1 day post triclosan exposure in BALB/c mice (Anderson et al., 2020). Additionally, certain chemokines including Cxcl1 and Cxcl2, were upregulated in the skin as early as 1 day following dermal triclosan exposure, supporting an early and direct influence on keratinocytes (Weatherly et al., 2020). Although changes in certain Th2 cytokines including Tslp were not observed in the present study, it is important to note that BALB/c mice, which have a Th2 bias, were not used in the studies described in this article. Additionally, although SKH1 mice are immunocompetent (Benavides et al., 2009), their immune system is not as well characterized and investigations of allergic responses following triclosan exposure are lacking in this strain. However, triclosan exposure increased Il4 expression in this study and collectively these findings suggest that immunological changes may be a prerequisite for effects on skin integrity and the microbiome, but additional research is required.
In summary, these results demonstrate that repeated dermal exposure to triclosan disrupts the skin barrier integrity and microbiome of mice. Taken together, these findings suggest that an altered skin barrier and/or skin microbiome may contribute to changes in the immune system, lower the protection from exposures on the skin, and thus contribute to an increased susceptibility to occupational or allergic diseases. Early changes in the immune system due to chemical exposure may further promote disruptions in the barrier integrity and microbiome, resulting in a positive feedback loop. Investigating the impact of dermal exposure to antimicrobial chemicals, such as triclosan, is important to improve risk assessment of occupational exposures and contribute to an improved understanding of mechanisms of sensitization and allergic disease.
SUPPLEMENTARY DATA
Supplementary data are available at Toxicological Sciences online.
ACKNOWLEDGMENTS
We would like to acknowledge the WVU Microscope Imaging Core Facility, Morgantown, WV for support provided to help make this publication possible and Grant No. P20GM103434 which in turn provides financial support to the Core Facility. We would also like to acknowledge the WVU Genomics Core Facility, Morgantown, WV for support provided to help make this publication possible and CTSI Grant No. U54 GM104942 which in turn provides financial support to the Core Facility.
FUNDING
This work was supported by internal funds from the Health Effects Laboratory Division of the National Institute for Occupational Safety and Health. G.H. was supported by NIGMS grants P20 GM103434 and U54 GM-104942.
DECLARATION OF CONFLICTING INTERESTS
The authors declare no conflicts of interest. The authors alone are responsible for the content of this manuscript. The findings and conclusions in this report are those of the authors and do not necessarily represent the official position of the National Institute for Occupational Safety and Health, Centers for Disease Control and Prevention.
REFERENCES
FDA. (
NORA.

Comments