


Abstract
4-(methylnitrosamino)-1-(3-pyridyl)-1-butanone (NNK) is one of the key tobacco-specific nitrosamines that plays an important role in human lung carcinogenesis. However, repeated inhalation toxicity data on NNK, which is more directly relevant to cigarette smoking, are currently limited. In the present study, the subacute inhalation toxicity of NNK was evaluated in Sprague Dawley rats. Both sexes (9–10 weeks age; 16 rats/sex/group) were exposed by nose-only inhalation to air, vehicle control (75% propylene glycol), or 0.8, 3.2, 12.5, or 50 mg/kg body weight (BW)/day of NNK (NNK aerosol concentrations: 0, 0, 0.03, 0.11, 0.41, or 1.65 mg/L air) for 1 h/day for 14 consecutive days. Toxicity was evaluated by assessing body and organ weights; food consumption; clinical pathology; histopathology observations; blood, urine, and tissue levels of NNK, its major metabolite 4-(methylnitrosamino)-1-(3-pyridyl)-1-butanol (NNAL), and their glucuronides (reported as total NNK, tNNK, and total NNAL, tNNAL, respectively); O6-methylguanine DNA adduct formation; and blood and bone marrow micronucleus frequency. Whether the subacute inhalation toxicity of NNK followed Haber’s Rule was also determined using additional animals exposed 4 h/day. The results showed that NNK exposure caused multiple significant adverse effects, with the most sensitive endpoint being non-neoplastic histopathological lesions in the nose. The lowest-observed-adverse-effect level (LOAEL) was 0.8 mg/kg BW/day or 0.03 mg/L air for 1 h/day for both sexes. An assessment of Haber’s Rule indicated that 14-day inhalation exposure to the same dose at a lower concentration of NNK aerosol for a longer time (4 h daily) resulted in greater adverse effects than exposure to a higher concentration of NNK aerosol for a shorter time (1 h daily).
The tobacco-specific nitrosamine 4-(methylnitrosamino)-1-(3-pyridyl)-1-butanone (NNK) is a potent carcinogen. NNK occurs naturally in tobacco plants and is considered to be one of the compounds responsible for the induction of lung cancer in humans exposed to tobacco. Compared with other nitrosamines, NNK is found at relatively high levels in both mainstream and side-stream smoke, as well as in unburned tobacco (Hoffmann et al., 1979). Because of evidence of carcinogenic activity in mechanistic, animal, and human studies, NNK has been classified as a human lung carcinogen by the International Agency for Research on Cancer (IARC, 2007).
Human exposure to NNK occurs through smoking tobacco products, using oral smokeless tobacco products, or exposure to second-hand smoke. NNK is a potent systemic lung carcinogen in experimental animals, independent of the route of administration, a finding that has been often documented ( reviewed in Hecht, 1998; IARC, 2007; Zheng and Takano, 2011). After subcutaneous injection of NNK, at a total dose of 6 mg/kg body weight (BW), Fischer 344 rats developed lung tumors and pulmonary hyperplasia (Belinsky et al., 1990). NNK is particularly potent in rats (Hecht, 2006), with male rats being more susceptible than female rats (Hecht, 1998). In addition to lung tumors, NNK also has produced tumors of the liver, pancreas, nasal cavity, oral cavity, and cervix in laboratory animals (Hecht, 2003, 2008). NNK and its major metabolite, 4-(methylnitrosamino)-1-(3-pyridyl)-1-butanol (NNAL), are known pancreatic carcinogens present in tobacco products. Approximately, 25% of all pancreatic cancers have been attributed to cigarette smoking (Maisonneuve and Lowenfels, 2010; Weissman et al., 2020). The administration of NNAL in drinking water to Fischer 344 rats induced lung tumors and pancreatic tumors (Rivenson et al., 1988). NNAL also induced lung tumors in A/J mice following intraperitoneal injection (Castonguay et al., 1983). Due to its longer half-life than that of NNK, NNAL levels in urine have been used as a biomarker of smokers in clinical studies (Hecht, 2002), and a significant dose-dependent association of total urinary NNAL with lung cancer risk was found (Yuan et al., 2009).
Inhalation of tobacco smoke represents a key route of entry for NNK in humans. NNK toxicity data following inhalation exposure are important for determining the risk associated with exposure to specific levels of NNK. However, no repeated-dose rodent toxicity studies have been conducted following inhalation of NNK. Consequently, the extrapolation of rodent studies to human carcinogenesis is based on either intraperitoneal or oral administration of NNK. While oral administration does mimic the use of smokeless tobacco products, it cannot substitute for inhalation exposure when evaluating tobacco smoke toxicity. A literature search revealed only 1 limited study of NNK inhalation in experimental animals. Male Sprague-Dawley rats were exposed to NNK vapors in the air over a period of 1 h at a reported dose rate of 50 mg/kg BW NNK (Pool-Zobel et al., 1992). The amount of NNK inhaled was limited by the low volatility of the compound, and calculations of the expected concentration based on vapor pressure raises concern that a dose rate of 50 mg/kg BW was actually achieved. Hence, it is not possible to determine the actual dose achieved in the Pool-Zobel study. The authors demonstrated that DNA damage in the liver (single-strand breaks at approximately 38–42%) was similar to that observed with the ingestion of the same amount of NNK (Pool-Zobel et al., 1992); however, the study was inadequate for the quantitative analysis of the dose-response associated with exposure to NNK.
The primary objective of this study was to determine the subacute toxicity of NNK in Sprague Dawley rats following nose-only inhalation exposure for 1 h per day for 14 consecutive days. Another objective of this study was to determine whether the subacute inhalation toxicity of NNK follows Haber’s Rule: that exposure to a low concentration (c1) of a potentially toxic substance for a long time (t1) has the same adverse effects as exposure to a high concentration (c2) for a short time (t2) (ie, c1 × t1 = c2 × t2; Haber, 1924). Besides the main study animals, 3 additional groups of animals were exposed to NNK test aerosols by nose-only inhalation for 4 h per day for 14 consecutive days. The toxicity responses in these animals were compared to the 1-h exposure groups of the main study that had the same total exposure doses, calculated as the product of NNK concentration and exposure time. Overall, based on our recent toxicokinetic and genotoxicity study of NNK in rats (Hu et al., 2021), the present study expands our regulatory science knowledge for the evaluation of health risks associated with exposure to NNK, and ultimately, to tobacco products.
MATERIALS AND METHODS
Reagents
NNK (CAS # 64091-91-4) was purchased from Toronto Research Chemical Inc. (Ontario, Canada). The stated purity of the compound by the manufacturer was 98%. The identity and purity of the NNK were confirmed by spectroscopic and chromatographic analyses at FDA/NCTR. The vehicle for administering the test substance, propylene glycol (1, 2-propanediol; CAS # 57-55-6, USP/FCC grade), was purchased from Sigma-Aldrich (St. Louis, MO).
Animals
Sprague-Dawley rats [Crl: CD®(SD)IGS BR] were purchased from Charles River Laboratories (Wilmington MA), at approximately 7–8 weeks old and weighing approximately 200–250 g for males and 140–200 g for females. Rats were randomly allocated to each group with dosing at 9–10 weeks old. The study design (Table 1) and animal housing and procedures were approved by the NCTR Institutional Animal Care and Use Committee (IACUC). The animals were acclimatized to exposure unit animal holders (TSE Systems, Inc., St. Louis, MO) during a period of 5 days prior to the inhalation exposure.
Experimental Design for NNK 14-Day Nose-Only Inhalation Toxicity Study in Rats
| Exposure Group | NNK | Exposure | NNK | Number of Animals | Number of Animals in Subgroups | ||||
|---|---|---|---|---|---|---|---|---|---|
| Target Dosea, mg/kg BW | Duration, h/day | Aerosol Conc., mg/L air | Total | Toxicology | Exposure Assessment | ||||
| Male | Female | Male | Female | Male | Female | ||||
| I (Sham) | 0 | 1 | 0 | 16 | 16 | 10 | 10 | 6 | 6 |
| II (Vehicle) | 0 | 1 | 0 | 16 | 16 | 10 | 10 | 6 | 6 |
| III (Low) | 0.8 | 1 | 0.03 | 16 | 16 | 10 | 10 | 6 | 6 |
| IV (Mid) | 3.2 | 1 | 0.11 | 16 | 16 | 10 | 10 | 6 | 6 |
| V (Mid High) | 12.5 | 1 | 0.41 | 16 | 16 | 10 | 10 | 6 | 6 |
| VI (High) | 50 | 1 | 1.65 | 16 | 16 | 10 | 10 | 6 | 6 |
| VII (Haber Mid) | 3.2 | 4 | 0.03 | 7 | 7 | 7 | 7 | — | — |
| VIII (Haber Mid High) | 12.5 | 4 | 0.11 | 7 | 7 | 7 | 7 | — | — |
| IX (Haber High) | 50 | 4 | 0.41 | 7 | 7 | 7 | 7 | — | — |
| Totals: | — | — | — | 117 | 117 | 81 | 81 | 36 | 36 |
Target dose was estimated as: Inhaled NNK Dose (mg/kg) = C × MV × T/BW; where C = NNK aerosol concentration (mg/L air), MV = minute volume (mL/minute) based on equation MV = 2. 1(BW)0.75, T = exposure duration (minute) [60 min], and BW = body weight (g) [300 g].
Experimental Design
Six groups (16 rats/sex/group) were exposed by nose-only inhalation exposure to Low, Mid, Mid High, and High dose levels (0.8, 3.2, 12.5, and 50 mg/kg BW/day, respectively) of NNK (which corresponded to NNK aerosol concentrations of 0.03, 0.11, 0.41, and 1.65 mg/L air), 75% propylene glycol (Vehicle Control) aerosol, and air (Sham; Air Control) for 1 hour per day for 14 consecutive days. The main Toxicology groups contained 10 rats/sex/group and Exposure Assessments groups contained 6 rats/sex/group (Table 1). To test Haber’s Rule for NNK, 3 additional groups (Haber’s Rule exposure groups) were exposed by nose-only inhalation to Haber Mid, Haber Mid High, and Haber High dose levels (3.2, 12.5, and 50 mg/kg BW/day) of NNK (which corresponded to NNK aerosol concentrations of 0.03, 0.11, and 0.41 mg/L air) for 4 h per day for 14 consecutive days. Each Haber’s Rule exposure group contained 7 rats of each sex, and their toxic responses were compared to the 1-h exposure groups of the main study that had the same exposure doses (Table 1). The NNK aerosol concentration in the Haber’s Rule exposure group was 25% of the NNK concentration in the main Toxicology group, with 4-times the exposure duration to the main Toxicology group, in order to determine per Haber’s Rule if this exposure would result in the same biological response as the main Toxicology group.
Nose-Only Inhalation Exposure
Inhalation exposure laboratory
The inhalation exposure was conducted in the CTP/NCTR Inhalation Toxicology Core Facility. The core facility is equipped with six 50-port nose-only inhalation exposure systems (TSE Systems, Inc.). Each inhalation exposure system consists of a nose-only inhalation exposure chamber, an aerosol generation system, and a test atmosphere monitor and control system.
Test atmosphere generation
The test atmosphere was generated by aerosolizing the test formulation, a mixture of NNK, propylene glycol, and water (ie, mixture contained 75% propylene glycol), with a 6-Jet Collison nebulizer (CH Technologies, Inc., Westwood, NJ). Prior to entering the exposure chamber, the aerosol was delivered to a glass mixing/separation device that was connected to the inlet of the inhalation exposure chamber. The aerosol and dilution air were combined in the mixing/separation device. Particles with larger diameters were removed by the separation device, and particles with the desired diameters entered the inhalation exposure chamber. The aerosol was drawn, by a vacuum source connected to the chamber outlet, through each exposure port where the test atmosphere was generated. The total airflow was set to produce an airflow of approximately 0.5 L/min/exposure port. The aerosol concentrations were controlled by adjusting NNK concentration in the formulations. The inlet and exhaust air flows to and from the chamber were continuously controlled and monitored by mass flow controllers and a Daco Monitoring and Control system (TSE Systems, Inc.). The test atmosphere temperature, relative humidity, and oxygen concentration were monitored continuously throughout the exposure period. The chamber test atmosphere was maintained at stable conditions with a temperature between 20 and 24°C, the relative humidity between 30% and 70%, and an oxygen concentration of at least 19%. The nebulizer of the high-dose test formulation was placed in a sonicator to prevent deposition during aerosolizing. Chemical analysis indicated that sonication caused no negative effects to NNK structure, nature, or formulation concentration.
Qualification of the exposure system
Prior to the in vivo inhalation exposure study, the performance of the nose-only inhalation exposure systems was validated. The parameters of test atmosphere in rat breathing zones were measured for at least 1 h/day for the High concentration chamber, and 4 h/day for the Low, Mid, and Mid High concentration chambers for at least 3 days to ensure that the NNK concentrations in the aerosols achieved ± 10% of the target concentrations and that aerosol particle size, test atmosphere temperature, relative humidity, and oxygen levels were within designated target ranges. The NNK concentration and particle size distribution in the aerosols were determined via the methods described below in the Test Atmosphere Monitoring section. To evaluate the stability of particle concentration, the particle concentration profiles in the rats’ breathing zone of the exposure port were monitored continuously by a real-time aerosol monitor described below in the Test Atmosphere Monitoring section. To evaluate the spatial distribution of aerosols in the nose-only inhalation exposure chamber, the aerosol concentrations were measured at various ports that were located at different tiers and orientations of the inhalation exposure chamber. Upon confirmation that aerosol concentrations were within ± 10% of the target concentration, a port located at the center of the chamber was used as a reference port. Aerosols from a reference port were measured by a real-time aerosol monitor (indication of within-port variation), while samples from at least 6 other sampling ports were taken sequentially following a measurement from the reference port (indication of between-port variation). Using these data, the within-port and between-port variations were calculated to provide measures of the degree of variations in the chamber concentration. The between-port variation was an indication of the degree of spatial variation of chamber concentration. A spatial variation of ≤ 10% was considered an acceptable, uniformly distributed test atmosphere.
Test atmosphere monitoring
The aerosol mass concentration in the exposure chamber was determined by collecting the aerosol on 50 mm diameter glass-fiber filters (700800-FI-KONZ-GL, TSE Systems, Inc.) placed in closed-face filter holders. Samples were collected at a constant flow rate that was controlled by a mass flow controller (700500-MFC-OUT-002, TSE Systems, Inc.). The sampling flow rate was set to equal approximately half of the port flow rate, and the total volume of air sampled was determined as sampling flow rate times the sampling duration. Aerosol samples were collected at least once during the exposure. Filter-collected samples were weighed and analyzed by a validated LC/MS/MS method (Bryant et al., 1997; Sepehr et al., 2018) to determine the amount of NNK. In addition, the real-time aerosol concentration in the exposure chamber was monitored with an aerosol sensor (MicroDust Pro, Casella CEL Inc., Buffalo, NY). Test atmosphere temperature and relative humidity in the inhalation exposure chamber were monitored continuously with a thermohygrometer (700500-TL, TSE Systems, Inc.) in the breathing zone of the exposure port; the oxygen level in the breathing zone of the exposure port was monitored continuously with an oxygen sensor (700500-GM-O2, TSE Systems, Inc.). Aerosol particle size distribution was measured once in each exposure group with a Mercer type 7-stage cascade impactor (700800-CI-005, TSE Systems, Inc.). The Mercer impactor is a cascade of 7 inertial impactors in which the suspended particles are classified according to their effective aerodynamic sizes ranging from 0.33 to 5.1 µm. The mass median aerodynamic diameter (MMAD) and geometric standard deviation (GSD) were calculated from the mass accumulated on each stage of the impactor. The target for MMAD was between 1 and 2.5 μm, with a GSD of 1–3 to ensure pulmonary deposition of test aerosols (Raabe et al., 1988).
In-Life Data Collections
Body weights
Body weights of all rats were determined within 24 h before randomization. Body weights of Toxicology rats were measured daily on days 1 to 14. Fasted (overnight) body weights were measured immediately prior to the scheduled terminal necropsy (day 15).
Food consumption
Food consumption measurements were performed concurrently with body weight measurements for the Toxicology rats only. Rats were double housed; diet intake was measured per cage and the average intake per rat is reported.
Mortality and morbidity observations
Cage-side observations of all rats for mortality, morbidity, and general appearance were made twice daily, once in the morning and once in the afternoon. Rats in potential moribund condition were identified for further monitoring or possible euthanasia by the Institutional Veterinarian. All early death or moribund rats were removed from the study and transferred to Pathology for necropsy.
Clinical observations
The Toxicology rats received daily clinical observations within approximately 1 h after the termination of exposure. Clinical signs of altered behavior, changes in coat condition, unusual discharge of body fluid, abnormal respiration, lesions, or other relevant observations were recorded individually.
Exposure assessment blood sampling
On exposure days 1, 8, and 14, male and female rats from each Exposure Assessment subgroup were bled via their tail-vein after daily NNK exposure to determine plasma levels of NNK, NNAL, and their glucuronides (reported as total NNK, tNNK, and total NNAL, tNNAL, respectively). Within approximately 5 min after exposure, blood was collected into ethylenediaminetetraacetic acid (EDTA) tubes, centrifuged at a relative centrifugal force of 1500 to 2000 × g for 15 min to collect plasma, which was stored frozen at < −60°C until analysis for tNNK and tNNAL by LC/MS/MS (Bryant et al., 1997; Sepehr et al., 2018). On exposure day 4, male and female Exposure Assessment subgroup rats were bled prior to the daily exposure via lateral tail vein; blood was collected into heparinized tubes for the micronucleus assay.
Exposure assessment urine sampling
On exposure days 1 and 8 upon completion of daily NNK inhalation exposure, all male and female rats from each Exposure Assessment subgroup were singly housed in metabolic cages for overnight urine collection. Access to water and food was ad libitum. The urine volume was recorded, and the samples were centrifuged at 3000 rpm for 10 min at 4°C, and the supernatants were stored at < −60°C until analysis for tNNK and tNNAL by LC/MS/MS (Bryant et al., 1997; Sepehr et al., 2018). Additionally, on day 14 upon completion of daily inhalation exposure, all male and female rats from the Exposure Assessment subgroup were singly housed in metabolic cages for overnight urine collection. The total volume was recorded, and 2 ml of precentrifuged urine was transferred on ice to Toxicology Pathology Associates for urinalysis. The remaining urine was centrifuged at 3000 rpm for 10 min at 4°C, and the supernatant was stored at < –60°C until analyzed for the total urinary excretion amounts of tNNK and tNNAL by LC/MS/MS.
Clinical Pathology
Hematology (including coagulation tests) and blood chemistry studies were performed on all Toxicology rats at terminal necropsy. Urinalysis was performed on the Exposure Assessment rats immediately after final NNK inhalation exposure. For blood collection, rats were fasted overnight prior to blood collection, then anesthetized with sodium pentobarbital (100 mg/kg BW; Nembutal, Abbott Laboratories, Chicago, IL) by intraperitoneal injection and, after reaching a surgical plane of anesthesia, the abdominal and chest cavities were exposed. Blood was collected via open-chest cardiac puncture using a vacutainer holder and needle. The samples were aliquoted into serum-separating tubes (SST) for serum preparation, EDTA tubes for hematological testing, and sodium citrate tubes for coagulation studies. The SST samples for clinical chemistry were allowed to clot and then centrifuged. The sodium citrate tubes were centrifuged and the plasma aliquoted into prelabeled tubes for coagulation testing. Urine was collected as previously described.
Necropsy and Histopathology
One day after the last inhalation dose, all terminal sacrifice Toxicology rats were anesthetized with sodium pentobarbital (100 mg/kg BW) via intraperitoneal injection, blood was collected via open-chest cardiac puncture for hematology, clinical chemistry, and coagulation tests as specified in the previous section. A complete necropsy was performed on all terminal sacrifice and early death in Toxicology rats. Each tissue except for the eyes and testes was fixed in 10% neutral-buffered formalin (Fisher Scientific, Pittsburgh, PA). The eyes and testes were fixed in modified Davidson’s fixative for 48–96 h and then transferred to 10% neutral buffered formalin. Fixed tissues were routinely processed, paraffin-embedded, sectioned approximately 5 µm thick, mounted on glass slides, stained with hematoxylin and eosin (H&E), and evaluated by light microscopy. Sections of all 5 lung lobes, longitudinal section of the trachea, and Levels 1 and 2 of the 4 trimmed levels of the nose (Young, 1981) were also stained with alcian blue/periodic acid-Schiff (AB/PAS) and evaluated by light microscopy. When applicable, nonneoplastic lesions were graded for severity as 1 (minimal), 2 (mild), 3 (moderate), or 4 (marked).
Organ weight
Surviving Toxicology group rats were fasted overnight (approximately 20–24 h) and weighed prior to necropsy. Adrenal glands, brain, heart, kidneys, liver, lung, larynx (including trachea distal to the thyroid glands), spleen, testes or ovaries, thymus, and uterus were removed, trimmed to remove fat and other contiguous tissue, and weighed. Paired organs, except lung, were weighed separately. Organ weight/body weight ratios were calculated using the terminal (fasted) body weight. For surviving Exposure Assessment group rats, final body weight (not fasted body weight) was recorded at necropsy. Selected organ weights (ie, lung, liver, pancreas, kidneys, and urinary bladder) were taken.
Exposure Assessment Biomarkers Analysis
One day after the last inhalation exposure, blood was collected via cardiac puncture on all surviving Exposure Assessment rats after anesthesia by exposure to CO2. Blood was collected into EDTA tubes, centrifuged, and the separated plasma was stored at < −60°C for determination of tNNK and tNNAL. At necropsy, the lung, liver, pancreas, kidneys, and urinary bladder were collected, washed of adhering blood with 0.9% saline, blotted, weighed, and placed in polypropylene tubes on dry ice. The samples were stored at < −60°C for subsequent analyses for tNNK and tNNAL, and O6-methylguanine via LC/MS/MS methods (Bryant et al., 1997; Lang et al., 2013; Sepehr et al., 2018). The blood and urine samples were collected on days 1, 8, and 14 as previously described, and together with the blood and tissues samples collected at necropsy (day 15) were analyzed for tNNK, tNNAL, and O6-methylguanine (lung and liver tissues only) by LC/MS/MS.
Micronucleus Assay
At necropsy for the Exposure Assessment rats, an aliquot of peripheral blood was collected into tubes containing heparin for micronucleus (MN) assays; bone marrow also was collected for micronucleus assays. Together with the blood samples collected on day 4 as previously described, the peripheral blood and bone marrow erythrocyte micronucleus frequencies were analyzed according to OECD guidelines (OECD, 2014). Methods for processing, storage, labeling, and flow cytometric analysis were detailed in manuals supplied with the kits used for the analysis of MN in bone marrow (Litron, version 130712a, Litron Laboratories, Rochester, NY) and peripheral blood (Litron, version 130712 b). Additional information for the bone marrow MN assay is in Fiedler et al. (2010). Positive and negative controls included with the kits were analyzed in conjunction with the test samples. All analyses were conducted on a BD FACSCanto II flow cytometer running FACSDiva software (BD Biosystems, San Jose, CA). Data were collected for 20,000 reticulocytes (RETs), and the greater number of mature erythrocytes interrogated during data collection on 20,000 RETs.
Statistical Analyses
Descriptive statistics (mean ± standard error or mean ± standard deviation) were calculated for measurable study variables with the goal of determining the effect of NNK nose-only inhalation exposure on tested variables. All analyses were performed independently for each sex. Where appropriate, statistical analyses were conducted using analysis of variance (ANOVA) methods including the repeated measure analysis of variance method. A nonparametric relative treatment effects method based on midranks was also used for clinical pathology data. Dunnett's adjustment method was used for pairwise multiple group comparisons. For analyses of histopathological nonneoplastic lesions, lesion incidence was compared to the control group using Fisher’s exact test. The Cochran-Armitage test was used to test for the linear dose trend of lesion incidence. The Jonckheere-Terpstra test was performed to test for monotonic dose trends. The Shirley-Williams test, with the assumption of monotonic dose response, was used to compare lesion severity for each dose group to the control group. All tests were 2-sided and statistical significance was assessed at the nominal 0.05 level. SAS 9.3 (SAS Institute Inc., Cary, NC) and SigmaPlot 13.0 (SPSS Inc., Chicago, IL) software were used in the statistical analyses.
RESULTS
Nose-Only Inhalation Exposure Summary
The measured mass concentrations and particle size distributions of the NNK are summarized in Supplementary Table 1A. NNK aerosol samples were collected daily on filters during the 1 h or 4 h exposures and analyzed by LC/MS/MS. There was no NNK detected in control Group I (Sham) or Group II (Vehicle). The inhaled NNK doses for both sexes in the main Toxicology study groups and the male Haber’s Rule groups were within ± 10% of the target dose designed range. The inhaled NNK doses for the female Haber’s Rule groups were between 10% and 15% of the target dose; the higher variation was due to lower body weights. The NNK aerosol concentrations for all treatment groups were within ± 10% of the designated target concentration range and consistent for 14 consecutive days. The aerosol particle size distributions (MMADs of 1.11–1.73 µm and GSDs of 1.41–1.91) for all groups were within the target range. The mean values of chamber temperature, relative humidity, and oxygen concentration are presented in Supplementary Table 1B. The exposure chamber temperature (21.4–23.8°C), relative humidity (39.2–78.4%), and oxygen levels (20.6–20.8%) were within the target range.
Body Weights
Body weights of the main Toxicology rats were measured daily on days 1–14 (Figure 1 and 2). With the female rats, there was a significant dose trend of decreasing body weight beginning at day 7 (Supplementary Table 2). Pairwise comparisons to the Vehicle Control group indicated that the High NNK treatment group had a significant decrease in body weight beginning at day 8. Body weights within all the female main Toxicology treatment groups were within 92–103% of the appropriate Vehicle Control group. With the male rats, there was a significant dose trend of decreasing body weight beginning at day 10 (Supplementary Table 3). Body weights of all the male main Toxicology treatment groups were within 93–104% of the appropriate Vehicle Control group and none of the treatment groups differed significantly when pairwise comparisons were conducted.
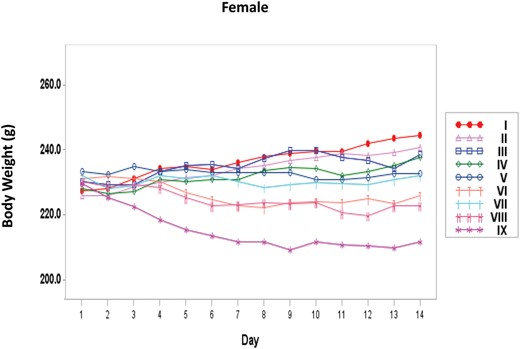
Body weights of female rats treated with NNK by nose-only inhalation for 14 days. I= Sham control; II = Vehicle Control; III = Low; IV = Mid; V = Mid High; VI = High; VII = Haber Mid; VIII = Haber Mid High; IX = Haber High.
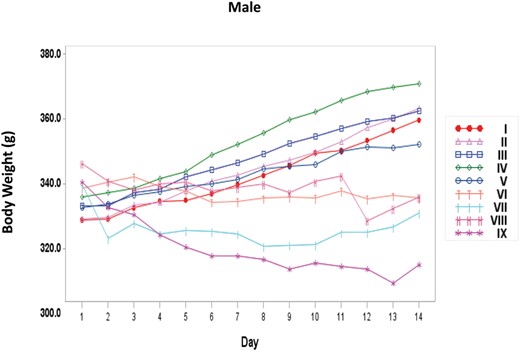
Body weights of male rats treated with NNK by nose-only inhalation for 14 days. I, = Sham control; II = Vehicle Control; III = Low; IV = Mid; V = Mid High; VI = High; VII = Haber Mid; VIII = Haber Mid High; IX = Haber High.
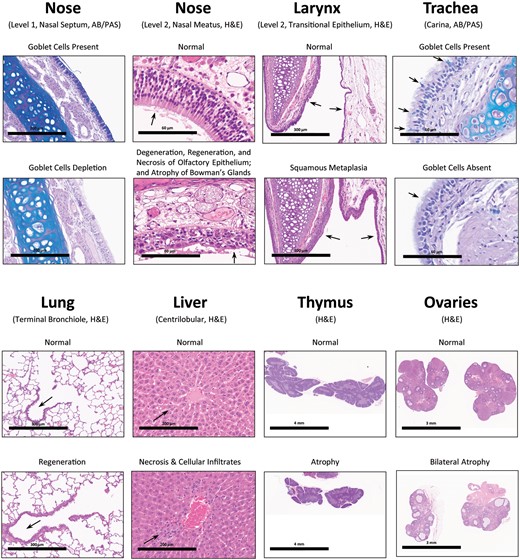
Represe ntative non-neoplastic microscopic findings of the main Toxicology rats treated with High dose (50 mg/kg BW) of NNK by nose-only inhalation for 14 days. By comparing with control rats, significant non-neoplastic lesions were observed in High dose rats of both sexes. For example, in the nose: depletion of goblet cells from the mucosa of Level 1’s nasal septum (200 µm); and degeneration, regeneration, and necrosis of olfactory epithelium with atrophy of its underlying Bowman’s glands (60 µm). In the larynx: squamous metaplasia (300 µm). In the trachea: depletion of goblet cells (60 µm). In the lung: regeneration of bronchiolar epithelium (300 µm). In the liver: centrilobular necrosis (centrilobular single cell necrosis) and centrilobular cellular infiltration of mononuclear cells (200 µm). In the thymus: atrophy (4 mm). In the ovaries (female): bilateral atrophy (3 mm).
Body weights of the Haber’s Rule rats were measured daily on days 1–14. With the female rats, pairwise comparisons to the main Toxicology groups indicated that the High NNK treatment group had a significant decrease in body weight beginning at day 9 (Supplementary Table 4). Body weights of all-female Haber’s Rule treatment groups were within 94–102% of the appropriate main Toxicology group. With the male rats, pairwise comparisons to the main Toxicology groups indicated that the Mid NNK treatment group had a significant decrease in body weight beginning at day 6 (Supplementary Table 5). Males in the High NNK treatment Haber’s Rule group had a significant decrease in body weight on days 11 and 13. Body weights of all-male Haber’s Rule treatment groups were within 90–105% of the appropriate main Toxicology group.
Analysis of Food Consumption
Food consumption was measured daily in both the main Toxicology group rats and the Haber’s Rule group rats. There were sporadic statistically significant trends and pairwise comparisons; nonetheless, the rats did not exhibit any strong systematic patterns in food intake as a function of dose (data not shown).
Clinical Observations
The Toxicology rats received daily clinical observations within approximately 1 h after the termination of exposure. There were generally no significant clinical signs of altered behavior, changes in coat condition, unusual discharge of body fluid, abnormal respiration, lesions, or other relevant observations.
Hematology and Clinical Chemistry
One day after the last NNK inhalation exposure, blood was collected for hematology and clinical chemistry measurements.
In female main Toxicology rats, there were no significant changes in hematology values (Supplementary Table 6). In female Haber’s Rule rats, there were sporadic statistically significant differences from the female main Toxicology rats in white blood cells, neutrophils, lymphocytes, monocytes, eosinophils, basophils, and platelets, percent neutrophils and lymphocytes, prothrombin time, activated partial thromboplastin time, and thrombin clotting time; however, the magnitude of the change was small and probably biologically inconsequential. In male main Toxicology rats, there was a statistically significant increase in red blood cells, hemoglobin concentration, and hematocrit in the High dose group, but the magnitude of the increase was slight (Supplementary Table 7). Sporadic changes were also observed in male Haber’s Rule rats, but the magnitude of change was probably of little biological importance (Supplementary Table 7).
Female main Toxicology rats had statistically significant changes in glucose, total protein, globulin, lactate dehydrogenase, alanine aminotransferase, alkaline phosphatase, and sodium (Supplementary Table 8), but the magnitude of the change was slight. Female Haber’s Rule rats also had statistically significant alterations in a number of clinical chemistry parameters, but the magnitude of the alteration was small (Supplementary Table 8). Male main Toxicology rats had statistically significant changes in glucose, total protein, globulin, alanine aminotransferase, and aspartate aminotransferase (Supplementary Table 9), but again the magnitude of the change suggested little biological consequence. Sporadic changes were also observed in male Haber’s Rule rats, but the magnitude of change was also probably of little biological importance (Supplementary Table 9).
Urinalysis
After cessation of the NNK inhalation exposure on day 14, six main Toxicology rats per treatment group were immediately housed singly in metabolic cages for overnight urine collection for urinalysis.
There was not a treatment-related effect of urine-specific gravity in either males or females. Female High dose NNK rats appeared to exhibit higher blood hemoglobin counts and a somewhat higher red blood cell count. Male High dose NNK rats appeared to exhibit higher levels of glucose, ketones, and blood hemoglobin counts. But the magnitude of the changes in both females and males suggested little biological consequence. There were no other noticeable treatment associations. In conclusion, generally, there were no strong treatment associations for the urinalysis parameters of male and female rats (data not shown).
Mortality and Gross Observations
No NNK treatment-related deaths were observed in this study.
A gross observation of a small thymus in terminal sacrifice rats was considered to be treatment related. This observation was recorded in two High NNK Toxicology males, one Haber’s Rule Mid NNK male, four Haber’s Rule Mid High NNK males, four Haber’s Rule High NNK males, and three Haber’s Rule High NNK females. Although there were no concurrent Control Haber’s rule rats, the gross observation of a small thymus was considered related to the nose-only inhalation of NNK aerosols (based upon a dose-response in the Haber’s Rule treatment groups). The gross observation of the small thymus had a microscopic correlate of atrophy.
Organ Weights
In female main Toxicology rats, there was a significant dose-related increasing trend in absolute and relative lung weight, with the increase (absolute ∼9%) being significant in the Mid High and High dose groups. There was also a significant dose-related decreasing trend in relative thymus weight, with the absolute and relative decrease (absolute ∼29%) being significant in the High dose group. In female Haber’s Rule rats there were sporadic significant differences from the main Toxicology rats in absolute and/or relative adrenal gland (left), kidney (left), and ovary (left) weights (Table 2, Supplementary Table 10).
Selected Organ Weights and Relative Organ Weight Ratios of Female and Male Rats Treated with NNK by Nose-Only Inhalation for 14 Days
| Organ | Measure | Exposure Group | ||||||||
|---|---|---|---|---|---|---|---|---|---|---|
| I | II | III | IV | V | VI | VII | VIII | IX | ||
| Sham | Vehicle | Low | Mid | Mid High | High | Haber Mid | Haber Mid High | Haber High | ||
| (n = 10) | (n = 10) | (n = 10) | (n = 10) | (n = 10) | (n = 10) | (n = 6) | (n = 7 or 6) | (n = 6 or 7) | ||
| Female | ||||||||||
| Lung | Absolute (g) | 1.136 ± 0.027 | 1.132 ± 0.030a | 1.168 ± 0.016 | 1.146 ± 0.036 | 1.234 ± 0.029b | 1.230 ± 0.036b | 1.153 ± 0.029 | 1.168 ± 0.028 | 1.227 ± 0.038 |
| Relative (%) | 0.498 ± 0.014 | 0.492 ± 0.013a | 0.514 ± 0.009 | 0.513 ± 0.012 | 0.567 ± 0.016b | 0.581 ± 0.015b | 0.531 ± 0.016 | 0.561 ± 0.009 | 0.630 ± 0.019e | |
| Thymus | Absolute (g) | 0.436 ± 0.024 | 0.478 ± 0.030 | 0.429 ± 0.029 | 0.406 ± 0.024 | 0.383 ± 0.021 | 0.340 ± 0.022b | 0.356 ± 0.025 | 0.305 ± 0.019 | 0.286 ± 0.044 |
| Relative (%) | 0.191 ± 0.010 | 0.207 ± 0.011a | 0.188 ± 0.012 | 0.182 ± 0.011 | 0.175 ± 0.009 | 0.161 ± 0.010b | 0.164 ± 0.012 | 0.146 ± 0.007 | 0.145 ± 0.020 | |
| Adrenal gland, left | Absolute (g) | 0.034 ± 0.001 | 0.033 ± 0.001 | 0.034 ± 0.002 | 0.035 ± 0.001 | 0.037 ± 0.003 | 0.033 ± 0.002 | 0.036 ± 0.003 | 0.035 ± 0.002 | 0.036 ± 0.001e |
| Relative (%) | 0.015 ± 0.001 | 0.015 ± 0.001 | 0.015 ± 0.001 | 0.016 ± 0.001 | 0.017 ± 0.001 | 0.016 ± 0.001 | 0.017 ± 0.001 | 0.017 ± 0.001 | 0.018 ± 0.000e | |
| Adrenal gland, right | Absolute (g) | 0.033 ± 0.002 | 0.031 ± 0.001 | 0.031 ± 0.002 | 0.033 ± 0.002 | 0.033 ± 0.002 | 0.030 ± 0.002 | 0.034 ± 0.002 | 0.033 ± 0.002 | 0.032 ± 0.002 |
| Relative (%) | 0.015 ± 0.001 | 0.014 ± 0.001 | 0.014 ± 0.001 | 0.015 ± 0.001 | 0.015 ± 0.001 | 0.014 ± 0.001 | 0.015 ± 0.001 | 0.016 ± 0.001 | 0.017 ± 0.001 | |
| Male | ||||||||||
| Lung | Absolute (g) | 1.435 ± 0.048 | 1.389 ± 0.052a | 1.451 ± 0.039 | 1.624 ± 0.142 | 1.512 ± 0.085 | 1.591 ± 0.033b | 1.461 ± 0.055 | 1.431 ± 0.031 | 1.500 ± 0.035 |
| Relative (%) | 0.414 ± 0.011 | 0.405 ± 0.009 | 0.422 ± 0.012 | 0.460 ± 0.037 | 0.453 ± 0.025 | 0.503 ± 0.015b | 0.467 ± 0.013 | 0.453 ± 0.011 | 0.515 ± 0.010 | |
| Thymus | Absolute (g) | 0.465 ± 0.034 | 0.415 ± 0.020 | 0.456 ± 0.031 | 0.422 ± 0.051 | 0.385 ± 0.034 | 0.371 ± 0.034 | 0.306 ± 0.023 | 0.270 ± 0.043 | 0.251 ± 0.020 |
| Relative (%) | 0.135 ± 0.011 | 0.121 ± 0.005 | 0.132 ± 0.008 | 0.124 ± 0.011 | 0.115 ± 0.010 | 0.117 ± 0.010 | 0.098 ± 0.006 | 0.084 ± 0.011d | 0.086 ± 0.007e | |
| Adrenal gland, left | Absolute (g) | 0.029 ± 0.002 | 0.029 ± 0.001a | 0.033 ± 0.001 | 0.032 ± 0.001 | 0.031 ± 0.001 | 0.034 ± 0.002b | 0.032 ± 0.002 | 0.031 ± 0.002 | 0.033 ± 0.003 |
| Relative (%) | 0.008 ± 0.000 | 0.009 ± 0.001a | 0.010 ± 0.000 | 0.009 ± 0.000 | 0.009 ± 0.000 | 0.011 ± 0.001b | 0.010 ± 0.001 | 0.010 ± 0.000 | 0.011 ± 0.001 | |
| Adrenal gland, right | Absolute (g) | 0.029 ± 0.001 | 0.028 ± 0.001 | 0.034 ± 0.003 | 0.031 ± 0.001 | 0.029 ± 0.002 | 0.035 ± 0.002b | 0.032 ± 0.002 | 0.028 ± 0.002 | 0.032 ± 0.001 |
| Relative (%) | 0.008 ± 0.000 | 0.008 ± 0.000a | 0.010 ± 0.001 | 0.009 ± 0.000 | 0.009 ± 0.001 | 0.011 ± 0.001b | 0.010 ± 0.000 c | 0.009 ± 0.000 | 0.011 ± 0.001 | |
Data are reported as the mean ± SE.
Significant dose-related trend (p ≤ .05).
Significant difference (p ≤ .05) from Group II Vehicle.
Significant difference (p ≤ .05) between groups IV Mid versus VII Haber Mid.
Significant difference (p ≤ .05) between groups V Mid High versus VIII Haber Mid High.
Significant difference (p ≤ .05) between groups VI High versus IX Haber High.
In male main Toxicology rats, there was a significant dose-related increasing trend in absolute and/or relative lung and adrenal glands weights, with the increase (absolute lung ∼15%; absolute adrenal glands ∼17–25%) being significant in the High dose group. In male Haber’s Rule rats, there were sporadic significant differences from the main Toxicology rats in absolute and/or relative adrenal gland (left), testes, and thymus weights (Table 2, Supplementary Table 11).
Histopathology
There were no neoplastic findings in the study.
Female Toxicology rats treated with NNK for 14 days had dose-related increasing trends of non-neoplastic lesions (typically with increases in severity) associated with the nose, larynx, trachea, lung, liver, and ovary (Table 3).
Prevalence of Microscopic Findings in Female Rats Treated with NNK by Nose-Only Inhalation for 14 days
| Lesion | Sham 0 mg/kg | Vehicle 0 mg/kg | Low 0.8 mg/kg | Mid 3.2 mg/kg | Mid High 12.5 mg/kg | High 50 mg/kg | Haber Mid 3.2 mg/kg | Haber Mid High 12.5 mg/kg | Haber High 50 mg/kg | |
|---|---|---|---|---|---|---|---|---|---|---|
| Nose degeneration, olfactory epithelium | Incidencea | 0/10 | 0/10 | 0/10 | 10/10 | 10/10 | 10/10 | 6/6 | 7/7 | 6/6 |
| Severityb | 0.0 | 0.0 | 0.0 | 2.0 | 3.0 | 4.0 | 2.0 | 3.0 | 4.0 | |
| % incidence | 0 | 0 | 0 | 100 | 100 | 100 | 100 | 100 | 100 | |
| CAFE p-valuec,d | <.01 | — | <.01 | <.001 | <.001 | — | — | — | ||
| Nose regeneration, olfactory epithelium | Incidence | 0/10 | 0/10 | 0/10 | 10/10 | 10/10 | 10/10 | 6/6 | 7/7 | 6/6 |
| Severity | 0.0 | 0.0 | 0.0 | 1.0 | 3.0 | 4.0 | 1.0 | 3.0 | 4.0 | |
| % incidence | 0 | 0 | 0 | 100 | 100 | 100 | 100 | 100 | 100 | |
| CAFE p-value | <.001 | — | <.001 | <.001 | <.001 | — | — | — | ||
| Nose necrosis, olfactory epithelium | Incidence | 0/10 | 0/10 | 0/10 | 0/10 | 10/10 | 10/10 | 0/6 | 7/7 | 6/6 |
| Severity | 0.0 | 0.0 | 0.0 | 0.0 | 1.0 | 1.0 | 0.0 | 1.0 | 1.0 | |
| % incidence | 0 | 0 | 0 | 0 | 100 | 100 | 0 | 100 | 100 | |
| CAFE p-value | <.001 | — | — | <.001 | <.001 | — | — | — | ||
| Nose atrophy, olfactory epithelial glands | Incidence | 0/10 | 0/10 | 0/10 | 10/10 | 10/10 | 10/10 | 6/6 | 7/7 | 6/6 |
| Severity | 0.0 | 0.0 | 0.0 | 3.0 | 3.9 | 4.0 | 3.0 | 4.0 | 4.0 | |
| % incidence | 0 | 0 | 0 | 100 | 100 | 100 | 100 | 100 | 100 | |
| CAFE p-value | <.001 | — | <.001 | <.001 | <.001 | — | — | — | ||
| Nose inflammation, acute | Incidence | 0/10 | 0/10 | 0/10 | 10/10 | 10/10 | 10/10 | 6/6 | 7/7 | 6/6 |
| Severity | 0.0 | 0.0 | 0.0 | 1.0 | 2.0 | 2.0 | 1.0 | 2.0 | 2.0 | |
| % incidence | 0 | 0 | 0 | 100 | 100 | 100 | 100 | 100 | 100 | |
| CAFE p-value | <.001 | — | <.001 | <.001 | <.001 | — | — | — | ||
| Nose depletion, goblet cells | Incidence | 0/10 | 0/10 | 3/10 | 10/10 | 10/10 | 10/10 | 6/6 | 7/7 | 6/6 |
| Severity | 0.0 | 0.0 | 1.0 | 3.3 | 3.8 | 4.0 | 3.5 | 4.0 | 4.0 | |
| % incidence | 0 | 0 | 30 | 100 | 100 | 100 | 100 | 100 | 100 | |
| CAFE p-value | <.001 | 0.105 | <.001 | <.001 | <.001 | — | — | — | ||
| Nose degeneration, transitional epithelium | Incidence | 0/10 | 0/10 | 0/10 | 0/10 | 2/10 | 10/10 | 0/6 | 4/7 | 6/6 |
| Severity | 0.0 | 0.0 | 0.0 | 0.0 | 1.0 | 1.0 | 0.0 | 1.0 | 1.0 | |
| % incidence | 0 | 0 | 0 | 0 | 20 | 100 | 0 | 57 | 100 | |
| CAFE p-value | <.001 | — | — | .237 | <.001 | — | .145 | — | ||
| Nose regeneration, transitional epithelium | Incidence | 0/10 | 0/10 | 0/10 | 2/10 | 9/10 | 10/10 | 1/6 | 7/7 | 6/6 |
| Severity | 0.0 | 0.0 | 0.0 | 1.0 | 1.2 | 2.0 | 1.0 | 1.2 | 2.0 | |
| % incidence | 0 | 0 | 0 | 20 | 90 | 100 | 17 | 100 | 100 | |
| CAFE p-value | <.001 | — | .237 | <.001 | <.001 | .696N | .588 | — | ||
| Nose necrosis, transitional epithelium | Incidence | 0/10 | 0/10 | 0/10 | 0/10 | 2/10 | 10/10 | 0/6 | 3/7 | 6/6 |
| Severity | 0.0 | 0.0 | 0.0 | 0.0 | 1.0 | 1.0 | 0.0 | 1.0 | 1.0 | |
| % incidence | 0 | 0 | 0 | 0 | 20 | 100 | 0 | 43 | 100 | |
| CAFE p-value | <.001 | — | — | .237 | <.001 | — | .314 | — | ||
| Nose atrophy, glands, sinus | Incidence | 0/10 | 0/10 | 0/10 | 1/10 | 2/10 | 5/10 | 1/6 | 2/7 | 1/6 |
| Severity | 0.0 | 0.0 | 0.0 | 1.0 | 1.5 | 1.4 | 1.0 | 1.0 | 1.0 | |
| % incidence | 0 | 0 | 0 | 10 | 20 | 50 | 17 | 29 | 17 | |
| CAFE p-value | <.001 | — | .500 | .237 | .016 | 0.625 | .559 | .215N | ||
| Larynx metaplasia, squamous | Incidence | 0/10 | 0/10 | 0/10 | 0/10 | 9/10 | 10/10 | 1/6 | 6/7 | 6/6 |
| Severity | 0.0 | 0.0 | 0.0 | 0.0 | 1.0 | 3.0 | 1.0 | 1.0 | 2.6 | |
| % incidence | 0 | 0 | 0 | 0 | 90 | 100 | 17 | 86 | 100 | |
| CAFE p-value | <.001 | — | — | <.001 | <.001 | .375 | .669N | — | ||
| Larynx cellular alteration, epithelium | Incidence | 0/10 | 0/10 | 7/10 | 8/10 | 10/10 | 0/10e | 6/6 | 7/7 | 1/6d |
| Severity | NA | NA | NA | NA | NA | NA | NA | NA | NA | |
| % incidence | 0 | 0 | 70 | 80 | 100 | 0 | 100 | 100 | 17 | |
| CAFE p-value | ||||||||||
| Trachea depletion, goblet cell | Incidence | 0/10 | 0/10 | 2/10 | 2/10 | 2/10 | 9/10 | 3/6 | 3/7 | 4/6 |
| Severity | NA | NA | NA | NA | NA | NA | NA | NA | NA | |
| % incidence | 0 | 0 | 20 | 20 | 20 | 90 | 50 | 43 | 67 | |
| CAFE p-value | <.001 | .237 | .237 | .237 | <.001 | .242 | .314 | .304N | ||
| Lung regeneration, epithelium, bronchiole | Incidence | 0/10 | 0/10 | 0/10 | 0/10 | 10/10 | 10/10 | 0/6 | 7/7 | 6/6 |
| Severity | 0.0 | 0.0 | 0.0 | 0.0 | 1.6 | 2.0 | 0.0 | 1.0 | 2.0 | |
| % incidence | 0 | 0 | 0 | 0 | 100 | 100 | 0 | 100 | 100 | |
| CAFE p-value | <.001 | — | — | <.001 | <.001 | — | — | — | ||
| Liver necrosis, centrilobular | Incidence | 0/10 | 0/10 | 0/10 | 0/10 | 0/10 | 4/10 | 0/6 | 0/7 | 2/6 |
| Severity | 0.0 | 0.0 | 0.0 | 0.0 | 0.0 | 1.0 | 0.0 | 0.0 | 0.0 | |
| % incidence | 0 | 0 | 0 | 0 | 0 | 40 | 0 | 0 | 33 | |
| CAFE p-value | <.001 | — | — | — | .043 | — | — | .608N | ||
| Liver infiltration cellular, mononuclear cell, centrilobular | Incidence | 0/10 | 0/10 | 0/10 | 0/10 | 0/10 | 4/10 | 0/6 | 0/7 | 2/6 |
| Severity | 0.0 | 0.0 | 0.0 | 0.0 | 0.0 | 1.0 | 0.0 | 0.0 | 1.0 | |
| % incidence | 0 | 0 | 0 | 0 | 0 | 40 | 0 | 0 | 33 | |
| CAFE p-value | .001 | — | — | — | .043 | — | — | .608N | ||
| Thymus atrophy | Incidence | 0/10 | 0/10 | 0/10 | 0/10 | 0/10 | 0/10 | 0/6 | 0/7 | 3/6 |
| Severity | 0.0 | 0.0 | 0.0 | 0.0 | 0.0 | 0.0 | 0.0 | 0.0 | 2.0 | |
| % incidence | 0 | 0 | 0 | 0 | 0 | 0 | 0 | 0 | 50 | |
| CAFE p-value | — | — | .036 | |||||||
| Ovary atrophy, bilateral | Incidence | 0/10 | 0/10 | 0/10 | 0/10 | 0/10 | 3/10 | 0/6 | 0/7 | 3/6 |
| Severity | 0.0 | 0.0 | 0.0 | 0.0 | 0.0 | 1.3 | 0.0 | 0.0 | 1.3 | |
| % incidence | 0 | 0 | 0 | 0 | 0 | 30 | 0 | 0 | 50 | |
| CAFE p-value | .005 | — | — | — | — | — | — | .392 |
Number of animals with the lesion per number of animals examined microscopically.
Severity was graded as 1, minimal; 2, mild; 3, moderate; and 4, marked. NA, not applicable.
p-Values under the vehicle column are the results of the Cochran-Armitage trend test. p-Values under the treatment column are the results of a Fisher’s Exact comparison to the Vehicle Control.
p-Values under the Haber Mid, Haber Mid High, and Haber High columns are the results of a Fisher’s Exact comparison to the main Toxicology Mid, Mid High, and High, respectively. A “N” indicates that the Haber incidence was less than the main Toxicology incidence.
Cellular alteration of the larynx was not present in the female High Toxicology rats or in 5 of 6 female High Haber rats because squamous metaplasia was present at the base of the epiglottis in these rats rather than cellular alteration.
Non-neoplastic lesions in the nose of NNK-treated female rats consisted of degeneration, regeneration, and necrosis of the olfactory epithelium, atrophy of the olfactory epithelial glands (Bowman’s glands), acute inflammation, goblet cell depletion of the nasal septum, degeneration, regeneration, and necrosis of the transitional epithelium, and atrophy of the sinus glands (Steno’s glands) (Table 3). These lesions were not observed in the sham and vehicle control groups. The incidence of degeneration, regeneration, and necrosis of the olfactory epithelium, atrophy of the olfactory epithelial glands, acute inflammation, and goblet cell depletion of the nasal septum was 100% in the Mid, Mid High, and High dose groups, an increase that was highly significant (Table 3). Degeneration, regeneration, and necrosis of the transitional epithelium occurred at an incidence of 100% in the High NNK dose group, with somewhat lower incidence being found in the Mid and/or Mid High groups. High incidences (90–100%) of squamous metaplasia of the larynx and regeneration of the bronchiole epithelium of the lung occurred in the Mid High and High dose groups, while a 90% incidence of goblet cell depletion of the trachea was observed in the High NNK dose group. Moderate, although statistically significant, liver lesions were observed in the High NNK dose group (Table 3).
When comparing the female main Toxicology rats to the appropriate group of female Haber’s Rule rats, the only significant difference occurred with atrophy of the thymus, where the incidence was 50% in the High Haber’s Rule group compared to 0% in the High main Toxicology group (Table 3).
Male Toxicology rats treated with NNK for 14 days had dose-related increasing trends of non-neoplastic lesions, typically with increases in severity, associated with the nose, larynx, trachea, lung, and liver (Table 4).
Prevalence of Microscopic Findings in male Rats Treated with NNK by Nose-Only Inhalation for 14 days
| Lesion | Sham 0 mg/kg | Vehicle 0 mg/kg | Low 0.8 mg/kg | Mid 3.2 mg/kg | Mid High 12.5 mg/kg | High 50 mg/kg | Haber Mid 3.2 mg/kg | Haber Mid High 12.5 mg/kg | Haber High 50 mg/kg | |
|---|---|---|---|---|---|---|---|---|---|---|
| Nose degeneration, olfactory epithelium | Incidencea | 0/10 | 0/10 | 0/10 | 10/10 | 10/10 | 10/10 | 6/6 | 6/6 | 7/7 |
| Severityb | 0.0 | 0.0 | 0.0 | 2.0 | 3.0 | 4.0 | 2.0 | 3.0 | 4.0 | |
| % incidence | 0 | 0 | 0 | 100 | 100 | 100 | 100 | 100 | 100 | |
| CAFE p-valuec,d | <.001 | — | <.001 | <.001 | <.001 | — | — | — | ||
| Nose regeneration, olfactory epithelium | Incidence | 0/10 | 0/10 | 0/10 | 10/10 | 10/10 | 10/10 | 6/6 | 6/6 | 7/7 |
| Severity | 0.0 | 0.0 | 0.0 | 1.0 | 3.0 | 4.0 | 1.0 | 3.0 | 4.0 | |
| % incidence | 0 | 0 | 0 | 100 | 100 | 100 | 100 | 100 | 100 | |
| CAFE p-value | <.001 | — | <.001 | <.001 | <.001 | — | — | — | ||
| Nose necrosis, olfactory epithelium | Incidence | 0/10 | 0/10 | 0/10 | 0/10 | 10/10 | 10/10 | 0/6 | 6/6 | 7/7 |
| Severity | 0.0 | 0.0 | 0.0 | 0.0 | 1.0 | 1.0 | 0.0 | 1.0 | 1.0 | |
| % incidence | 0 | 0 | 0 | 0 | 100 | 100 | 0 | 100 | 100 | |
| CAFE p-value | <.001 | — | — | <.001 | <.001 | — | — | — | ||
| Nose atrophy, olfactory epithelial glands | Incidence | 0/10 | 0/10 | 0/10 | 10/10 | 10/10 | 10/10 | 6/6 | 6/6 | 7/7 |
| Severity | 0.0 | 0.0 | 0.0 | 3.0 | 4.0 | 4.0 | 3.0 | 4.0 | 4.0 | |
| % incidence | 0 | 0 | 0 | 100 | 100 | 100 | 100 | 100 | 100 | |
| CAFE p-value | <.001 | — | <.001 | <.001 | <.001 | — | — | — | ||
| Nose inflammation, acute | Incidence | 0/10 | 0/10 | 0/10 | 10/10 | 10/10 | 10/10 | 6/6 | 6/6 | 7/7 |
| Severity | 0.0 | 0.0 | 0.0 | 1.0 | 2.0 | 2.0 | 1.0 | 2.0 | 2.0 | |
| % incidence | 0 | 0 | 0 | 100 | 100 | 100 | 100 | 100 | 100 | |
| CAFE p-value | <.001 | — | <.001 | <.001 | <.001 | — | — | — | ||
| Nose depletion, goblet cells | Incidence | 0/10 | 0/10 | 2/10 | 10/10 | 10/10 | 10/10 | 6/6 | 6/6 | 7/7 |
| Severity | 0.0 | 0.0 | 2.0 | 3.3 | 3.8 | 4.0 | 3.6 | 3.8 | 4.0 | |
| % incidence | 0 | 0 | 20 | 100 | 100 | 100 | 100 | 100 | 100 | |
| CAFE p-value | <.001 | .237 | <.001 | <.001 | <.001 | — | — | — | ||
| Nose degeneration, transitional epithelium | Incidence | 0/10 | 0/10 | 0/10 | 0/10 | 8/10 | 10/10 | 0/6 | 5/6 | 7/7 |
| Severity | 0.0 | 0.0 | 0.0 | 0.0 | 1.1 | 1.0 | 0.0 | 1.0 | 1.0 | |
| % incidence | 0 | 0 | 0 | 0 | 80 | 100 | 100 | 83 | 100 | |
| CAFE p-value | <.001 | — | — | <.001 | <.001 | — | .696 | — | ||
| Nose regeneration, transitional epithelium | Incidence | 0/10 | 0/10 | 0/10 | 2/10 | 8/10 | 10/10 | 3/6 | 5/6 | 7/7 |
| Severity | 0.0 | 0.0 | 0.0 | 1.0 | 1.8 | 2.0 | 1.0 | 1.8 | 2.0 | |
| % incidence | 0 | 0 | 0 | 20 | 80 | 100 | 50 | 83 | 100 | |
| CAFE p-value | <.001 | — | .237 | <.001 | <.001 | .242 | .696 | — | ||
| Nose necrosis, transitional epithelium | Incidence | 0/10 | 0/10 | 0/10 | 0/10 | 8/10 | 10/10 | 0/6 | 5/6 | 7/7 |
| Severity | 0.0 | 0.0 | 0.0 | 0.0 | 1.0 | 1.0 | 0.0 | 1.0 | 1.0 | |
| % incidence | 0 | 0 | 0 | 0 | 80 | 100 | 0 | 83 | 100 | |
| CAFE p-value | <.001 | — | — | <.001 | <.001 | — | .696 | — | ||
| Nose atrophy, glands, sinus | Incidence | 0/10 | 0/10 | 0/10 | 0/10 | 4/10 | 4/10 | 2/6 | 2/6 | 3/7 |
| Severity | 0.0 | 0.0 | 0.0 | 0.0 | 1.2 | 1.7 | 1.5 | 1.5 | 1.3 | |
| % incidence | 0 | 0 | 0 | 0 | 40 | 40 | 33 | 33 | 43 | |
| CAFE p-value | <.001 | — | — | .043 | .043 | .125 | .608N | .646 | ||
| Larynx metaplasia, squamous | Incidence | 0/10 | 0/10 | 0/10 | 0/10 | 9/10 | 10/10 | 0/6 | 6/6 | 7/7 |
| Severity | 0.0 | 0.0 | 0.0 | 0.0 | 1.0 | 3.0 | 0.0 | 1.5 | 3.0 | |
| % incidence | 0 | 0 | 0% | 0 | 90 | 100 | 0 | 100 | 100 | |
| CAFE p-value | <.001 | — | — | <.001 | <.001 | — | .625 | — | ||
| Larynx cellular alteration, epithelium | Incidence | 0/10 | 5/10 | 7/10 | 9/10 | 10/10 | 0/10e | 6/6 | 6/6 | 0/7d |
| Severity | NA | NA | NA | NA | NA | NA | NA | NA | NA | |
| % incidence | 0 | 50 | 70 | 90 | 100 | 0 | 100 | 100 | 0 | |
| CAFE p-value | ||||||||||
| Trachea depletion, goblet cell | Incidence | 0/10 | 0/10 | 0/10 | 1/10 | 4/10 | 9/10 | 3/6 | 2/6 | 4/7 |
| Severity | NA | NA | NA | NA | NA | NA | NA | NA | NA | |
| % incidence | 0 | 0 | 0 | 10 | 40 | 90 | 50 | 33 | 57 | |
| CAFE p-value | <.001 | — | .500 | .043 | <.001 | .118 | .608N | .162N | ||
| Lung regeneration, epithelium, bronchiole | Incidence | 0/10 | 0/10 | 0/10 | 0/10 | 10/10 | 10/10 | 1/6 | 6/6 | 7/7 |
| Severity | 0.0 | 0.0 | 0.0 | 0.0 | 1.6 | 2.0 | 1.0 | 1.3 | 2.0 | |
| % incidence | 0 | 0 | 0 | 0 | 100 | 100 | 17 | 100 | 100 | |
| CAFE p-value | <.001 | — | — | <.001 | <.001 | .375 | — | — | ||
| Liver necrosis, centrilobular | Incidence | 0/10 | 0/10 | 0/10 | 0/10 | 0/10 | 8/10 | 0/6 | 0/6 | 5/7 |
| Severity | 0.0 | 0.0 | 0.0 | 0.0 | 0.0 | 1.0 | 0.0 | 0.0 | 1.0 | |
| % incidence | 0 | 0 | 0 | 0 | 0 | 80 | 0 | 0 | 71 | |
| CAFE p-value | <.001 | — | — | — | <.001 | — | — | .559N | ||
| Liver infiltration cellular, mononuclear cell, centrilobular | Incidence | 0/10 | 0/10 | 0/10 | 0/10 | 0/10 | 8/10 | 0/6 | 0/6 | 5/7 |
| Severity | 0.0 | 0.0 | 0.0 | 0.0 | 0.0 | 1.0 | 0.0 | 0.0 | 1.0 | |
| % incidence | 0 | 0 | 0 | 0 | 0 | 80 | 0 | 0 | 71 | |
| CAFE p-value | <.001 | — | — | — | <.001 | — | — | .559N | ||
| Thymus atrophy | Incidence | 0/10 | 0/10 | 0/10 | 1/10 | 1/10 | 2/10 | 1/6 | 4/6 | 4/7 |
| Severity | 0.0 | 0.0 | 0.0 | 1.0 | 1.0 | 2.0 | 1.0 | 2.0 | 2.0 | |
| % incidence | 0 | 0 | 0 | 10 | 10 | 20 | 17 | 67 | 57 | |
| CAFE p-value | .053 | — | .500 | .500 | .237 | .625 | .036 | .145 |
Number of animals with the lesion per number of animals examined microscopically.
Severity was graded as 1, minimal; 2, mild; 3, moderate; and 4, marked. NA = not applicable.
p-Values under the vehicle column are the results of the Cochran-Armitage trend test. p-Values under the treatment column are the results of a Fisher’s Exact comparison to the Vehicle Control.
p-Values under the Haber Mid, Haber Mid High, and Haber High columns are the results of a Fisher’s Exact comparison to the main Toxicology Mid, Mid High, and High, respectively. A “N” indicates that the Haber incidence was less than the main Toxicology incidence.
Cellular alteration of the larynx was not present in the male High Toxicology or High Haber rats because squamous metaplasia was present at the base of the epiglottis in these rats rather than cellular alteration.
Non-neoplastic lesions in the nose of NNK-treated male rats consisted of degeneration, regeneration, and necrosis of the olfactory epithelium, atrophy of the olfactory epithelial glands (Bowman’s glands), acute inflammation, goblet cell depletion of the nasal septum, degeneration, regeneration, and necrosis of the transitional epithelium, and atrophy of the sinus glands (Steno’s glands) (Table 4). These lesions were not observed in the sham and vehicle control groups. The incidence of necrosis, degeneration, and regeneration of the olfactory epithelium, atrophy of the olfactory epithelial glands (Bowman’s glands), acute inflammation, and goblet cell depletion of the nasal septum was 100% in the Mid, Mid High, and High dose groups, an increase that was highly significant (Table 4). The incidence of necrosis of the olfactory epithelium was 100% in the Mid High and High dose groups, while the incidence of degeneration, regeneration, and necrosis of the transition epithelium was 80% in the Mid High dose group and 100% in the High dose group. High incidences (90-100%) of squamous metaplasia of the larynx and regeneration of the bronchiole epithelium of the lung occurred in the Mid High and High dose groups, while a 90% incidence of goblet cell depletion of the trachea was observed in the High NNK dose group. Moderate, although statistically significant, liver lesions were observed in the High NNK dose group (Table 4).
When comparing the male main Toxicology rats to the appropriate group of male Haber’s Rule rats, the only significant difference occurred with atrophy of the thymus, where the incidence was 67% in the Mid High Haber’s Rule group compared to 10% in the Mid High Toxicology group (Table 4).
Representative nonneoplastic lesions of the main Toxicology rats treated with a High dose (50 mg/kg BW) of NNK by nose-only inhalation for 14 days are presented in Figure 4.
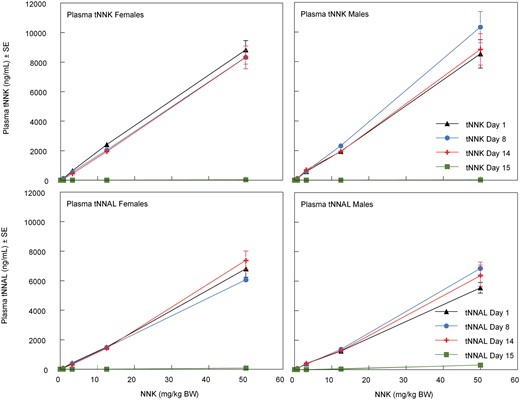
Plasma levels of tNNK and tNNAL in female and male rats treated with NNK by nose-only inhalation for 14 days. Upon the cessation of the NNK exposure on days 1, 8, and 14, blood was collected for measurement of tNNK and tNNAL. Blood was also collected at the terminal sacrifice on day 15. The target NNK dose levels were 0 mg/kg BW (Vehicle Control), 0.8 mg/kg BW (Low), 3.2 mg/kg BW (Mid), 12.5 mg/kg BW (Mid High), and 50 mg/kg BW (High).
Erythrocyte Micronucleus Assay
Peripheral blood samples were obtained on day 4 and at the terminal sacrifice (day 15) from the Exposure Assessment rats to conduct micronucleus assays. Bone marrow samples were also collected on day 15. When assessed on day 4, exposure to NNK did not affect the percentage of reticulocytes (%RETs), the percentage of micronucleated normochromatic erythrocytes (%MN-NCEs), or the percentage of micronucleated reticulocytes (%MN-RETs) in peripheral blood (Table 5). When assessed on day 15, there was a significant dose-related variation (decreasing trend) in %RETs and a significant variation of %MN-NCEs (Table 5). Pairwise comparison indicated that the %MN-NCEs in the High NNK dose group differed significantly from the sham control; nonetheless, the change was modest and a decrease rather than an increase. When assessed on day 15, exposure to NNK did not affect the %RETs, %MN-NCEs, or %MN-RETs in bone marrow (Table 6). The results showed that 14-day repeated nose-only inhalation exposure of NNK did not increase micronucleus frequencies in the peripheral blood or bone marrow erythrocytes of rats of either sex.
Peripheral Blood MN Frequency in Sprague-Dawley Rats Treated with NNK by Nose-Only Inhalation for 14 days
| Sampling Time | Group | %RETs | %MN-NCEs | %MN-RETs |
|---|---|---|---|---|
| Day 4 | Sham | 1.69 ± 0.38 | 0.14 ± 0.18 | 0.24 ± 0.24 |
| Vehicle | 1.73 ± 0.53 | 0.08 ± 0.06 | 0.09 ± 0.08 | |
| Low | 1.44 ± 0.50 | 0.08 ± 0.04 | 0.18 ± 0.08 | |
| Mid | 1.33 ± 0.38 | 0.06 ± 0.03 | 0.16 ± 0.05 | |
| Mid High | 1.55 ± 0.54 | 0.07 ± 0.07 | 0.19 ± 0.07 | |
| High | 1.44 ± 0.40 | 0.04 ± 0.02 | 0.18 ± 0.05 | |
| ANOVA | p = .16 | p = .14 | p = .59 | |
| Day 15 | Sham | 2.10 ± 0.51a | 0.02 ± 0.00a | 0.15 ± 0.04a |
| Vehicle | 2.19 ± 0.45a | 0.02 ± 0.01a | 0.13 ± 0.05a | |
| Low | 1.97 ± 0.50 | 0.02 ± 0.01 | 0.13 ± 0.03 | |
| Mid | 1.75 ± 0.34 | 0.02 ± 0.01 | 0.15 ± 0.04 | |
| Mid High | 1.67 ± 0.40 | 0.02 ± 0.01 | 0.14 ± 0.05 | |
| High | 1.61 ± 0.63 | 0.01 ± 0.01* | 0.12 ± 0.05 | |
| ANOVA | p = .02b | p = .01 | p = .57 |
%RETs, percent reticulocytes (among total erythrocytes); %MN-NCE, percent micronucleated normochromatic (mature) erythrocytes; %MN-RETs, percent micronucleated reticulocytes.
The data are presented as the mean ± SD for 12 rats (6 males and 6 females), except where noted.
n = 11.
It was significant via ANOVA but not between the NNK dosed groups and the negative control by following Dunnett’s or Dunn’s test.
p < .05 versus concurrent sham control.
Bone Marrow MN Frequency in Sprague-Dawley Rats Treated with NNK by Nose-Only Inhalation for 14 days
| Sampling Time | Group | %RETs | %MN-NCEs | %MN-RETs |
|---|---|---|---|---|
| Day 15 | Sham | 40.99 ± 10.18a | 0.19 ± 0.15a | 0.74 ± 0.27a |
| Vehicle | 37.59 ± 4.20a | 0.23 ± 0.06a | 0.87 ± 0.47a | |
| Low | 44.53 ± 7.70 | 0.29 ± 0.17 | 0.71 ± 0.32 | |
| Mid | 37.34 ± 10.53 | 0.16 ± 0.09 | 0.59 ± 0.23 | |
| Mid High | 38.78 ± 8.92 | 0.22 ± 0.17 | 0.68 ± 0.32 | |
| High | 35.89 ± 10.41 | 0.29 ± 0.22 | 0.66 ± 0.38 | |
| ANOVA | p = .13 | p = .19 | p = .70 |
%RETs, percent reticulocytes (among total erythrocytes); %MN-NCE, percent micronucleated normochromatic (mature) erythrocytes; %MN-RETs, percent micronucleated reticulocytes.
The data are presented as the mean ± SD for 12 rats (6 males and 6 females), except where noted.
n = 11.
Chemistry and Bioanalytical Analyses for Biomarkers
Plasma levels of tNNK and tNNAL
Upon the cessation of the NNK exposure on days 1, 8, and 14, blood was collected for measurement of plasma levels of tNNK and tNNAL. Blood was also collected at the terminal sacrifice on day 15 for similar measurements.
The plasma levels of tNNK increased in a linear manner with the administered NNK dose in both the male and female rats, with nearly identical values being obtained on days 1, 8, and 14 for each dose level (Figure 4). This suggested that there was complete clearance of the tNNK within 24 h. When measured on day 15, the levels of tNNK approached the background levels (Figure 4), which confirmed the rapid elimination of tNNK.
The plasma levels of tNNAL increased in a linear manner with the administered NNK dose in both female and male rats (Figure 4). The levels of tNNAL were slightly lower than the levels of tNNK. Likewise, the levels of tNNAL in male rats were slightly lower than female rats. The levels of tNNAL at each dose level were nearly identical on days 1, 8, and 14, which indicated that there was complete clearance of the tNNAL within 24 h. The levels of tNNAL approached background when assessed on day 15, which confirmed the rapid clearance of the tNNAL.
Urinary levels of tNNK and tNNAL
Upon the cessation of the NNK exposure on days 1, 8, and 14, rats were transferred to metabolism cages for overnight urine collection for measurement of the total urinary excretion amounts of tNNK and tNNAL.
The urinary levels of tNNK increased in a linear manner with the administered NNK dose in both the male and female rats, with similar values being obtained on days 1, 8, and 14 for each dose level (Figure 5).
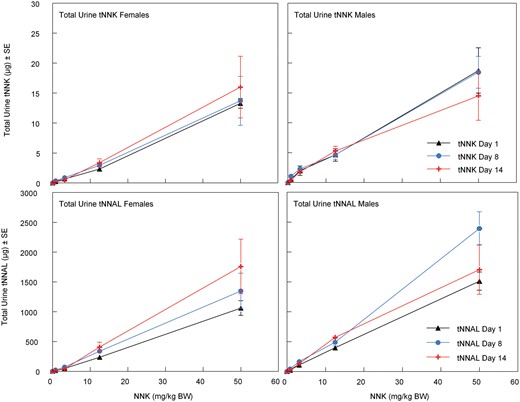
Urinary levels of tNNK and tNNAL in female and male rats treated with NNK by nose-only inhalation for 14 days. Upon the cessation of the NNK exposure on days 1, 8, and 14, rats were transferred to metabolism cages for overnight urine collection for measurement of the total urinary excretion amounts of tNNK and tNNAL. The target NNK dose levels were 0 mg/kg BW (Vehicle Control), 0.8 mg/kg BW (Low), 3.2 mg/kg BW (Mid), 12.5 mg/kg BW (Mid High), and 50 mg/kg BW (High).
The urinary levels of tNNAL were approximately 100-fold greater than the urinary levels of tNNK. As with tNNK, the urinary levels of tNNAL increased in a linear manner with the administered NNK dose in both the male and female rats, with similar values being obtained on days 1, 8, and 14 for each dose level (Figure 5).
Tissue levels of tNNK and tNNAL
The liver, lung, kidneys, pancreas, and urinary bladder were collected on day 15 for measurement of tNNK and tNNAL.
The tissue levels of tNNAL increased in a linear manner with the administered NNK dose in both the male and female rats (Figure 6). In both sexes, the highest tissue levels of tNNAL were found in the lung, followed by the urinary bladder, kidneys, liver, and pancreas. The tissue levels of tNNAL were consistently higher in males compared to females, with the difference ranging from 1.4-fold in the lung to 4.6-fold in the liver at the High NNK dose.
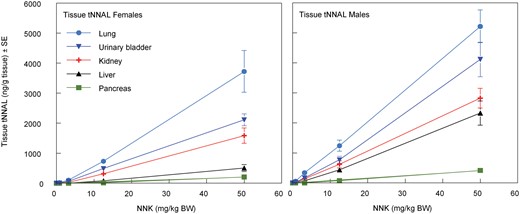
Tissue levels of tNNAL in female and male rats treated with NNK by nose-only inhalation for 14 days. Tissues were collected on day 15 for measurement of tNNK and tNNAL. The target NNK dose levels were 0 mg/kg BW (Vehicle Control), 0.8 mg/kg BW (Low), 3.2 mg/kg BW (Mid), 12.5 mg/kg BW (Mid High), and 50 mg/kg BW (High).
Only very low levels of tNNK (≤20 ng tNNK/g tissue) were detected in the tissues, typically at the High NNK dose, with no consistent pattern across the tissues (data not presented).
O6-methylguanine levels in liver and lung DNA
DNA was isolated from liver and lung collected on day 15 for measurement of O6-methylguanine.
O6-Methylguanine was not detected in liver DNA from the 2 lowest doses (Low and Mid) in either females or males. In female rats, O6-methylguanine increased in a linear manner at the 2 highest doses (Mid High and High), whereas at the High dose in males the increase was less than anticipated, perhaps due to saturation of metabolism and/or the induction of DNA repair (Figure 7).
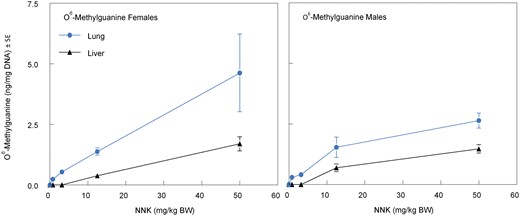
O6-Methylguanine in liver and lung DNA of female and male rats treated with NNK by nose-only inhalation for 14 days. Tissues were collected on day 15 for measurement of O6-methylguanine in liver and lung. The target NNK dose levels were 0 mg/kg BW (Vehicle Control), 0.8 mg/kg BW (Low), 3.2 mg/kg BW (Mid), 12.5 mg/kg BW (Mid High), and 50 mg/kg BW (High).
O6-Methylgaunine was detected in lung DNA of both sexes at all administered doses of NNK, and at higher levels than in the liver at each dose. In female rats, O6-methylguanine increased in a linear manner, whereas with male rats the pattern was similar to that observed in liver DNA with a decreased level of adduct formation being observed at the High dose (Figure 7).
DISCUSSION
This is the first repeat-dose toxicity study in a rodent species following nose-only inhalation exposure to NNK. A 14-day nose-only inhalation exposure to NNK in Sprague-Dawley rats resulted in multiple significant dose-related adverse effects in both sexes. Lung organ weights were significantly increased, and thymus organ weights were significantly decreased. Non-neoplastic microscopic findings were observed in both sexes. In the nose, these histopathologic findings included degeneration, regeneration, and necrosis of olfactory epithelium; atrophy of olfactory epithelial glands (Bowman’s glands); acute inflammation; depletion of goblet cells; degeneration, regeneration, and necrosis of transitional epithelium; and atrophy of sinus glands (Steno’s glands). In the larynx, squamous metaplasia and epithelial cellular alteration were observed. In the trachea, depletion of goblet cells occurred. In the lung, there was the regeneration of the bronchiolar respiratory epithelium. In the liver, centrilobular necrosis and centrilobular cellular infiltration of mononuclear cells were observed. There was atrophy in the thymus and ovary. Similar to previous reports (Belinsky et al., 1990; Hecht, 1998, 2003, 2006, 2008; IARC, 2007; Zheng and Takano, 2011), the present study results showed that the respiratory tract tissues were the primary target tissues of NNK toxicity, with liver, thymus, and ovary tissues secondary target tissues. No neoplasms were observed, but none were expected given the length of the study. Lastly, there were no NNK treatment-related deaths.
The most sensitive endpoint for the 14-day nose-only inhalation exposure to NNK in Sprague-Dawley rats was non-neoplastic histopathological lesions in the nose. A low incidence of goblet cell depletion in the nose was observed at the Low NNK dose (0.8 mg/kg BW), and a very high incidence in a number of lesions of the nose occurred in the Mid NNK dose group (3.2 mg/kg BW) and higher dose groups (12.5 and 50 mg/kg BW).
Our evaluation of exposure assessment biomarkers showed that plasma, urine, and tissue tNNK and tNNAL levels, and tissue DNA adduct O6-methylguanine levels increased in a dose-dependent manner in both sexes, at each observation time-point. The urinary levels of tNNAL were approximately 100-fold greater than the urinary levels of tNNK at each time-point, which is similar to other reports (Hecht, 2002; Morse et al., 1990; Yuan et al., 2009). Twenty-four hours after the last exposure, tNNK levels in the plasma and the major tissues had greatly diminished, but a considerable amount of tNNAL still remained in tissues, which is consistent with a past report (Castonguay et al., 1983). The tissue with the highest tNNAL levels for both sexes was the lung, followed by the urinary bladder, kidneys, liver, and pancreas. The tissue O6-methylguanine DNA adduct level was higher in the lung than that in the liver for both sexes. The results further confirm that the lung is the most critical target organ for NNK toxicity.
The repeat-dose scheme of the current protocol provided suitable timing for micronucleus analyses in both bone marrow and peripheral blood, conforming with the in vivo micronucleus assay recommendations given in OECD TG 474 (Organization for Economic Cooperation and Development, 2014). Further, the collection of bone marrow samples resulted in a consistent yield of %RETs, ranging from 30 to 50%, which was similar to the previous %RET values using the flow cytometric method that we employed (Fiedler et al., 2010). The results suggested that the subacute inhalation toxicity of NNK did not increase micronucleus frequencies in the peripheral blood or bone marrow erythrocytes of male or female rats.
NNK is a potent genotoxicant both in vitro and in vivo (von Pressentin et al., 1999, 2001). However, the genotoxicity of nitrosamines can be difficult to detect in in vivo hematopoietic micronucleus assays. Nitrosamines usually are metabolized to toxic derivatives in organs (eg, nose, lung, and liver) distant from the bone marrow (site of micronucleus induction in rat erythrocytes), and the toxic derivatives may not be transported efficiently to bone marrow due to their reactivity (Avlasevich et al., 2014; Shi et al., 2011). Thus, while genotoxicity at metabolic sites often is dictated by exposure routes, nitrosamines can be negative when measured in bone marrow or blood-based assays, such as the erythrocyte micronucleus assay (Narumi et al., 2012, 2013) or the erythrocyte Pig-a gene mutation assay (Mittelstaedt et al., 2019). With NNK, positive responses in the erythrocyte or bone marrow micronucleus assay, when they have been detected, used routes of exposure other than inhalation, and much higher test substance doses than employed here (eg, National Toxicology Program (NTP), 1989; Padma et al., 1989). Because of the limited bone marrow exposure associated with nose-only NNK dosing (Mittelstaedt et al., 2019), we conclude that the negative responses observed in this present study, in a hazard identification context, are “inconclusive.”
Haber’s Rule is often used in the risk assessment of toxic substances (Belkebir et al., 2011; Gaylor, 2000; Kramer et al., 1996; Malkiewicz et al., 2009). Haber’s Rule simply states that the severity of a toxic effect is dependent on the total exposure but independent of the duration time [ie, exposure concentration (c) rate times the duration time (t) of exposure (c × t = k) where k is a constant] (Haber, 1924). However, Haber’s Rule is not always predictive of actual results (Belkebir et al., 2011; Bunce and Remillard, 2003; Gardner et al., 1979; Weller et al., 1999). In the current study, with a number of endpoints (eg, certain hematology, clinical chemistry measurements, and organ weights), Haber’s Rule rats (ie, longer exposure to achieve the same dose) appeared to have more adverse effects than the main Toxicology rats (ie, 25% of the exposure time to achieve the same dose). The gross observation of a small thymus and its microscopic correlate of thymic atrophy was clearly more evident in the Haber’s Rule rats compared to the main Toxicology rats. Although 4-h exposure sham and vehicle control groups in the Haber Study could not be included due to space limitations in the inhalation system, a previous study by Werley et al. (2014) did not observe any negative effects for sham and similar vehicle control groups in a daily 4-h exposure, 14-day nose-only inhalation study in Sprague-Dawley rats. The results indicated that in the present study, Haber’s Rule is not applicable for either male or female rats, because under the same exposure dose of NNK, subacute inhalation exposure to a lower concentration of NNK aerosol for a longer time (4 h daily) caused greater adverse effects than exposure to a higher concentration of NNK aerosol for a shorter time (1 h daily). The deviation from Haber’s Rule suggests that the extent of subacute toxicity following NNK inhalation depends not only on the total dose but also on the specifics of exposure concentration and time (Hoyle et al., 2010). The results support the consideration of multiple exposure scenarios in the evaluation of tobacco product health risks.
Although the highest dose of 50 mg/kg BW used in this study exceeds human exposure to NNK from typical inhaled tobacco product use scenarios (Djordjevic et al., 2000; Grana et al., 2014; Moody, 1984), the 50 mg/kg BW dose was selected for range-finding purposes to determine dosing in the subsequent 90-day nose-only inhalation toxicity study of NNK in Sprague-Dawley rats (OECD, 2018). This 50 mg/kg BW dose was consistent with OECD 413 requirements regarding the maximum tolerated dose (OECD, 2018) and was also consistent with dosing in our recent study with NNK entitled “Toxicokinetic and Genotoxicity Study of NNK in Male Sprague-Dawley Rats Following Nose-Only Inhalation Exposure, Intraperitoneal Injection, and Oral Gavage” (Hu et al., 2021), as well as another NNK inhalation study (Pool-Zobel et al., 1992). Overall, the 50 mg/kg BW NNK exposure dose in this study demonstrated a clear dose-response relationship and resulted in definitive, non-lethal toxicity. As such, the 50 mg/kg BW dose provides critical information needed to understand the overall parameters of NNK inhalation toxicity in this novel repeated dose study. It is important to note that this information is necessary to understand NNK toxicity at more human-relevant doses.
In conclusion, this study assessed the subacute toxicity of NNK in Sprague-Dawley rats following a 14-day repeated nose-only inhalation exposure. The Lowest-Observed-Adverse-Effect-Level (LOAEL) for 14-day repeated dose inhalation toxicity study of NNK was 0.8 mg/kg BW/day or 0.03 mg/L air for 1 h/day for both sexes. Overall, the results of this study provide new insight in the evaluation of the adverse effects of NNK, including dose-response of NNK for respiratory and other target-organ toxicities, and inform the evaluation of health risks associated with NNK in tobacco products. Additionally, the results of the present study support the design for longer-term inhalation toxicity studies of NNK, such as a subchronic 90-day nose-only inhalation toxicity study of NNK in rats (OECD, 2018).
SUPPLEMENTARY DATA
Supplementary data are available at Toxicological Sciences online.
DECLARATION OF CONFLICTING INTERESTS
The authors declared no potential conflicts of interest with respect to the research, authorship, and/or publication of this article.
FUNDING
This work was supported by the funds from U.S. Food and Drug Administration (FDA)/Center for Tobacco Products (CTP).
Disclaimer: The findings and conclusions in this report are those of the authors and do not necessarily represent the official position of the Food and Drug Administration. The mention of trade names or specific manufacturers is for clarity of experiment methods and should not be considered as endorsement.
REFERENCES
IARC (International Agency for Research on Cancer). (
Litron (version 130712a) Instruction Manual for MicroFiowPLUS rat bone marrow micronucleus kit. Available at: http://www.litronlabs.com/manuals/ln_Vivo_Manuai_PLUSRBM_v130712.pdf.
Litron (version 130712b) Instruction Manual for MicroFiowPLUS rat peripheral blood micronucleus kit. Available at: http://www.litronlabs.com/manuals/ln Vivo Manual PLUS-U R v130712.pdf.
National Toxicology Program (NTP). (
OECD (Organization for Economic Cooperation and Development). (
OECD. (

Comments