


Abstract
Oxytetracycline (OTC) is a widely used antibiotic in food-producing animals. Extralabel use of OTC is common and may lead to violative residues in edible tissues. It is important to have a quantitative tool to predict scientifically based withdrawal intervals (WDIs) after extralabel use in food animals to ensure human food safety. This study focuses on developing a physiologically based pharmacokinetic (PBPK) model for OTC in sheep and goats. The model included 7 compartments: plasma, lung, liver, kidneys, muscle, fat, and rest of the body. The model was calibrated with serum and tissue (liver, muscle, kidney, and fat) concentration data following a single intramuscular (IM, 20 mg/kg) and/or intravenous (IV, 10 mg/kg) administration of a long-acting formulation in sheep and goats. The model was evaluated with independent datasets from Food Animal Residue Avoidance Databank (FARAD). Results showed that the model adequately simulated the calibration datasets with an overall estimated coefficient of determination (R2) of 0.95 and 0.92, respectively, for sheep and goat models and had acceptable accuracy for the evaluation datasets. Monte Carlo sampling technique was applied to predict the time needed for drug concentrations in edible tissues to fall below tolerances for the 99th percentiles of the population. The model was converted to a web-based interactive PBPK (iPBPK) interface to facilitate model applications. This iPBPK model provides a useful tool to estimate WDIs for OTC after extralabel use in small ruminants to ensure food safety and serves as a basis for extrapolation to other tetracycline drugs and other food animals.
Oxytetracycline (OTC) is a member of the tetracycline family of antibiotics and is widely used in animals and humans (Lin et al., 2015; Riviere and Papich, 2018). Tetracyclines are broad-spectrum antimicrobial agents, exhibiting activities against a wide range of gram-positive and gram-negative bacteria, atypical organisms, such as chlamydiae and mycoplasmas, rickettsiae, and protozoan parasites (Chopra and Roberts, 2001). Tetracyclines’ effectiveness in preventing protozoal infections and tick-borne intracellular pathogens has made them one of the most widely used drugs in both human and veterinary medicine (Lin et al., 2015; Yonar, 2012). Furthermore, in some countries, including the United States, tetracyclines were once added at subtherapeutic levels to animal feeds to act as growth promoters (Chopra and Roberts, 2001), a practice now prohibited due to the emergence of antimicrobial resistance. However, extralabel use of existing therapeutic drugs in the tetracycline family is permitted.
Among all drugs in the tetracycline family, OTC is the most commonly used (Yonar, 2012). In the United States, OTC is approved as a solution for use in water and as a veterinary feed directive (VFD) (alone or combined with neomycin) for sheep (10 mg/lb body weight daily for 7–14 days) as a treatment for bacterial enteritis caused by E. coli and bacterial pneumonia caused by P. multocida, as well as treatment and control of colibacillosis (bacterial enteritis) caused by E. coli (VetGRAM, 2021). However, it is not approved in goats in any form and use of VFDs extralabel is not permitted. The extralabel use of OTC in sheep and goats is considered legal provided that the requirements from the Animal Medicinal Drug Use Clarification Act of 1994 (AMDUCA) and Food and Drug Administration (FDA) are met. Injectable formulations of OTC approved for use in cattle and swine are commonly used in an extralabel manner following intravascular, intramuscular (IM), or subcutaneous injection in sheep and goats. Extended WDIs must be prescribed for extralabel use of OTC and will vary depending on the specific therapeutic regimens, particularly at higher dose rates. If an adequate, scientifically based WDI is not determined and adhered to, violative residues in edible tissues may occur. Furthermore, OTC can also potentially cause a range of toxic effects to multiple organ systems, especially kidneys and liver, creating adverse effects to the animals and safety concern of animal-derived food products to humans (Baynes et al., 2016; Moalli et al., 1996; Yonar, 2012). In recent years, violative residues of OTC in small ruminant species such as sheep and goats have become a significant food safety concern. From 2019 to 2020, approximately 25% of all inquiries submitted to the FARAD related to goats and sheep, and OTC was among the top drugs of concern based on internal data from FARAD’s Regional Call Centers. Therefore, pharmacokinetic tools that can be used to estimate extended WDIs of OTC in sheep and goats are urgently needed.
OTC's pharmacokinetic profile has been studied extensively in sheep and goats, mostly following IM and intravenous (IV) doses (Aktas and Yarsan, 2017; Craigmill et al., 2000; Escudero et al., 1994, 1996; Immelman and Dreyer, 1986; Manna et al., 1993; Neuschl et al., 2007; Nouws et al., 1990). OTC is metabolically inert, distributes throughout most tissues upon entering the body, and is excreted primarily via urine (Baggot et al., 1978; Craigmill, 2003; Lin et al., 2015; Martin-jimenez et al., 1997; Riviere and Papich, 2018). These pharmacokinetic studies provide a foundation for developing physiologically based pharmacokinetic (PBPK) models for OTC in sheep and goats. PBPK modeling is a mechanism-based process that mathematically expresses the absorption, distribution, metabolism, and excretion (ADME) of chemicals and/or their metabolites in the body (Andersen, 2003; Fisher et al., 2020; Lin et al., 2016; WHO, 2010). PBPK models can be used to predict chemical concentrations in the target tissues of interest and can be extrapolated across species and treatment regimens. Therefore, a PBPK model is an ideal tool to predict tissue residues and WDIs of OTC in sheep and goats following different therapeutic regimens to address the food safety concern due to its extralabel use.
PBPK models for OTC have been reported for dogs, humans (Lin et al., 2015), salmon (Brocklebank et al., 1997; Law, 1999), and food animals such as sheep (Craigmill, 2003) and cattle (Achenbach, 2000). The cattle and sheep models simulate the pharmacokinetics of OTC following a single IM injection with a long-acting formulation for an average animal in each species (Achenbach, 2000; Craigmill, 2003). Unlike laboratory rodents and humans in which PBPK models are well established for many chemicals, PBPK models for food-producing animal species, especially small ruminants, are rare. The currently available PBPK model for OTC in sheep is only for animals of average size which does not incorporate population variability; and no PBPK model for OTC is available in goats. Consideration of population variability is essential in the estimation of drug WDIs in any population of animals. Moreover, all existing PBPK models are published and presented as computer codes, often from now nonavailable proprietary software platforms, that are difficult to use by nonmodelers. To address the above-mentioned food safety concern and knowledge gaps, the objective of this project was to develop a web-based user-friendly iPBPK model for OTC in sheep and goats.
MATERIALS AND METHODS
Data source for the model
The Comparative Pharmacokinetic Database in FARAD, a USDA-supported initiative in veterinary medicine (Craigmill et al., 2006; Riviere et al., 1986, 2017), was used as the primary source of data for OTC sheep and goat model calibration and evaluation. Pharmacokinetic data in healthy market-age sheep and goats after IM and IV administration of a long-acting formulation were selected for model calibration and evaluation. A brief description and critical information of selected pharmacokinetic studies are summarized in Table 1. Pharmacokinetic data were either obtained from tables or extracted from graphics in selected studies using WebPlotDigitizer (Version 4.4, https://automeris.io/WebPlotDigitizer/, last accessed August 06, 2021).
Summary of Pharmacokinetic Studies of oxytetracycline in Sheep and Goats Used for Calibration and Evaluation of the PBPK Model
| Species/Purpose | Route | Sex | Number | BW (kg) | Dose (mg/kg) | Assay | Matrix | Source |
|---|---|---|---|---|---|---|---|---|
| Sheep | ||||||||
| Calibration | IM | M, F | 4–24 | 45.5–61.5 | 20 | QB | Plasma, liver, kidney, fat, muscle | Craigmill et al. (2000) |
| Evaluation | IV | M | 4 | NA | 10 | MM | Plasma | Immelman and Dreyer (1986) |
| IM | NA | 20 | 50–78 | 20 | QB | Kidney | Nouws et al. (1990) | |
| IM | NA | 6 | 51 | 20 | HPLC | Plasma | Neuschl et al. (2007) | |
| IM | F | 5 | 37.3–49.3 | 20 | HPLC | Plasma | Escudero et al. (1996) | |
| Goat | ||||||||
| Calibration | IM | F | 4–10 | >32 | 20 | HPLC | Fat, liver, kidney, muscle | Payne et al. (2002) |
| IM | NA | 8 | 14–25 | 20 | HPLC | Plasma | Turel et al. (2005) | |
| IV | F | 5 | 38–43 | 10 | HPLC | Plasma | Escudero et al. (1994) | |
| Evaluation | IM | F | 5 | 38–43 | 20 | HPLC | Plasma | Escudero et al. (1994) |
| IM | M | 7 | 20–40 | 20 | HPLC | Plasma | Aktas and Yarsan (2017) | |
| IV | NA | 8 | 14–25 | 20 | HPLC | Plasma | Turel et al. (2005) | |
| IV | F | 12 | 10.85–11.15 | 20 | Analytical method | Plasma | Manna et al. (1993) |
Notes: The abbreviations for routes: IM, intramuscular injection, IV, intravenous injection. HPLC, high-performance liquid chromatography; MM, microbiological methods; QB, quantitative bioassay. NA, not available or not applicable; M, Male; F, Female.
PBPK model structure
The PBPK model for OTC was developed based on the previous PBPK models for OTC in sheep (Craigmill, 2003), penicillin G in swine and cattle (Li et al., 2017; 2018), and the dog PBPK model for OTC (Lin et al., 2015). It is necessary to develop a new PBPK model for OTC in sheep because the previous model (Craigmill, 2003) only included a single route of exposure (ie, IM), was calibrated and evaluated with data from a single study (Craigmill et al., 2000), did not incorporate Monte Carlo simulations to account for population variability, and was developed using a legacy software program (ie, acslX) that was discontinued several years ago. All of these limitations have been addressed in the present model. Another difference is that the present model includes a lung compartment because it is the therapeutic target organ.
A schematic diagram of the present model is shown in Figure 1. The OTC PBPK model consisted of seven compartments corresponding to different tissues, including liver, kidney, muscle, fat, lung, the rest of the body, and the circulatory system. Compartments in the model were assumed to be flow limited and well stirred. All primary edible tissues, including liver, kidney, muscle, and fat were included since the model’s primary purpose is to estimate drug residues in edible tissues to ensure human food safety. According to the availability of the pharmacokinetic data, IM and IV administration routes were incorporated into the model. IV dosing was described with a single administration rate and directly added into the venous blood. The IV dosing rate was calculated using the dose (mg/kg) multiplied by body weight and then divided by the infusion period.

A schematic diagram of the physiologically based pharmacokinetic (PBPK) model for oxytetracycline in sheep and goats. Two different administration routes, including intramuscular (IM) and intravenous (IV) injections, are presented in the model. A 2-compartment fast/slow absorption model for the long-acting OTC formulation describes the IM injections. Parameters Kim, Fracim, and Kdissim are the absorption rate from the injection site (h−1), fractions of OTC readily available for fast absorption (unitless), and the transfer rate from slow to fast absorption site (h−1), respectively.
RinputIM is the administration rate of IM injection (mg/h); RDOSEimremain is the rate of change of the amount of OTC remaining in the slow release depot in the injection site (mg/h); DOSEimremain is the amount of dose remaining in the slow release depot (mg), RIM is the fast absorption rate in the IM administration site (mg/h); Absorbim is the amount of OTC absorbed and available in the venous blood from the administration site (mg/h); Fracim is the fraction of OTC immediately available for absorption (unitless); Kdissim is the release rate constant of OTC from the slow absorption depot to the fast absorption site (h−1); Rsite is rate of change of OTC in the administration site (mg/h).
Because OTC is excreted mainly via urine in mammals, including dogs, humans, and cattle (eg, total body clearance and renal elimination are virtually equal in cattle), a first-order urinary elimination rate was included in the kidney compartment (Craigmill, 2003).
Model parameters
The PBPK model requires 2 different types of parameters—physiological parameters for a specific species and chemical-specific parameters (Fisher et al., 2020; Jones and Rowland‐Yeo, 2013). Physiological parameters for sheep and goats were obtained from the review article by Li et al. (2021), where physiological parameters are reported from an extensive literature search for sheep and goats. These physiological parameters included mean body weight (BW), cardiac output (QCC), relative organ weights (ie, percent of body weight), and the fraction of blood flow to organs/tissues out of the cardiac output. The regional blood flow fractions in goats were assumed to be the same as sheep because goat-specific values were not available. Chemical-specific OTC parameters were collected from the dog PBPK model by Lin et al. (2015) and the sheep PBPK model by Craigmill (2003).
Model calibration
Due to the interspecies variability, some parameters such as the elimination rate constant (KUrineC), the absorption rate of OTC from the injection site (Kim), and the dissolution rate for the fraction of OTC reserved for the slow absorption of the long-acting formulation had to be estimated from the model. Therefore, the developed model was calibrated with serum and tissue data following a single IM dose at 20 mg/kg of a long-acting formulation (Liquamycin LA-200) for the sheep model. These serum and tissue data were collected from Craigmill et al. (2000). For the goat model calibration, plasma data following a 10-mg/kg IV dose and 20-mg/kg IM dose, and tissue data following a 20-mg/kg IM dose were used (Escudero et al., 1994; Payne et al., 2002; Turel et al., 2005). For parameters that were fitted with sheep and goat-specific datasets, the starting values were based on the values from the corresponding parameters in the previous dog and sheep models (Craigmill, 2003; Lin et al., 2015). The mean values of all physiological and chemical-specific parameters of the present PBPK model and the sources of the parameters or the approaches used to obtain the values are shown in Table 2.
Physiological and Chemical-Specific Parameters for the Present PBPK Model for Oxytetracycline in Sheep and Goats
| Parameters | Description | Distribution | Goats | Sheep | Unit | Source | ||
|---|---|---|---|---|---|---|---|---|
| Mean | SD | Mean | SD | |||||
| BW | Average bodyweight for market-age animals | Normal | 25.56 | 3.18 | 58.73 | 5.17 | kg | Li et al. (2021) |
| Cardiac output | ||||||||
| QCC | Cardiac output | Normal | 8.17 | 2.47 | 7.15 | 2.33 | l/(h * kg) | Li et al. (2021) |
| Blood flow fraction | ||||||||
| QLC | Fraction of flow to the liver | Normal | 0.3054 | 0.00445 | 0.3054 | 0.00445 | Unitless | Li et al. (2021) |
| QKC | Fraction of flow to the kidney | Normal | 0.1298 | 0.056 | 0.1298 | 0.056 | Unitless | Li et al. (2021) |
| QMC | Fraction of flow to the muscle | Normal | 0.1009 | 0.04206 | 0.1009 | 0.04206 | Unitless | Li et al. (2021) |
| QFC | Fraction of flow to the fat | Normal | 0.0618 | 0.01854 | 0.0618 | 0.01854 | Unitless | Li et al. (2021) |
| Fractional tissue volume | ||||||||
| VBloodC | Fractional volume of blood | Normal | 0.0529 | 0.01647 | 0.0486 | 0.01458 | Unitless | Li et al., (2021) |
| VLC | Fractional volume of liver | Normal | 0.0189 | 0.0029 | 0.0127 | 0.0024 | Unitless | Li et al. (2021) |
| VKC | Fractional volume of kidney | Normal | 0.0038 | 0.0006 | 0.0023 | 0.0003 | Unitless | Li et al. (2021) |
| VMC | Fractional volume of muscle | Normal | 0.3858 | 0.0318 | 0.2478 | 0.022 | Unitless | Li et al., (2021) |
| VFC | Fractional volume of fat | Normal | 0.0914 | 0.0182 | 0.2098 | 0.0268 | Unitless | Li et al. (2021) |
| VLuC | Fractional volume of lung | Normal | 0.0122 | 0.0023 | 0.0107 | 0.0024 | Unitless | Li et al. (2021) |
| VabC | Fractional volume of arterial blood | Normal | 0.0129 | 0.0039528 | 0.0116 | 0.0110808 | Unitless | Li et al. (2021) |
| VvbC | Fractional volume of venous blood | Normal | 0.0402 | 0.0125172 | 0.03693 | 0.0034992 | Unitless | Li et al. (2021) |
| Absorption | ||||||||
| Kim | IM absorption rate constant | Log normal | 0.433 | 0.12975 | 0.159 | 0.04761 | Per hour | Fitted |
| Fracim | IM dose for the fast absorption phase | Log normal | 0.5 | 0.05 | 0.5 | 0.05 | Unitless | Lin et al. (2015) |
| Kdissim | Dissolution rate constant | Log normal | 0.011 | 0.003 | 0.017 | 0.005127 | Per hour | Fitted |
| Elimination | ||||||||
| KUrineC | Urinary elimination rate constant | Log normal | 0.173 | 0.05175 | 0.0999 | 0.0299871 | l/(h * kg) | Fitted |
| Partition coefficients | ||||||||
| PK | Kidney-plasma | Log normal | 4.746 | 0.94916 | 4.746 | 0.94916 | Unitless | Lin et al. (2015) |
| PLu | Lung-plasma | Log normal | 1.897 | 0.37934 | 1.897 | 0.37934 | Unitless | Assumed similar to liver |
| PL | Liver-plasma | Log normal | 1.897 | 0.37934 | 1.897 | 0.37934 | Unitless | Craigmill (2003) |
| PM | Muscle-plasma | Log normal | 0.851 | 0.170194 | 0.851 | 0.170194 | Unitless | Craigmill (2003) |
| PF | Fat-plasma | Log normal | 0.085 | 0.01706 | 0.085 | 0.01706 | Unitless | Craigmill (2003) |
| PRest | Rest-plasma | Log normal | 0.851 | 0.170194 | 0.851 | 0.170194 | Unitless | Assumed similar to muscle |
Notes: The lower and upper limit for each parameter is assumed as 2.5th percentile and 97.5th percentile of the corresponding distribution, respectively. The standard deviation for each parameter (if not available from literature) is calculated Standard deviation= Coefficient of variation * Mean. The coefficient of variation (COV) values are as follows: COVPhysiological = 30%, COVChemical-specific dissolution and fraction = 10%, COVPartition coefficients = 20%, COVOther chemical specific = 30%.
Model evaluation and sensitivity analysis
The model performance was evaluated upon calibration by comparing simulation results with data not used during calibration (Table 1). Calibration and evaluation datasets were from different experimental studies; hence there might be variability among datasets due to the difference in experimental conditions (eg, different experimental animal subjects, laboratories, and detection methods). The PBPK model guidelines from World Health Organization (WHO) were followed during model evaluation to account for this interexperimental variability among datasets (WHO, 2010). According to WHO PBPK guidelines, a model can be considered acceptable if simulated chemical concentrations are generally within 2-fold of the measured values and the simulated kinetic profiles capture the observed kinetic profiles in plasma and tissues (WHO, 2010). The goodness of fit between observed and predicted plasma and tissue concentrations was further analyzed with linear regression.
In equation 7, the original value of the parameter of interest is par, while Δpar is 1% of the original value of the parameter of interest; the response variable (ie, AUC) is indicated as var, and Δvar is the change in the response variable value resulting from Δpar in the parameter value. The parameter sensitivities are categorized as follows: |NSC| < 0.2; medium: 0.2 ≤ |NSC| < 0.5; high: 0.5 ≤ |NSC| (Li et al., 2017; Lin et al., 2013).
Model application: Monte Carlo analysis and withdrawal interval estimation
Monte Carlo simulations are a widely employed method in mathematical/mechanistic models to extrapolate from individual- to population-level data or quantify the uncertainty in the simulation results due to population variability (Buur et al., 2008; Henri et al., 2017; Li et al., 2017, 2018; Yang et al., 2019). Our model was calibrated and validated for average values of each of the parameters. However, there are some variabilities in these parameters in practical scenarios due to physiological and chemical response differences between animals (Fisher et al., 2020). Therefore, Monte Carlo simulation was applied in the current PBPK model to estimate the effects of parameter uncertainty and intraspecies variability of sheep and goats on model simulations. One thousand iterations were performed for each scenario to assess the variability in pharmacokinetics following drug administration. Log-normal distributions were assumed for chemical-specific parameters, such as IM absorption rate, dissolution rate, urinary elimination rate, and partition coefficients. Physiological parameters, including body weights, cardiac outputs, and fractions of blood flows and tissue volumes were assumed to be normally distributed. The distribution types for physiological and chemical-specific parameters were chosen according to previously published population PBPK models in humans, cattle, grass carp, and swine (Li et al., 2018; Shankaran et al., 2013; Tan et al., 2006; Xu et al., 2020; Zeng et al., 2017).
For the distribution of model parameters, the standard deviations of physiological parameters were collected from Li et al. (2021) for both species. However, when standard deviations for physiological parameters were not available in the literature, a 30% coefficient of variation (COV) was used to calculate the respective parameter’s standard deviation. For chemical-specific parameters, their COVs were assigned as 10% for dissolution rate and fractions of available chemical for fast absorption, 20% for partition coefficients, and 30% for other chemical-specific parameters, such as absorption and elimination rate constants. These COV values were selected based on reported Monte Carlo simulation approaches that have been used and well-accepted in the field of PBPK modeling (Clewell and Clewell, 2008; Henri et al., 2017; Li et al., 2017; Tan et al., 2006; Yang et al., 2015, 2019).
The relation between the standard deviation and the coefficient of the variation for a known mean value is: Standard deviation = Coefficient of variation * Mean
To ensure the biological plausibility of randomly selected parameters, each parameter's 2.5th and 97.5th percentiles were calculated as the upper and lower bounds. The values and distributions of parameters used in the Monte Carlo simulations are provided in Table 2.
Initially, the “desolve” R package was used for calibration and validation, which required longer simulation times for multiple simulations with smaller integration steps (Baron et al., 2021; Soetaert et al., 2010). Therefore, the code was also adapted to be used with the “mrgsolve” package for improved computational efficiency for Monte Carlo simulations (Baron et al., 2021; Li et al., 2019).
Three different therapeutic scenarios (ie, 10, 20, or 40 mg/kg single IM dose) were analyzed using Monte Carlo simulations for both species. These therapeutic scenarios were chosen as they were commonly used extralabel dose regimens based on internal WDI inquiry data from FARAD Regional Call Centers regarding OTC use in sheep and goats from 2019 to 2020. For each therapeutic regimen, the simulation was run with 1000 iterations. The median, 1st and 99th percentiles of OTC concentrations in plasma and edible tissues were calculated and plotted and compared to the FDA-approved tolerances of OTC for sheep matrices, which are 6, 12, and 2 mg/kg or ppm in liver, kidney, and muscle, respectively. The tolerances of OTC for goat matrices have not been established as there are no FDA-approved OTC products for goats. Therefore, the lowest limit of detection (LOD) of 0.01 ppm for OTC in plasma and tissues from recent studies was chosen as an operational tolerance (Aktas and Yarsan, 2017; Mileva et al., 2020; Poapolathep et al., 2020). The Monte Carlo simulation results for the fat/adipose tissue were not included in this manuscript as the tolerance for fat is the same as for kidney (ie, 12 mg/kg or ppm), but the OTC concentrations in fat were substantially lower than in kidney (more than 10-fold) (Craigmill et al., 2000) and the PBPK model-simulated OTC concentrations were much lower than its tolerance throughout the simulation period based on the dosing regimens used in our study. A drug’s estimated WDI in a particular tissue of a species was determined when the drug’s simulated concentration was lower than the tolerance or LOD in a specific tissue for the 99th percentile of the simulated population from the PBPK model.
We also compared the Monte Carlo simulation results assuming sheep and goats have the same tolerance in similar edible tissues to investigate interspecies variability in the pharmacokinetics, tissue distribution and the estimated WDIs between sheep and goats. Additionally, we applied the model to estimate WDIs based on the label use and maximum residue limits (MRLs) from Australia and New Zealand. These countries were selected as a representative application of the model to predict WDIs based on other countries’ regulatory standards because the same marker residue for OTC (ie, the parent drug) is used in these countries.
Development of a web-based interactive physiologically based pharmacokinetic interface
The final PBPK model was converted to a web-based iPBPK interface to provide a user-friendly interactive tool that allows FARAD responders, nonmodelers, and other users to apply the PBPK models to predict OTC WDIs in sheep and goats. The web interface was developed based on our recently reported iPBPK interfaces for penicillin G and flunixin (Li et al., 2019; Lin et al., 2020). For this web-based iPBPK interface, the code developed for the “mrgsolve” package was used to increase the computational speed so that the WDI estimate can be obtained in real time.
RESULTS
Model Calibration
Simulated OTC concentrations in plasma and tissues in sheep and goats were compared with the experimental pharmacokinetic data in Figure 2. For sheep, the model-predicted OTC concentrations in plasma and edible tissues after a single IM dose of a long-acting formulation at 20 mg/kg corresponded well with the observed data in Craigmill et al. (2000), with the exception of a slight overestimation (within 1.5-fold) at the last two time points in liver and kidney (Figs. 2A–E). The determination coefficient of the overall regression analysis between model-predicted and observed plasma and tissue concentration data was R2 = 0.95, indicating a high goodness of fit (Figure 2F).
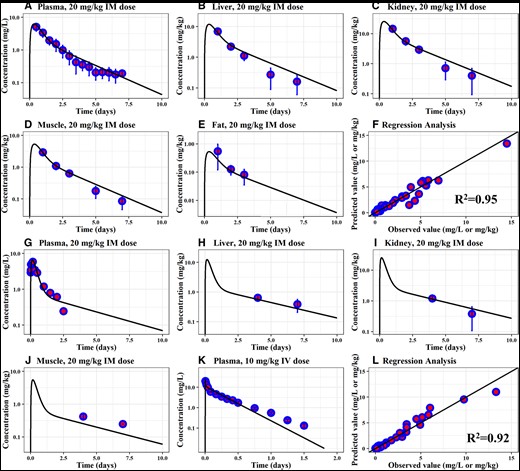
Calibration of the PBPK model for OTC in sheep and goats. Comparison of model predictions (solid line) and observed data (blue circles) for concentrations of OTC in the plasma (A), liver (B), kidney (C), muscle (D), and fat (E) of sheep exposed to a long-acting OTC formulation at 20 mg/kg IM dose, and in the plasma (G), liver (H), kidney (I), and muscle (J) of goats exposed to a long-acting OTC formulation at 20 mg/kg IM dose. Panel (K) expresses comparisons between simulation results and observed data following a single IV dose at 10 mg/kg in goats. Panels (F) and (L) show the regression analysis results and the goodness of fit for sheep (R2 = 0.95) and goats (R2 = 0.92). Observed data for panels (A–F) in sheep are collected from Craigmill (2003), panels (G), (H-J), and (K) from Turel et al. (2005), Payne et al. (2002), and Escudero et al. (1994), respectively. Abbreviations: IM, intramuscular; IV, intravenous; PBPK, physiologically based pharmacokinetic; OTC, oxytetracycline; R2, determination coefficient.
Similar comparisons were made between OTC concentrations from the goat model and experimental data following a 20-mg/kg single IM dose from Turel et al. (2005) (Figure 2G) and Payne et al. (2002) (Figs. 2H–J). The experimental data following a 10-mg/kg IV dose from Escudero et al. (1994) is presented with the simulation results in Figure 2K. The goat model adequately captured the observed kinetic profiles in the plasma and tissue, except a slight underestimation of the concentrations in the muscle. The overall regression analysis between model-predicted and observed plasma and tissue data showed a determination coefficient of R2 = 0.92, indicating a high goodness of fit.
Model Evaluation
Measured concentrations of OTC in plasma (Figs. 3A and 3B) and kidneys (Figure 3C) of sheep after a single IM injection of 20 mg/kg (Escudero et al., 1996; Neuschl et al., 2007) and in plasma after a single IV dose of 10 mg/kg (Immelman and Dreyer, 1986) (Figure 3D) were compared with model predictions. As the sheep model was calibrated using the IM data, the model overpredicted the plasma concentration following IV dose (Figure 3D). However, according to WHO guidelines for the PBPK model, the predictions are within the acceptable range (2-fold of the experimental data) (WHO, 2010). Overall, the model adequately predicted OTC concentration in plasma and kidneys at different time points.
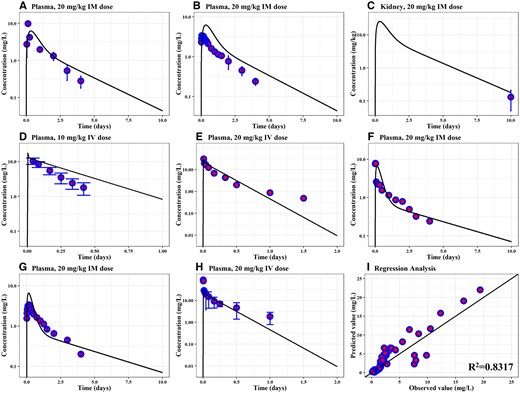
Evaluation and regression analysis results of the sheep and goat's PBPK model for OTC. Comparison of model predictions (solid line) and observed data (blue circles) for concentrations of OTC in the plasma and kidney of sheep exposed to a long-acting OTC formulation via IM injection at 20 mg/kg (A–C) or IV injection at 10 mg/kg (D) are shown. The plasma concentrations in goats exposed to a single IV dose of 20 mg/kg (E, H) and a single IM dose of 20 mg/kg (F, G) are also shown. Panel (I) represents the overall regression analysis result for both sheep's and goat's model-simulated and measured OTC concentrations (R2 = 0.8317). Experimental data for the validation of sheep models were collected from Neuschl et al. (2007), Escudero et al. (1996), Nouws et al. (1990), and Immelman and Dreyer (1986), and shown with the circles in panels (A-D), respectively. Goats measured concentrations in plasma shown in panels (E-H) were collected from Turel et al. (2005), Aktas and Yarsan (2017), Escudero et al. (1994), and Manna et al. (1993), respectively. Abbreviations: IM, intramuscular; IV, intravenous; PBPK, physiologically based pharmacokinetic; OTC, oxytetracycline; R2, determination coefficient.
Available plasma concentration data following single IV and IM doses were used for evaluation of the goat model. The model showed acceptable consistency in predicting plasma concentrations in goats exposed to a single IV dose (20 mg/kg, Figs. 3E and 3H) (Manna et al., 1993; Turel et al., 2005) and a single IM dose (Figs. 3F and 3G) (Aktas and Yarsan, 2017; Escudero et al., 1994). The goodness of fit was evaluated using the coefficient of determination (R2). The combined value of R2 between measured and simulated OTC concentrations in kidney and plasma was 0.8317 for the developed PBPK model in sheep and goats (Figure 3I).
Parameter Sensitivity
A local sensitivity analysis was performed for 24 model parameters and both species. The NSC values are shown in Supplementary Table 1 of the Supplementary Data. Only parameters with the absolute values of NSCs more than 0.1 for at least one dose metric are presented in Supplementary Table 1. The results showed that parameter sensitivities were similar between the sheep and goat models. For both sheep and goat PBPK models, the AUCs of all tissues were highly sensitive to the urine elimination rate constant (KUrineC) and their respective partition coefficients. The selected AUCs from both sheep and goat models had a relatively low sensitivity to the dissolution rate constants (Kdissim). The absorption rate constant (Kim) had a medium impact on the selected dose metrics in sheep, but had a relatively low impact on the selected dose metrics in goats (the absolute values of NSCs were less than 0.1 and not shown in Supplementary Table 1).
Model Application: Monte Carlo Analysis and Withdrawal Interval Estimation
Figures 4 and 5 show the Monte Carlo simulation results for the liver, kidney, and muscle concentrations of OTC with median, 1st and 99th percentiles for sheep and goats. The confidence bands of the sheep results in Figure 4 were wider than those of goats in Figure 5 because the model-simulated duration in goats was longer than in sheep (eg, 20 vs 7 days). The red vertical lines demonstrate the time intervals taken for each tissue’s concentration to fall below the respective tolerance or LOD level. Figure 4 shows that the concentration of OTC depleted the slowest in the kidney while staying above the tolerance in muscle for the longest time for sheep among all edible tissues (FDA, 2021). Therefore, muscle tissue residue depletion profiles were chosen to determine the WDIs. The WDIs in sheep were estimated to be 2, 4, and 5 days for single IM dose levels of 10, 20, and 40 mg/kg, respectively.
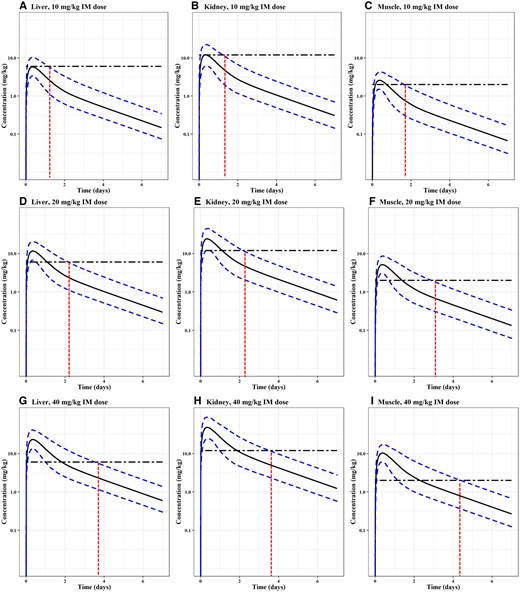
Monte Carlo simulation results for OTC concentrations in sheep. Commonly used extralabel doses (single IM dose at 10, 20, and 40 mg/kg) were simulated. Each of the simulations was run for 1000 iterations. The median, 1th and 99th percentiles of simulated results were plotted. Monte Carlo analysis results in the liver, kidney, and muscle are shown in Panels A-C for 10 mg/kg, D-F for 20 mg/kg, and G-I for 40 mg/kg. Tolerance (TOL) of OTC in the liver (6 mg/kg), kidney (12 mg/kg), and muscle (2 mg/kg) of sheep are shown on the corresponding tissue panel using a horizontal broken line. The intersection between the x-axis and the red vertical line indicates the time taken for that specific tissue's OTC concentration to go below the tolerance for the 99th of the simulated 1,000 animal population.
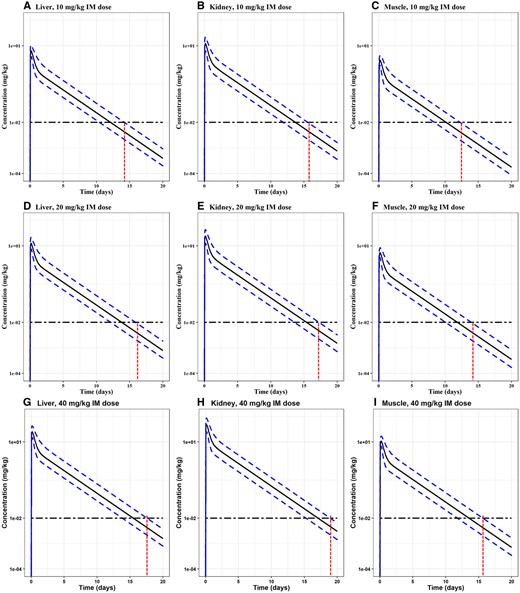
Monte Carlo simulation results for OTC concentrations in goats. Commonly used extralabel doses (single IM dose at 10, 20, and 40 mg/kg) were simulated. Each of the simulations was run for 1000 iterations. The median, 1th and 99th percentiles of simulated results were plotted. Monte Carlo analysis results in the liver, kidney, and muscle are shown in Panels A-C for 10 mg/kg, D-F for 20 mg/kg, and G-I for 40 mg/kg. We presented a horizontal line along the limit of detection (LOD) 0.01 ppm for goats. The intersection between the x-axis and the red vertical line shows the time taken for that specific tissue's OTC concentration to go below the LOD for the 99th of the simulated 1000 animal population.
The use of OTC in goats is extralabel in the United States, and therefore no tolerance is present. However, the United States Department of Agriculture (USDA) reported the minimum level of applicability of 0.5 μg/g or ppm for kidney screening of OTC (USDA, 2020). In recent studies, Poapolathep et al. (2020) reported a LOD of 0.01 μg/ml or ppm, and the limit of quantification (LOQ) of 0.05 μg/ml for OTC in goats. Aktas and Yarsan (2017) also reported LOD as 0.0125 μg/ml. Therefore, we used the lowest LOD of 0.01 μg/ml or mg/kg or ppm from Poapolathep et al. (2020) as the operational tolerance for goats. Figure 5 shows the Monte Carlo simulation results for goats for after single IM injection at 10, 20, and 40 mg/kg. The results showed that OTC residue stayed above the LOD in the kidney the longest time for goats. The results showed that it took 15, 16, and 12 days for OTC to deplete to be below the LOD in the liver, kidney, and muscle in goats after a single IM injection at 10 mg/kg; and it took 17, 17, and 14 days if the dose was 20 mg/kg; and 18, 19, and 16 days if the dose was 40 mg/kg. Therefore, the WDIs were 16, 17, and 19 days for 10, 20, and 40 mg/kg doses, respectively. The PBPK model-simulated WDIs for OTC in each tissue for each species after different dosing regimens are also summarized in Table 3.
The PBPK-Simulated WDIs in Sheep and Goats After a Single Intramuscular Injection of Different Extralabel Doses Based on Different Tolerance Standards
| Species | Dose (mg/kg) | Different Tolerance | Same Tolerance | ||||
|---|---|---|---|---|---|---|---|
| WDI (days) | WDI (days) | ||||||
| Liver | Kidney | Muscle | Liver | Kidney | Muscle | ||
| Sheep | 10 | 2 | 2 | 2 | 2 | 2 | 2 |
| 20 | 3 | 3 | 4 | 3 | 3 | 4 | |
| 40 | 4 | 4 | 5 | 4 | 4 | 5 | |
| Goats | 10 | 15 | 16 | 12 | 1 | 1 | 1 |
| 20 | 17 | 17 | 14 | 2 | 2 | 2 | |
| 40 | 18 | 19 | 16 | 3 | 2 | 3 | |
Notes: In the “Different Tolerance” column, the WDI results were based on the tolerances for sheep (6, 12, and 2 mg/kg or ppm in liver, kidney, and muscle, respectively) in the U.S, and based on the lowest limit of detection (LOD) of 0.01 mg/kg or ppm for all tissues in goats. In the “Same Tolerance” column, the results were based on the assumption that goats had the same tolerance as sheep for each tissue.
Figures 4 and 5 show the simulation results for the population PBPK model code within the “mrgsolve” package, which was the model code used in the final iPBPK interface. Simulations for the population PBPK model developed were also performed using the “desolve” package. The simulation results from the “desolve” package, especially in the terminal stages, were slightly different from the “mrgsolve” code, as shown in Supplementary Figures 1 and 2 for sheep and goats, respectively.
We performed a comparison to investigate the interspecies difference in the pharmacokinetics and tissue distribution of OTC between sheep and goats by estimating the maximum concentration (Cmax) and the AUC for 24, 72, and 168 h after a single IM dose at 20 mg/kg using the model based on average parameter values in each species. The results are shown in Table 4. From Cmax values in Table 4, the values were either similar or slightly higher for goats than sheep for plasma and selected tissues. However, the AUC values in sheep were ∼1.5–2-fold higher than in goats for the corresponding tissues. These smaller values of the Cmax and the higher values of the AUCs demonstrated the slower tissue depletion profiles in sheep than goats.
The Maximum Concentration and Area-Under-the-Curve of Oxytetracycline After the Administration of a Single 20 mg/kg Intramuscular Dose Estimated From the PBPK Models Based Average Parameter Values in Sheep and Goats
| Cmax (mg/l or mg/kg) | 24-h AUC (mg/l * h or mg/kg * h) | 72-h AUC (mg/l * h or mg/kg * h) | 168-h AUC (mg/l * h or mg/kg * h) | |||||
|---|---|---|---|---|---|---|---|---|
| Species | Sheep | Goats | Sheep | Goats | Sheep | Goats | Sheep | Goats |
| Tissue plasma | 6.277 | 6.606 | 115.913 | 79.324 | 188.152 | 104.630 | 224.313 | 127.885 |
| Kidney | 25.575 | 25.466 | 471.956 | 305.733 | 766.488 | 403.353 | 913.867 | 493.031 |
| Muscle | 5.334 | 5.551 | 97.345 | 67.028 | 159.817 | 88.857 | 190.833 | 108.760 |
| Fat | 0.534 | 0.561 | 9.833 | 6.740 | 15.988 | 8.893 | 19.066 | 10.870 |
| Liver | 11.908 | 12.530 | 219.743 | 150.431 | 356.891 | 198.465 | 425.516 | 242.590 |
Notes: Cmax = Maximum concentration of oxytetracycline; 24-h AUC, 72-h AUC, and 168-h AUC represent the AUCs for 24, 72, and 168 h after a single intramuscular administration at 20 mg/kg, respectively.
We also performed a comparison between estimated WDIs, assuming the exact same tolerances for goats as in sheep (Table 3 and Supplementary Figure 3). The Monte Carlo simulation results in muscle following 10, 20, and 40 mg/kg IM doses in sheep and goats are plotted in Supplementary Figure 3. The results showed that it took 2, 4, and 5 days for OTC to deplete to be below the tolerance in muscle (2 ppm) in sheep after a single IM injection at 10, 20, and 40 mg/kg, respectively. It took 1, 2, and 3 days for goats for the corresponding doses. When the estimated WDI was a fraction of a day, it was rounded up to the next whole day. From these estimated WDIs for the same dosing regimens, sheep had higher WDIs if the tolerances were the same due to slower tissue depletion profiles.
Additionally, Monte Carlo simulations were performed for 30 mg/kg IM dose according to Antimicrobial Prescribing Guidelines for Sheep from Australian Veterinary Association (AVA, 2021; FSANZ, 2021). Australia and New Zealand have the same MRLs for sheep and goats, which are 0.6, 0.3, and 0.1 mg/kg or ppm in kidney, liver, and muscle, respectively (FSANZ, 2021). The simulation results following a single 30 mg/kg IM dose in sheep and goats with corresponding MRLs in liver, kidney, and muscle is shown in Supplementary Figure 4. The results showed that it took 11 days (after rounding up to the next whole day) for OTC to deplete to be below the MRLs in sheep after a 30 mg/kg single IM injection. It took 9, 8, and 10 days for OTC concentration to deplete below the MRL in the goat’s liver, kidney, and muscle. Therefore, the WDI was 11 and 10 days in sheep and goats, respectively.
Web Interface (iPBPK)
Figure 6 shows a screenshot of the developed iPBPK framework to estimate extralabel WDIs for sheep and goats. The iPBPK interface was designed in RShiny and was published online at the following link: https://pbpk.shinyapps.io/OTC_App/. The iPBPK interface can take the user parameter values and run 1000 iterations to provide OTC concentrations in plasma, muscle, liver, kidney, and fat for different dosing regimens. It also allows the user to download a detailed report of their simulations, which provides the WDIs for the selected set of parameters and dosing regimens in the chosen species.
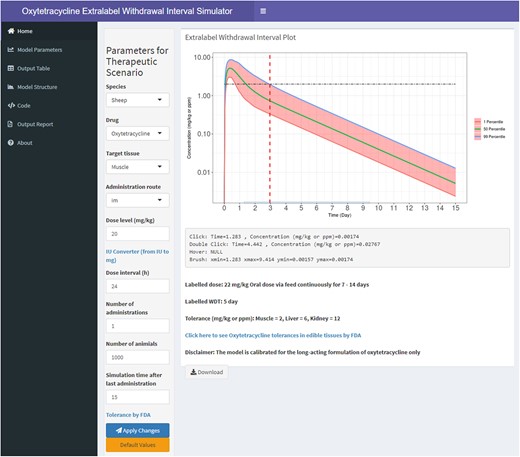
A screenshot of the developed web-based interactive physiologically based pharmacokinetic (iPBPK) interface for oxytetracycline (OTC) in sheep and goats. This iPBPK interface is also termed extralabel withdrawal interval simulator.
The interactive Extralabel WDI plot allows the user to find the exact time when the concentration depletes below the tolerance in a specific tissue. Users can find the concentration and the time to reach that concentration when the cursor is either hovered, clicked, double-clicked on a particular point on the plot. To identify the time to arrive at a specific concentration, the brush tool is handy as it shows the range of values for both time and concentrations.
DISCUSSION
A step-by-step work flow starting with collection of relevant data to development of a user-friendly iPBPK interface for a specific drug was demonstrated in this work. A comprehensive PBPK model for OTC in sheep and goats with IV and IM administration was developed to exemplify the resulting framework. The model predicted tissue residues of OTC in plasma and edible tissues with adequate accuracy, an encouraging result considering the diversity of the data used to define and validate the model. A population PBPK model was developed to account for each species’ variability in physiology and pharmacokinetics of the drug. The Monte Carlo simulations were performed with 1000 iterations, enabling this PBPK model to predict the tissue residues and estimate extralabel WDIs in sheep and goats. The developed web iPBPK interface, a user-friendly interface to estimate OTC’s WDIs in sheep and goats, can be used with little to no modeling or coding aptitude. This modeling framework can be extrapolated to other food animal species or other specific drugs. This new modeling framework significantly advances the current state of PBPK models in small ruminant species and the broader field of food safety and toxicology. This method and the web interface also improve the PBPK modeling approach in WDI estimation for small ruminant species. While this framework has some limitations, it lays a foundation to facilitate moving drug withdrawal time estimation from empirical methods to data-based mechanistic PBPK approaches, which are now user friendly and able to be utilized in real-time.
PBPK models have advantages over traditional pharmacokinetic methods in predicting tissue residues and WDIs for veterinary drugs as they are based on the physiological considerations of modeled drugs. PBPK model compartments have a physiological and biological rationale, wherein the traditional pharmacokinetic model compartments are an abstract concept. With the incorporation of physiological parameter variability in the population PBPK model, the pharmacokinetic profiles within a group of subjects can be attained. The variability in the chemical-specific parameters expresses the stochasticity in drug response from one subject to another. Therefore, the population PBPK model developed for OTC is a useful tool to extrapolate the model from individual animals to a group of animals. Compared to traditional pharmacokinetic methods, PBPK models are a relatively refined tool, but require more data and resources to develop. Although the current PBPK model was developed based on the previous PBPK model for sheep (Craigmill, 2003), it has several improvements including multiple administration routes, and the use of much more diverse datasets for calibration and validation than were available for the earlier model. Another advantage of a PBPK model is its adaptability to the newly available data related to the ADME process to reduce uncertainty in the tissue residue predictions.
This model is the first PBPK model for OTC in goats. The goat model has been extensively calibrated and validated with plasma and edible tissue concentration data following IV and IM administrations. OTC is not labeled to be used in goats in the United States. However, there were numerous calls to FARAD about the extralabel use of OTC in goats via IM and SC routes. Despite being labeled to be used as a medicated feed, OTC is mostly used via the IM and SC routes in sheep. However, due to unavailability of the SC administration data in any of the species, our model is not calibrated for SC administration routes. Therefore, this model and the web interface provide a useful tool for estimating the extralabel WDI estimation in sheep and goats following IV or IM administration. The SC absorption of long-acting formulations can be more variable and WDIs estimated from this model would not be appropriate. If SC administration of OTC is necessary for a particular case, veterinarians are encouraged to contact FARAD for a proper WDI recommendation using other methods. In the future, once pharmacokinetic data after SC administration are available, the present model can be readily extended to include the SC route.
In the previous PBPK models for OTC in dogs (Lin et al., 2015) and fish (Brocklebank et al., 1997; Law, 1999), tissue compartments were modeled as flow limited for richly perfused tissues and permeability limited for slowly perfused tissues. However, a flow-limited model for OTC has been used for sheep and goats in this study according to the previous OTC PBPK models in sheep and cattle (Achenbach, 2000; Craigmill, 2003). This model approach adequately captured the pharmacokinetics of OTC in the plasma and tissues, avoided complexity and thus reduced uncertainty in the model compared to the permeability-limited structure. Therefore, a flow-limited model structure was considered sufficient for the OTC PBPK model in goats and sheep.
In recent times, some drugs have been formulated in such a way that they can ensure prolonged drug exposure. For example, OTC, fluphenazine, haloperidol, and risperidone have been reformulated to have both conventional and long-acting formulations. The long-acting formulation produces a different pharmacokinetic profile compared with conventional formulations. In this study, a two-compartmental mechanistic absorption method (Leavens et al., 2012; Lin et al., 2015) was used to describe this prolonged absorption and exposure mechanism, and the model adequately simulated available data.
Based on the model simulation results, OTC concentrations in the kidney reached the highest concentration among all other edible tissues in both species (Figs. 4 and 5). Therefore, kidney is most likely the target tissue for the basis for the withdrawal period, and it is the case for cattle and swine (FDA, 2003). However, due to the high tolerance of OTC in the kidney, the kidney concentration fell below the tolerance level more rapidly than the muscle concentration in sheep (Figs. 4 and 5), making the muscle the most appropriate target tissue for determining a WDI. The label use of OTC was obtained from FDA, and the withdrawal periods were obtained from the Veterinarian's Guide to Residue Avoidance Management (VetGRAM) of FARAD (VetGRAM, 2021). OTC is FDA approved for sheep at 10 mg/lb body weight as a medicated feed (VFD) or water for 7–14 days in the United States with a 5-day withdrawal time (FDA, 2021; VetGRAM, 2021). OTC administration using any other route (IM, IV, or SC) and any use in goats are extralabel. Due to the lack of OTC pharmacokinetic data following oral administration in either species, this model was developed for extralabel parenteral uses only. Comparing the pharmacokinetic profiles between 2 species, a faster plasma elimination and tissue residue depletion was observed in goats compared to sheep (Figs. 2 and 3 and Supplementary Figure 3).
Depending on the value of the tolerances or MRLs, the WDIs vary greatly. European Union (EU), Australia, and New Zealand have the same MRLs for edible tissues in sheep. These values are smaller compared to the tolerances in the United States (AVA, 2021; EMA, 2021; Fletouris and Papapanagiotou, 2009; FSANZ, 2021). In Australia and New Zealand, goats also have the same MRLs as sheep. However, the marker residue in EU is the sum of OTC and 4-epi-oxytetracycline (4-epi-OTC), while we considered only OTC as the marker residue in our model. Australia and New Zealand have the marker residue like our model. Monte Carlo simulations were performed to compare estimated WDIs between these 2 species (Supplementary Figure 4) based on the MRLs in these countries. The calculated WDIs were smaller than the suggested value (28 days) by the Antimicrobial Prescribing Guidelines for Sheep for Australia and New Zealand (AVA, 2021). This difference can be attributed to different methods used in the calculation of the WDI and different drug formulations. Nevertheless, our results suggest that the currently suggested withdrawal period of 28 days in Australia and New Zealand is conservative enough.
In practice, the present PBPK-derived WDI recommendations can be directly used to answer calls related to OTC in goats. However, for sheep, since OTC has a label withdrawal period of 5 days following oral administration in sheep, any extralabel use would require an extended WDI based on the requirements of AMDUCA, such as the label withdrawal period of 5 days plus 1 day (ie, 6 days) in sheep. In this regard, our PBPK-derived results suggest that following IM or IV administration of the commonly used dose levels of OTC in sheep, the tissue residue concentration would be below the tolerances by the extended WDI of 6 days. In addition, for the same active ingredient, different formulations may have different withdrawal periods. The present model is mainly based on data from the long-acting formulation Liquamycin (a reference product), and the results are applicable to verified bioequivalent products, such as Tetradure 300 and OxyMed LA (FDA, 1996, 2003, 2019). However, if a novel product is used, it will require additional validation before the model can be used for other formulations.
Unlike some PBPK models in the past that used proprietary software, R and R Shiny are widely used portable statistical programming languages that are now well-accepted tools in the PBPK modeling community. Both the “desolve” and “mrgsolve” R packages have been used to develop and implement PBPK models. The “mrgsolve” package is much faster than the “desolve” package. The “desolve” package has the flexibility to incorporate minute details in the drug dosing simulation, whereas the “mrgsolve” package has a built-in drug administration module with little room for modifications. By comparing the simulation results from the PBPK model between the “desolve” (Supplementary Figs. 1 and 2) and “mrgsolve” (Figs. 4 and 5), we found some differences, especially in terminal phases, making a difference in the estimated WDIs. The exact reason for these differences is still unknown, but could be related to the differences in the mathematical algorithms used to solve the ordinary differential equations of the PBPK model between the two software packages.
This study also has some limitations. The label WDI defined by FDA was not compared with a simulated one from the model, as the model is not calibrated for the tissue depletion profiles following medicated feeding. Upon the availability of the plasma and tissue concentrations following oral administration of OTC, the oral administration route can be incorporated into the model. Furthermore, the model was calibrated and validated only for the long-acting OTC formulations and may therefore not apply to immediate release formulations that are also approved in some veterinary species. Due to limited availability of the edible tissue data, most tissue data were used for model calibration. Hence only plasma and kidney data in sheep, while only plasma data in goats were used for model evaluation.
CONCLUSIONS
This study developed and validated a PBPK model to predict OTC residues in edible tissues and estimate extended WDIs in sheep and goats. The model is of good quality as it is validated by independent pharmacokinetic and tissue biodistribution data from FARAD. The model simulations were generally within 2-fold observed OTC concentrations in edible tissues and plasma from available pharmacokinetics studies. Population PBPK models were developed for Monte Carlo simulations to estimate WDIs for the most commonly used therapeutic regimens in sheep and goats from the FARAD Regional Call Centers. The population PBPK model can be used to predict WDIs of OTC after extralabel use in sheep and has been extrapolated to goats. The population PBPK model was converted to a web-based iPBPK interface to facilitate the application in estimating extralabel WDIs. The iPBPK web interface is a user-friendly online tool for estimating OTC withdrawal times in food animals. The model also serves as a foundation to be extrapolated to other drugs or other food animals to facilitate the application of PBPK models in the animal-derived food safety assessment.
SUPPLEMENTARY DATA
Supplementary data are available at Toxicological Sciences online.
ACKNOWLEDGEMENTS
Authors would like to acknowledge helpful discussions from Dr Wei-Chun Chou, Dr Long Yuan, and Dr Qiran Chen in the Center for Environmental and Human Toxicology and Department of Environmental and Global Health, College of Public Health and Health Professions at the University of Florida (formerly in the Institute of Computational Comparative Medicine, Department of Anatomy and Physiology, College of Veterinary Medicine at Kansas State University).
FUNDING
United States Department of Agriculture (USDA) National Institute of Food and Agriculture (NIFA) for the Food Animal Residue Avoidance Databank (FARAD) Program (2018-41480-28805, 2019-41480-30296, and 2020-41480-32497).
DECLARATION OF CONFLICTING INTERESTS
The authors declared no potential conflicts of interest with respect to the research, authorship, and/or publication of this article.
REFERENCES
AVA. (
EMA. (
FDA. (
FDA. (
FDA. (
FDA. (
FSANZ. (
USDA. (
VetGRAM. (
WHO. (

Comments