


Abstract
Early risk assessment of drug-induced liver injury (DILI) potential for drug candidates remains a major challenge for pharmaceutical development. We have previously developed a set of rat liver transcriptional biomarkers in short-term toxicity studies to inform the potential of drug candidates to generate a high burden of chemically reactive metabolites that presents higher risk for human DILI. Here, we describe translation of those NRF1-/NRF2-mediated liver tissue biomarkers to an in vitro assay using an advanced micropatterned coculture system (HEPATOPAC) with primary hepatocytes from male Wistar Han rats. A 9-day, resource-sparing and higher throughput approach designed to identify new chemical entities with lower reactive metabolite-forming potential was qualified for internal decision making using 93 DILI-positive and -negative drugs. This assay provides 81% sensitivity and 90% specificity in detecting hepatotoxicants when a positive test outcome is defined as the bioactivation signature score of a test drug exceeding the threshold value at an in vitro test concentration that falls within 3-fold of the estimated maximum drug concentration at the human liver inlet following highest recommended clinical dose administrations. Using paired examples of compounds from distinct chemical series and close structural analogs, we demonstrate that this assay can differentiate drugs with lower DILI risk. The utility of this in vitro transcriptomic approach was also examined using human HEPATOPAC from a single donor, yielding 68% sensitivity and 86% specificity when the aforementioned criteria are applied to the same 93-drug test set. Routine use of the rat model has been adopted with deployment of the human model as warranted on a case-by-case basis. This in vitro transcriptomic signature-based strategy can be used early in drug discovery to derisk DILI potential from chemically reactive metabolites by guiding structure-activity relationship hypotheses and candidate selection.
Drug-induced liver injury (DILI) is a major cause of attrition in pharmaceutical development. Although liver toxicity had been the main cause of postapproval market withdrawals, such occurrences have diminished over the past decade, largely due to the implementation of heightened regulatory diligence in Phase 3 clinical trials (Senior, 2014), impacting decisions to halt progression of drug candidates such as telcagepant (MK-0974) and MK-3207 (Hargreaves and Olesen, 2019), fasiglifam (Marcinak et al., 2018), LY2886721 (May et al., 2015), and atabecestat (Henley et al., 2019), at late stages of clinical development. Conventional nonclinical toxicity studies have proven to be inadequate in predicting all of pharmaceutical-associated human clinical hepatotoxicity, especially “idiosyncratic” DILI cases. Although idiosyncratic DILI is often considered highly unpredictable, this phenomenon is believed to be mediated by several underlying mechanisms which are conceivably testable. Proposed mechanisms include formation of chemically reactive metabolites, mitochondria dysfunction, disruption of bile salt homeostasis, and immune-mediated injury (Weaver et al., 2020). Implementing such mechanism-based endpoints and assays during early drug development could help minimize risks for certain idiosyncratic DILI. Despite significant investment alignment on reliably predictive preclinical models of human DILI has remained a challenge (Sistare et al., 2016) however.
It is hypothesized that in many instances livers of preclinical species may respond to chemical stressors with compensatory transcriptional changes that convey resistance to some mechanisms of hepatotoxicity, but that may later emerge in limited numbers of more susceptible humans. Therefore, such adaptative transcriptional responses could serve as sensitive and quantitative mechanistic tissue biomarkers of human DILI risk potential. We (Monroe et al., 2020) and other pharmaceutical researchers (Laifenfeld et al., 2014; Leone et al., 2014; Reese et al., 2011) have independently developed a number of such in vivo transcriptomics-based biomarkers to inform DILI risk potential. As a part of our lead optimization strategy, we have developed an in vivo bioactivation liver response assay (BA-LRA) based on a set of liver transcriptional biomarkers in short-term rat studies that respond quantitatively to chemically reactive metabolites predicted to trigger bioactivation-mediated clinical DILI (Monroe et al., 2020).
A higher throughput and resource-sparing in vitro assay that leverages these in vivo derived mechanistic transcriptional endpoints in a similarly rigorous quantitative manner would be highly desirable during early stages of drug discovery where evaluations of large numbers of compounds are often needed. Several published reports suggest hepatic transcriptomic responses to toxicological insults in vivo could be translated into in vitro cultures of rat primary hepatocytes to a certain degree (De Abrew et al., 2015; Teppner et al., 2016), and other groups have also evaluated transcriptional responses in cultured human hepatocytes to hepatotoxicants. Outcomes from these studies have been mixed (Copple et al., 2019; Rodrigues et al., 2016; Takakusa et al., 2008; Ware et al., 2017). For example, whereas Takakusa and colleagues showed that heme oxygenase 1 (HMOX1), a marker of electrophilic stress regulated by NRF2, responded to 4 out of 5 hepatotoxicants tested (80% sensitivity) but not to the 4 safe drugs (100% specificity), Copple et al. found that NRF2 activation has relatively low sensitivity (37%) and retains high specificity (82%) in predicting human clinical DILI for the large number of drugs they evaluated. Quantitative structure-activity relationship computational modeling approaches have also been developed to reduce clinical DILI risk potential and recent studies have reported prediction accuracies up to 78% with some models (He et al., 2019; Mulliner et al., 2016). Although independent prospective validation with previously undisclosed structures are needed to assess the true predictive power of these computational models (Mulliner et al., 2016), an integrated approach using in silico modeling to guide chemical syntheses used in tandem with biologically based in vitro test models to evaluate proposed structures are expected to reduce DILI risk.
Because hepatocytes cultured in the HEPATOPAC system have been shown to retain in vivo-like metabolic activities over a period of weeks (Khetani and Bhatia, 2008; Kratochwil et al., 2017; Wang et al., 2010), we reasoned that hepatic transcriptional responses to chemically reactive metabolites should also be readily detectable in vitro using the HEPATOPAC model. In this study, we established an in vitro bioactivation-based transcriptional signature endpoint in the rat HEPATOPAC (in vitro BA-LRA) following 9 days of repeat-dose treatment and qualified the use of this model for guiding internal DILI derisking decision making with a set of over 90 commercial drugs and internal compounds that either carry a high risk for human DILI or are considered safe for the liver. Our results show that the in vitro rat BA-LRA model provides greater than 80% sensitivity and specificity in detecting drugs associated with high risk for human DILI and can successfully differentiate bioactivation-based hepatotoxicity potential among a number of exemplar structurally similar compounds. We demonstrate that in certain circumstances human HEPATOPAC will provide improved BA-LRA data due in part to significant species differences in metabolism, but that the rat in vitro model can be successfully deployed routinely. A summary of these data has been presented previously as a poster presentation at the 57th Annual Society of Toxicology Meeting.
MATERIALS AND METHODS
HEPATOPAC culture, dosing, sample collection
HEPATOPAC plates were purchased from Ascendance Biotechnology (Now Bio IVT), Medford, Massachusetts. Rat and human primary hepatocytes, cryopreserved in liquid nitrogen, were used to produce HEPATOPAC plates used in the study. For the rat HEPATOPAC, mixed donor lots from male Wistar-Hannover strain rats were used, and for the human HEPATOPAC, single donor lots were used. For the HEPATOPAC culture, the manufacturer’s protocol was followed with minor modifications. Briefly, the manufacturer’s proprietary Maintenance Medium (containing 10% serum, part number 5032C) was used throughout the cell culture and compound treatment period. Upon receiving plates, the shipping medium was removed and replaced with freshly prepared Maintenance Medium before placing plates in a 37°C humidified incubator with 10% CO2. After a 2-day recovery (Study Day 0), the existing culture medium was replaced with freshly prepared medium containing various concentrations of compounds. Cultures were replenished with fresh compound-containing media at Study Days 2, 5, 7, for a total of 9 days of treatment. Spent media samples were collected on Study Days 2, 5, 7, 9 for cell viability and urea (see below) endpoint determinations. At the end of the incubation period, cells were rinsed and frozen before proceeding to RNA extraction and transcriptional analysis.
Test compounds
Commercial compounds were purchased from various vendors, and our company compounds were synthesized internally (see Supplementary Table 1 for compound information). For most test compounds, 1000× stock solutions were prepared in dimethyl sulfoxide (DMSO, Sigma, Cat No. D8418) at various concentrations, and then diluted 1:1000 in Maintenance Medium before adding to the cell culture. For compounds poorly soluble in DMSO, attempts were made by using deionized water as the solvent to increase solubility. For water soluble compounds, 200× stock solutions were prepared and then diluted 1:200 in Maintenance Medium, with DMSO added separately at 1:1000 to a final concentration of 0.1%. We used several sources to make judgments on liver safety and for selecting drugs used for this assessment. Clinical case reports from published literature, product labels, the NIH LiverTox database, published country registries were interrogated. True clinical hepatotoxicants were identified for testing among marketed or marketed but withdrawn compounds that have documented clinical diagnoses of significant incidences of acute liver failure. Marketed drugs labeled with more moderate and non-life-threatening increases in aminotransferases representing a reversible and adaptive response to drug treatment and not documented to be accompanied by acute liver failure indicating permanent injury to the liver, were not classified as DILI-positive clinical hepatotoxicants. Marketed drugs were considered liver nontoxicants that are not associated with documented instances of acute liver failure, have had wide market exposure over prolonged time, and because high daily dose is a risk, drugs were sought that have been administered safely at relatively high doses to result in significant daily liver dose burdens. In addition, compounds were selected for testing that had been discontinued by pharmaceutical sponsors at clinical stages of drug development due to strong liver safety transaminase signals, but without allowing instances of acute liver failure. For such drugs, the liver safety signals were considered sufficiently strong for sponsors to discontinue development and so are representative of the type of test candidate that needs to be identified earlier, and therefore were also characterized as true clinical DILI positives. Our list of drugs, their categorical assignments, and references supporting their categorization have been described recently (Monroe et al., 2020; Xu et al., 2019).
Cell viability assessment
Spent culture medium samples were collected at the end of each dosing period on Study Days 2, 5, 7, and 9, and analyzed for levels of aspartate aminotransferase (AST), lactate dehydrogenase (LDH), glutamate dehydrogenase (GLDH), and urea. For medium samples collected from rat HEPATOPAC, an AU5800 Chemistry Analyzer (Beckman Coulter) was used with the following methodology according to manufacturer’s instructions: AST was determined using the UV/NADH method (part number OSR6109); LDH was determined using the Lactate-Pyruvate method (part number OSR6127); GLDH was determined using the NADH oxidation method (part number GL442); Urea was determined using the Urease/GLDH method (part number OSR6134). For medium samples collected from human HEPATOPAC, an Atellica CH 930 Chemistry Analyzer (Siemens Medical Solutions USA) was used with the following methodology according to manufacturer’s instructions: AST was determined using the Oxalacetate/NADH Oxidation method (part number 11097607); LDH was determined using the Lactate-Pyruvate/NAD Reduction (part number 11097594); GLDH was determined using the α-Oxoglutarate/NADH Oxidation method (part number GL442). The Stanbio Urea Nitrogen (BUN) Test kit (Stanbio Laboratory, Cat No. 0580-250) was used to measure urea levels in human HEPATOPAC samples according to the manufacturer’s instructions. Albumin levels in the medium samples were measured using the Rat Albumin ELISA kit (Bethyl Laboratories, Inc, Cat No. E111-125) or the Human Albumin ELISA Quantitation Set kit (Bethyl Laboratories, Inc, Cat No. E80-129) according to the manufacturer’s instructions. Bright-field images of HEPATOPAC culture plates were also captured using an IN Cell Analyzer 2000 imaging system (GE Healthcare) and visually inspected for changes in hepatocyte and fibroblast cell morphology, and for drug precipitation. Cultures showing significant signs of cytotoxicity or precipitations were excluded from gene expression analyses.
Transcriptional analysis: RNA isolation, quantitative RT-qPCR, and BA-LRA score calculation
Total RNA was isolated on a MagMAX Express 96 Magnetic Particle Processor using the MagMAX-96 for Microarrays Total RNA Isolation Kit (Thermo Fisher, Cat No. AM1839) according to the manufacturer’s instructions. Isolated RNA was quantitated using the NanoDrop 8000 UV-Vis Spectrophotometer (Thermo Fisher). RNA samples were excluded from gene expressions analysis if A260/280 ratio was less than 1.6 or Ct (cycle threshold) values of endogenous control genes fell outside the historical range of vehicle-treated controls. Total RNA (100 ng) was reverse transcribed to cDNA using random hexamers and the High-Capacity cDNA Reverse Transcription Kit (Thermo Fisher, Cat No. 4368814). For the OpenArray platform described below, 7.5 µl of cDNA was preamplified for 14 cycles using the TaqMan PreAmp Master Mix and custom primer pools (Thermo Fisher, Cat No. 4391128) according to the manufacturer’s instructions prior to PCR amplification. PCR reactions for rat HEPATOPAC samples were conducted using a TaqMan 384-well microfluidic card (Thermo Fisher, Cat No. 4342259) containing inventoried TaqMan Assays, and for the human HEPATOPAC samples, PCR reactions were performed using a TaqMan OpenArray Real-Time PCR array (ThermoFisher, Cat No. 4471128) containing inventoried TaqMan Assays. Inventoried TaqMan Assays (Thermo Fisher) consist of gene specific-primers and a fluorescently labeled probe designed for the detection of transcripts of interests on the QuantStudio 12K Flex Real-time PCR System (Thermo Fisher), and target gene transcripts and their corresponding TaqMan Assay ID/Cat No. are listed in Table 1. PCR reactions using cDNA samples from the reverse transcription or preamplification reactions were amplified for 40 cycles. For data analysis, cycle threshold was captured for each target genes and used to calculate the relative gene expression change (Fold Change) using the standard ΔΔCt method by comparing treatment groups to concurrent vehicle controls after normalizing to the average Ct value of 10 (human) or 12 (rat) endogenous housekeeping genes as listed in Table 1. The average Ct value of these endogenous housekeeping genes was chosen as the internal “normalizer” to avoid the pitfall of using a single housekeeping gene as selective gene expression changes could sometimes occur at individual gene levels upon compound treatment without having significant effects on other genes. To calculate BA-LRA scores, the fold change of each individual BA-LRA gene (listed in Table 1) was log10 transformed and the signature score was then calculated by taking the unweighted average log10 ratio of the 10 constituent genes. For each test compound, at least 3 concentrations were tested in minimal 3 biological replicates, with the mean BA-LRA scores and standard deviations for each concentration summarized in Supplementary Table 1.
Gene Signature Composition for HEPATOPAC In Vitro Bioactivation Liver Response Assay (BA-LRA)
| Gene | TaqMan Assay ID (Thermo Fisher Cat No.) | Max Induction | Induction 95 | Induction 5 | R-square | NRF2 Loading Coefficient | NRF1 Loading Coefficient | |
|---|---|---|---|---|---|---|---|---|
| Rat HEPATOPAC BA-LRA genes | Akr7a3 | Rn00566256_m1 | 0.81 | 0.46 | −0.13 | 0.77 | 1.14 | −0.07 |
| Csmd1 | Rn01482095_m1 | 0.7 | 0.42 | −0.16 | 0.51 | 0.73 | −0.01 | |
| Entpd5 | Rn01517807_m1 | 0.6 | 0.27 | −0.06 | 0.78 | 0.58 | 0.03 | |
| Ephx1 | Rn00689145_m1 | 0.94 | 0.39 | −0.05 | 0.82 | 0.78 | −0.08 | |
| Gsta2 | Rn00566636_m1 | 2.02 | 1.39 | −0.11 | 0.91 | 2.28 | 0.03 | |
| Gsta4 | Rn01446656_g1 | 1.24 | 0.62 | −0.09 | 0.86 | 1.16 | −0.17 | |
| Gsta5 | Rn01511827_m1 | 0.89 | 0.58 | −0.2 | 0.57 | 0.99 | −0.24 | |
| Srxn1 | Rn01536084_g1 | 0.82 | 0.36 | −0.06 | 0.71 | 0.64 | 0.17 | |
| Ugt2b1 | Rn00756519_m1 | 0.68 | 0.37 | −0.12 | 0.68 | 0.01 | −0.07 | |
| Zfand2a | Rn01409464_m1 | 0.56 | 0.36 | −0.07 | 0.8 | 0.19 | 0.41 | |
| Human HEPATOPAC BA-LRA genes | ABHD4 | Hs01040459_m1 | 0.63 | 0.43 | −0.12 | 0.36 | 0.55 | 0.05 |
| AKR1C3 | Hs00366267_m1 | 0.75 | 0.49 | −0.08 | 0.6 | 0.59 | 0.83 | |
| ALAS1 | Hs00963534_m1 | 0.93 | 0.67 | −0.08 | 0.74 | 0.79 | −0.37 | |
| BLVRB | Hs01106480_m1 | 0.94 | 0.58 | −0.06 | 0.66 | 0.66 | 0.69 | |
| GSTA1 | Hs00275575_m1 | 0.64 | 0.44 | −0.12 | 0.56 | 0.92 | −0.2 | |
| GSTA2 | Hs00747232_mH | 1.2 | 0.8 | −0.09 | 0.84 | 1.68 | −0.4 | |
| HMOX1 | Hs01110250_m1 | 1.39 | 0.42 | −0.11 | 0.67 | 1.22 | 0.43 | |
| PIR | Hs01125822_m1 | 0.79 | 0.37 | −0.06 | 0.73 | 0.55 | 0.6 | |
| SRXN1 | Hs00607800_m1 | 1.13 | 0.45 | −0.09 | 0.43 | 1.09 | −0.19 | |
| TXNRD1 | Hs00917067_m1 | 0.88 | 0.35 | −0.08 | 0.55 | 0.87 | 0.12 | |
| Endogenous control genes (TaqMan Assay ID) | Rat HEPATOPAC: 18S (Hs03003631_g1), Ddx47 (Rn01463225_m1), Tmed4 (Rn01443676_m1), Tlk2 (Rn01466559_m1), Srrm1 (Rn01519334_m1), Pum1 (Rn00982780_m1), Rchy1 (Rn01414006_g1), Gusb (Rn00566655_m1), Inpp5a (Rn00897212_m1), Rab35 (Rn01500018_m1), Hnrnpul1 (Rn01764185_m1), and Tmem183a (Rn01490494_m1) | |||||||
| Human HEPATOPAC: DDX47 (Hs00275327_m1), GUSB (Hs00939627_m1), HNRNPUL1 (Hs00199870_m1), INPP5A (Hs00194284_m1), PUM1 (Hs00472881_m1), RAB35 (Hs00199284_m1), RCHY1 (Hs00996236_m1), SRRM1 (Hs00366642_m1), TMED4 (Hs01564864_m1), and TMEM183A (Hs04194674_s1) | ||||||||
The log10-ratio induction of each gene is described in terms of its maximum, 95th, and 5th percentile. The regression modeling of the induction is described in terms of R-square, NRF2, and NRF1 loading coefficients as previously described (Podtelezhnikov et al. 2020). R-squared above 0.6 and maximum loading coefficients for each gene are highlighted.
RNA-Seq experiment
Genome-wide RNA-Seq data were generated using 2 human liver RNA samples obtained commercially (Amsbio, Cat No. R1234149, Lot Nos B512017 and B705065) and RNA extracted from liver samples of vehicle-treated CRL: WI(Han) rats from our internal in vivo studies as well as various in vitro cell culture models described below. HEPATOPAC RNA samples were collected from 2 individual human single donor lots (3121A and 4202), and 1 pooled male WI(Han) rat lot, at Study Days 2, 5, 7, 9. To generate primary hepatocyte RNA samples, cryopreserved primary hepatocytes were cultured in monolayers using standard hepatocyte culture protocols and were harvested for RNA from time 0 up to 7 days following plating. HepG2 and H4IIE cells were cultured in monolayers according to the instructions provided by ATCC, and RNA was harvested when cells reached 100% confluency after 2 days in culture. Human liver model A is a proprietary 3D in vitro liver model created using primary hepatocytes and a nonparenchyma cell type which were then cocultured between 0 and 14 days for RNA extraction. iPSC-derived hepatocytes were reprogramed human skin fibroblasts using a proprietary protocol, plated in a monolayer culture from cryopreserved frozen cells, and harvested for RNA after 0–8 days. Detailed methods for RNA-Seq were described previously elsewhere (Podtelezhnikov et al., 2020). Briefly, total RNA samples were converted into cDNA libraries using the KAPA RNA HyperPrep Kit with RiboErase (HMR) Kit (Roche, Cat No. 08098131702) for rat or the TruSeq Stranded Total RNA Library Prep Human/Mouse/Rat Kit (Illumina, Cat No. 20020596) for human as per manufacturer’s instructions. Sequencing was performed on the Illumina NextSeq 500 Platform using the NextSeq 500/550 High Output v2.5 kit (75 cycles) for rat and the NextSeq 500/550 High Output v2 kit (150 cycles) for human. A minimum of 40 million 50‐bp paired ‐end reads were generated for each sample. Genome alignment and gene quantitation was performed using OmicSoft Array Studio. Reads for rat and human samples were aligned to the combined Mouse.B38+Rat.B6.0 and Mouse.B38+Human.B38 genome references, respectively, using the OmicSoft Aligner with a maximum of 2 allowed mismatches. Gene level counts were determined by the RNA-Seq by expectation maximization algorithm as implemented in OmicSoft Array Studio and using Ensembl.R96 gene models. The data discussed in this publication have been deposited in NCBI's Gene Expression Omnibus and are accessible through GEO Series accession number GSE150069.
Maximal human liver inlet concentration calculation
To assess the DILI potential of a drug using the in vitro BA-LRA model, an exposure index was used to determine the relevance of any significant BA-LRA signal in the context of a practically achievable maximal clinical liver exposure. The index is defined as the ratio of the nominal added total drug test concentration in cell culture media containing 10% serum, to the calculated maximal human liver inlet total drug concentration for each drug at the maximum labeled therapeutic dose. Concentrations used in this study represent total drug levels, which include both free and protein bound fractions because serum is present both in vivo and in vitro. The maximal human liver inlet concentration was estimated using the following formula, [I] in, max = [I] max + ka × Dose × Fa/Qh, as described previously by Ito et al. (2002), with values of ka (absorption rate constant), Fa (fraction absorbed from gut to the portal vein), and Qh (hepatic blood flow rate) assumed to be 0.1 min−1, 1, and 1610 ml/min, respectively. Human clinical dose and [I] in, max (liver inlet max) for the 93 test compounds are presented in Supplementary Table 1. For drugs with maximal daily doses given in divided doses, single administered dose levels are used to calculate the maximal liver inlet concentration. The decision to maintain 10% serum in the media is based on our early data indicating that BA-LRA responsiveness and stability over 9 days of culture was superior to serum-free media. Although a lower culture media serum protein concentration would be expected to yield a higher percentage of free drug yielding a concentration-response curve toward an apparent greater in vitro sensitivity, other factors such as reduced in vitro metabolic and transporter capacity would be expected to reduce apparent in vitro sensitivity for a bioactivation dependent mechanism. Although drug accumulation abilities should ideally match between in vitro and in vivo for drugs with low permeability and high transporter affinities and published data indicate human HEPATOPAC can mimic drug accumulation through active hepatic uptake transporters (Ramsden et al., 2014), it is extremely challenging if not impossible to know this and therefore to model accurately free intracellular drug concentration in various zones of the liver, but it becomes pragmatically unnecessary to know this a priori if the assumption is accurate that in vitro intracellular drug concentrations will not vary significantly from in vivo in a phenotypically mature in vitro model system, even in situations where drugs may accumulate. All assay evaluations are therefore based only on knowing the extracellular total drug concentration. We therefore pursued a pragmatic and empirical approach to identify a correction factor (see below) that would incorporate all such known and unknown factors allowing extrapolation of measured transcriptional responses from nominal in vitro total added drug concentrations in 10% serum containing media, to clinical results benchmarked to human liver inlet Cmax total drug concentrations.
RESULTS
HEPATOPAC Demonstrates Favorable, Stable, and Phenotypically Mature In Vivo Liver-like Profiles
Retention of high drug metabolic activities in human HEPATOPAC has been described elsewhere (Khetani and Bhatia, 2008; Kratochwil et al., 2017; Wang et al., 2010). We similarly profiled gene expression longitudinally from primary hepatocyte cultures and other in vitro model systems using RNA-Seq and concluded that human HEPATOPAC closely matched human liver when the focus was placed on the basal expression of 68 prioritized hepatic genes (listed in Supplementary Figure 5) commonly involved in drug absorption, distribution, metabolism, and excretion, such as Phase I and II drug metabolism enzymes and transporters (Figure 1). We also assessed the longitudinal stability in the basal expression of this orthologous broad panel of 72 liver genes (listed in Supplementary Figure 5) in rat HEPATOPAC cultures and compared the results to rat liver, cultured primary hepatocytes in monolayer and other in vitro models (Figure 1). The results support the conclusion that rat HEPATOPAC is a relatively phenotypically mature and stable in vitro culture model for the rat liver, though opportunity for improvement remains clear from the principal component analysis (PCA) plot (Figure 1). For the PCAs of the rat liver models, Principal Component 1 accounts for 74% of the variance and Principal Component 1 for HEPATOPAC shows similar proximity to liver and freshly isolated primary hepatocytes as rat hepatocytes cultured for 2 days. Most striking here is the superior stability of rat HEPATOPAC over primary rat hepatocyte cultures for both Principal Component 1 and 2 over 9 days. The Principal Component 2 dimension which accounts for 15% of the variance, indicates that there is clear room for improvement in a model that will retain even greater Day 0 rat hepatocyte phenotype for 9 days. The RNA-Seq gene expression data have been deposited in NCBI's Gene Expression Omnibus and are accessible through GEO Series accession number GSE150069.
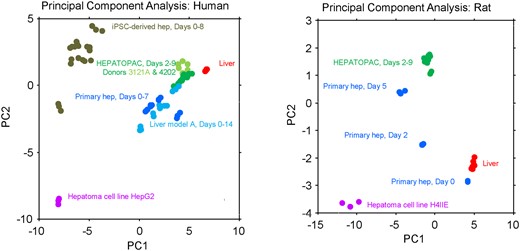
Principal component analysis (PCA) in baseline gene expression of in vivo liver and in vitro liver models. Genome-wide RNA-Seq data were generated using RNA harvested from human and rat liver, HEPATOPAC, primary hepatocytes, hepatoma cell lines, and other proprietary in vitro liver models as described in the Materials and Methods section. PCA in the basal expression was conducted using 68 prioritized genes from human and 72 prioritized genes from rat. The selected rat genes came from HNF4A, AHR, CAR, PXR+CAR, NRF2 biomarker signatures described elsewhere (Podtelezhnikov et al. 2020) and the human genes are orthologs of the rat genes (see Supplementary Figure 5 for gene list). For the PCAs of the human models, PC1 accounts for 58% and PC2 accounts for 18% of the total variance. For the PCAs of the rat models PC1 accounts for 74% and PC2 accounts for 15% of total variance.
As representative and critical measures of integrated complex hepatic multistep biochemical synthetic pathways, albumin and urea production rates were determined. These liver function parameters from the HEPATOPAC model were found to be similar to levels expected for human and rat liver in vivo (Table 2) and remained stable over a 9-day incubation period (Supplementary Table 2). Taken together our data presented here with the previous reports of sustained high level drug metabolism activities by others (Khetani and Bhatia, 2008; Kratochwil et al., 2017; Wang et al., 2010), the experimental evidence support HEPATOPAC as a favorable and stable in vitro liver model of choice for our investigations.
Albumin and Urea Production Rates in the HEPATOPAC
| Production Rate | Human HEPATOPAC | Human In Vivo Liver | Reference (In Vivo Liver) |
|---|---|---|---|
| Albumin (µg/day/million cells) | 24 | 37–105 | Baudy et al. (2020) |
| Urea (µg/day/million cells) | 170 | 56–159 | |
| Production Rate | Rat HEPATOPAC | Rat In Vivo Liver | Reference (In Vivo Liver) |
| Albumin (µg/day/million cells) | 250 | ∼200 | Bean and Atkinson (1984), Ruot et al. (2000), and Sohlenius-Sternbeck (2006) |
| Urea (µg/day/million cells) | 1500 | ∼500–1500 | |
Discovery and Establishment of In Vitro BA-LRA Signature in the Rat HEPATOPAC
We had previously established a chemically reactive metabolite-based bioactivation transcriptional signature in rat liver using an internal library of drugs across a spectrum of documented covalent-binding activity (Monroe et al., 2020) that we determined to be primarily NRF2 and NRF1 driven (Podtelezhnikov et al., 2020). We thus sought to determine if an in vitro transcriptional response to the formation of chemically reactive metabolites in metabolically competent and stable rat HEPATOPAC cultures might closely approximate the molecular biology that we had discovered in vivo. We initially leveraged the prototypical agents: bardoxolone known to activate the NRF2 pathway without the need for hepatic biotransformation; β-naphthoflavone which generates a Cyp1a1-mediated metabolite shown to activate NRF2 (Nguyen, unpublished data); and DILI-positive drugs (MK-3207 and flutamide) which require metabolic activation in the liver and had previously demonstrated positive transcriptional BA-LRA responses in vivo. Rat HEPATOPAC cultures were incubated with these compounds at 2 concentrations for 6, 24, and 48 h. Following the incubation, RNA was isolated and subjected to genome-wide profiling. The RNA-Seq gene expression data (accessible through GEO Series accession number GSE150069) were used to assess the responsiveness in rat HEPATOPAC of the previously developed in vivo rat BA-LRA gene signature (Monroe et al., 2020; Podtelezhnikov et al., 2020). Note that for this analysis we used the extended list of 56 BA-LRA expression network genes described by Monroe et al. (not the reduced set of 46 assay genes) in case some of the network genes not selected for the final in vivo gene set responded more robustly in vitro. In rat liver this network is upregulated in response to reactive metabolites, and is strongly enriched in reactive metabolic stress response genes including NRF1/proteasome and NRF2 pathways (Monroe et al., 2020).
Based on these data, the 29 genes which were most upregulated on average across rat HEPATOPAC study treatments were selected for confirmation using a customized TaqMan PCR-based microfluidic card on samples from cultures treated with additional DILI-positive and -negative drugs (listed in Table 3) that had been evaluated in rat in vivo (Monroe et al., 2020). These additional compounds were selected based on the hepatotoxicity mechanisms reported in published literature as well as in vivo BA-LRA results (Monroe et al., 2020). The 4 compounds used in the original RNA-Seq profiling experiment were repeated to assess reproducibility across studies and platforms as well as responsiveness over a longer incubation time course. Rat HEPATOPAC was treated for up to 9 days with these 14 compounds at 3 concentrations per compound. Using the resultant PCR data for these 14 total compounds we selected the 10 most robustly upregulated among the 29 BA-LRA network genes selected for evaluation, and the average expression changes of these 10 genes (Table 1) relative to vehicle controls was thereafter used to calculate the in vitro BA-LRA scores for all compounds as described in the Materials and Methods section. Using a linear regression model subsequently developed in the in vivo context described elsewhere (Podtelezhnikov et al., 2020), 8 of these 10 genes can be ascribed to NRF2 activity, and one other to NRF1 activity as indicated by the model loading factors (Table 1).
Initial Set of Compounds Used for the Identification and Refinement of the In Vitro Bioactivation Liver Response Assay (BA-LRA) Signature
| Compound | Clinical DILI Risk | Potential DILI Mechanisms | In Vivo Rat BA-LRA DILI Prediction | Rat HEPATOPAC In Vitro BA-LRA Scores (> 0.20) | Reference |
|---|---|---|---|---|---|
| Amiodarone | DILI+ve | Mitochondrial/lysosomal toxicity | Negative | Negative up to 30 µM | LiverTox database |
| Benzbromarone | DILI+ve | Mitochondrial toxicity; BSEP inhibition | Insufficiently tested | Negative up to 30 µM | Hafey et al., (unpublished data) and LiverTox database |
| Diclofenac | DILI+ve | Multifactorial/immune mediated | Insufficiently tested | Positive @ 200 µM | LiverTox database |
| Flutamide | DILI+ve | Reactive metabolite | Positive | Positive @ 50 µM | LiverTox database |
| Isoniazid | DILI+ve | Reactive metabolite/immune mediated | Insufficiently tested | Negative up to 1000 µM | LiverTox database |
| MK-3207 | DILI+ve | Reactive metabolite | Positive | Positive @ 30 µM | Hargreaves and Olesen (2019) and Monroe et al. (2020) |
| MK-0974 | DILI+ve | Reactive metabolite | Underestimated signal/insufficiently tested | Positive @ 30 µM | Hargreaves and Olesen (2019) and Monroe et al. (2020) |
| Sitaxsentan | DILI+ve | Bile salt accumulation/reactive metabolite | Positive | Positive @ 100 µM | Kenna et al. (2015) |
| Ticlopidine | DILI+ve | Reactive metabolite | Positive | Positive @ 30 µM | LiverTox database |
| Zafirlukast | DILI+ve | Reactive metabolite/BSEP inhibition | Negative | Negative up to 30 µM | LiverTox database |
| Clarithromycin | DILI−ve | N/A | Positive | Negative up to 30 µM | Monroe et al. (2020) |
| Warfarin | DILI−ve | N/A | Not tested | Negative up to 80 µM | LiverTox database |
| Bardoxolone | N/A | N/A | Positive | Positive @ 0.2 µM | N/A |
| β-Naphthoflavone | N/A | N/A | Not tested | Positive @ 30 µM | N/A |
Abbreviations: DILI, drug-induced liver injury; N/A, not applicable. LiverTox database: available at https://www.ncbi.nlm.nih.gov/books/NBK547852, last accessed April 8, 2020.
Results relying on these 10 in vitro BA-LRA genes demonstrate that the BA-LRA responses generated in the rat HEPATOPAC were largely consistent with BA-LRA responses obtained from rat in vivo studies as shown, eg, for the first subset of 14 compounds (Table 3). Twelve of these 14 initially selected test compounds were tested both in vivo and in vitro (Table 3). For only 6 compounds the BA-LRA responses can be compared between in vitro and in vivo due to the reasons described below. All 6 of these results match between in vitro and in vivo. Five of the 6 yielded robust BA-LRA transcriptional responses both in vivo and in vitro (bardoxolone, flutamide, MK-3207, sitaxsentan, and ticlopidine) and 1 did not yield BA-LRA transcriptional responses either in vivo or in vitro despite being adequately tested in both rat test systems (zafirlukast). For the other 6 of the 12 tested compounds either the in vitro test result was deemed inadequately tested due to cytotoxicity limitations (clarithromycin, amiodarone, benzbromarone) and failed criteria for achieving an adequate test concentration; or the in vivo test result was deemed inadequate or underestimated and failed criteria for achieving an adequate in vivo study result (isoniazid, MK-0974, and diclofenac). MK-0974 was concluded to be underestimated, and diclofenac was concluded to be inadequately tested in vivo due to poor tolerability and evidence of transcriptional repression (Monroe et al., 2020). MK-0974 showed a dose related in vivo BA-LRA signal but also triggered hemodynamic changes and clear evidence of a transcriptional suppression at high doses. Diclofenac, as for all NSAIDs, resulted in significant GI toxicity after oral dosing of rats which led to the same broad suppression of transcriptional activity including BA-LRA genes, rendering in vivo BA-LRA conclusions also unreliable for diclofenac (Monroe et al., 2020). In rat HEPATOPAC, an in vitro model devoid of in vivo hemodynamic and immune-associated limitations on transcriptional activation, MK-0974, and diclofenac showed elevated BA-LRA responses at 30 and 200 µM, respectively.
To confirm that the in vitro BA-LRA signature had indeed originated from and was specific to the rat hepatocytes, stromal cell only plates were tested with a similar set of compounds including bardoxolone. As would be expected, essentially no contribution to the in vitro rat BA-LRA signal was detectable from mouse stromal cells using PCR primer/probe sets designed for rat sequence, as Ct values for RNA samples extracted from murine stromal cells were below the limit of detection (Ct > 40) in the RT-PCR assay for 8 out of the 10 genes of the BA-LRA signature.
Internal Qualification of In Vitro BA-LRA Model With a 93-compound Test Set
The prioritized panel of 10 genes constituting the working signature for the in vitro rat BA-LRA was evaluated for its performance in detecting hepatotoxic drugs using a total of 93 commercial and internal drugs from our company with known truth for clinical DILI. The selection and adjudication (DILI positive [DILI+ve] or negative [DILI−ve]) of this compound test set have been described elsewhere (Monroe et al., 2020), and a chemically reactive metabolite-based molecular initiating mechanism for DILI has been proposed in the literature or based on our internal data, for many of the positive drugs. Each compound was tested at a minimum of 3 concentrations, covering the range from a therapeutic level up to the maximum allowed by solubility. The liver exposure index, defined as the ratio of the in vitro test concentration to the estimated human liver inlet Cmax concentration, was used as a surrogate for safety margin to compare the in vitro BA-LRA responses among different drugs in the context of labeled maximum therapeutic clinical dose and exposure. As shown in Figure 2A, most DILI+ve drugs show a dose-dependent increase in the in vitro BA-LRA response that reaches the threshold of a positive score (0.20) at a relatively low liver exposure index. In contrast, most DILI−ve drugs did not exhibit an elevated BA-LRA even with increasing test concentrations or achieved a positive score only at an excessively high liver exposure index. With the criteria for DILI positives set at a BA-LRA score equal or greater than 0.20 at a liver exposure index of no greater than 3, the in vitro BA-LRA model demonstrates approximately 81% sensitivity and approximately 90% specificity in detecting drugs known to carry a high risk of human clinical DILI, with a positive predictive value > 0.9 and a negative predictive value > 0.7 (Figure 2B). The in vitro BA-LRA outcomes for individual compounds are summarized in Table 4 and the data are presented in greater detail in Supplementary Table 1. Assay outcomes could not be determined for 8 (approximately 9%) of compounds due to limited solubility and for 14 (approximately 15%) of compounds due to significant cytotoxicity which prevented the testing for in vitro BA-LRA activity at a concentration corresponding to a liver exposure index of at least 3 (Table 4). In the case of limited solubility or cytotoxicity preventing assessment of the transcriptional response to bioactivation at a concentration that exceeded 3-fold of liver inlet Cmax, the drug was considered inadequately tested and not regarded as tested positive or as tested negative. Among 50 DILI+ve drugs not limited by solubility (Table 4) 8 (16%) were cytotoxic at a liver exposure index of less than 3. Among 35 DILI−ve drugs not limited by solubility, 6 (17%) were similarly cytotoxic, leaving 71 compounds with adequate test data.
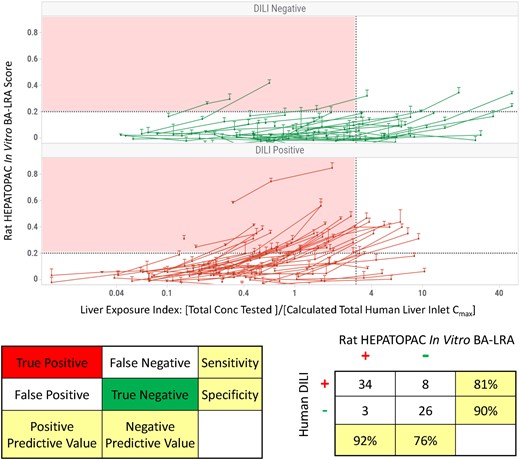
Internal qualification of rat HEPATOPAC in vitro bioactivation liver response assay (BA-LRA) model for drug-induced liver injury (DILI) risk assessment with a 93-compound test set. A total of 93 commercial and internal drugs (Table 4) with known truth for clinical DILI were evaluated in the rat HEPATOPAC in vitro BA-LRA. A, Each compound was tested in triplicates at 3 concentrations for 9 days of incubation. The liver exposure index is defined as the ratio of the concentration tested in vitro to the calculated human liver inlet Cmax concentration of each drug. Error bars represent standard deviations of at least 3 experimental replicates. B, Predictivity of the rat HEPATOPAC in vitro BA-LRA model for clinical DILI risk. The rat in vitro BA-LRA model considers a drug DILI positive when a BA-LRA score exceeds 0.20 at a liver exposure index of no greater than 3. Within the 93-compound test set, 71 were considered adequately tested (Table 4) and the in vitro BA-LRA model demonstrated approximately 81% sensitivity and approximately 90% specificity in detecting DILI+ve drugs. Assay outcomes could not be determined for approximately 9% of compounds due to limited solubility and for approximately 15% of compounds due to significant cytotoxicity which prevented the testing for BA-LRA activity at a concentration corresponding to a liver exposure index of at least 3.
Rat HEPATOPAC In Vitro Bioactivation Liver Response Assay (BA-LRA) Outcome of the 93 Compound Qualification Set
| DILI+ve Drugs | DILI−ve Drugs | ||||
|---|---|---|---|---|---|
| Drug | Rat HEPATOPAC in vitro BA-LRA | Comments | Drug | Rat HEPATOPAC in vitro BA-LRA | Comments |
| Alpidem | Pos | Amprenavir | Pos | ||
| Benoxaprofen | Pos | Lopinavir | Pos | ||
| Bosentan | Pos | Naproxen | Pos | ||
| Bromfenac | Pos | Ambrisentan | Neg | ||
| Carbamazepine | Pos | Aspirin | Neg | ||
| Chlormezanone | Pos | Atorvastatin | Neg | ||
| Clozapine | Pos | Buspirone | Neg | ||
| Cyproterone acetate | Pos | Caffeine | Neg | ||
| Etomoxir | Pos | Chloramphenicol | Neg | ||
| Fenclofenac | Pos | Cimetidine | Neg | ||
| Flutamide | Pos | Diltiazem | Neg | ||
| Nesbuvir (HCV-796) | Pos | Diphenhydramine | Neg | ||
| Idelalisib | Pos | Disopyramide | Neg | ||
| LY2886721 | Pos | Enalapril | Neg | ||
| Lumiracoxib | Pos | Entacapone | Neg | ||
| Metiamide | Pos | Furosemide | Neg | ||
| MK-0536 | Pos | Hydroxyzine | Neg | ||
| MK-0633 | Pos | Levofloxacin | Neg | ||
| MK-0679 | Pos | Meloxicam | Neg | Positive at a liver exposure index > 3 | |
| MK-0974 | Pos | Nifedipine | Neg | Positive at a liver exposure index > 3 | |
| MK-3207 | Pos | Olanzapine | Neg | Positive at a liver exposure index > 3 | |
| MK-3984 | Pos | Propranolol | Neg | ||
| Nefazodone | Pos | Raloxifene | Neg | ||
| Nelfinavir | Pos | Rosiglitazone | Neg | Positive at a liver exposure index > 3 | |
| Nomifensine | Pos | Sumatriptan | Neg | ||
| Ritonavir | Pos | Telmisartan | Neg | ||
| Sitaxsentan | Pos | Trimethobenzamide | Neg | ||
| Sudoxicam | Pos | Valsartan | Neg | ||
| Telithromycin | Pos | Zolpidem | Neg | Positive at a liver exposure index > 3 | |
| Ticlopidine | Pos | Ibuprofen | Not determined | [Highest conc tested] < 3× [I]in max | |
| Tienilic acid | Pos | Probenecid | Not determined | [Highest conc tested] < 3× [I]in max | |
| Tolvaptan | Pos | Pentoxifylline | Not determined | [Highest conc tested] < 3× [I]in max | |
| Troglitazone | Pos | Phenobarbital | Not determined | [Highest conc tested] < 3× [I]in max | |
| Valproic acid | Pos | Clarithromycin | Not determined | Cytotoxic | |
| Acetaminophen | Neg | Positive at a liver exposure index > 3 | Dipyridamole | Not determined | Cytotoxic |
| Clopidogrel | Neg | Positive at a liver exposure index > 3 | Metformin | Not determined | Cytotoxic |
| Diclofenac | Neg | Positive at a liver exposure index > 3 | Mibefradil | Not determined | Cytotoxic |
| Isoniazid | Neg | Paroxetine | Not determined | Cytotoxic | |
| Nevirapine | Neg | Verapamil | Not determined | Cytotoxic | |
| Pemoline | Neg | ||||
| Tasosartan | Neg | Positive at a liver exposure index > 3 | |||
| Zafirlukast | Neg | ||||
| Ethambutol | Not determined | [Highest conc tested] < 3× [I]in max | |||
| Felbamate | Not determined | [Highest conc tested] < 3× [I]in max | |||
| Ibufenac | Not determined | [Highest conc tested] < 3× [I] in max | |||
| MK-0571 | Not determined | [Highest conc tested] < 3× [I] in max | |||
| Amiodarone | Not determined | Cytotoxic | |||
| Azithromycin | Not determined | Cytotoxic | |||
| Benzbromarone | Not determined | Cytotoxic | |||
| Labetalol | Not determined | Cytotoxic | |||
| Lapatinib | Not determined | Cytotoxic | |||
| Saquinavir | Not determined | Cytotoxic | |||
| Tolcapone | Not determined | Cytotoxic | |||
| Trovafloxacin | Not determined | Cytotoxic | |||
Abbreviation: DILI, drug-induced liver injury.
Application of In Vitro BA-LRA to Differentiate Hepatotoxic and Liver Safe Drugs
To gain confidence in the utility of the in vitro BA-LRA in assessing the DILI risk of a drug candidate during the drug discovery process, we compared responses from sets of drugs (listed in Supplementary Table 3) with favorable liver safety profiles against responses from structurally or pharmacologically similar drug analogs that are well known to cause human hepatotoxicity and are believed to involve the formation of chemically reactive metabolites (Ritchie et al., 1980; Kenna et al., 2015; Rana et al., 2016; Stepan et al., 2011). These case examples, as described below, illustrate how the in vitro BA-LRA could be applied during lead identification to guide selection of chemical series with lower hepatotoxic potential, or during the lead optimization stage to guide structure-activity-relationship-based hypothesis testing to reduce DILI potential due to chemically reactive metabolite formation and thereby improve liver safety profiles of new drug candidates.
Examples of Drugs From Structurally Distinct Chemical Series
Sitaxsentan, bosentan, and ambrisentan are endothelin receptor antagonists from diverse chemical series with vastly different clinical DILI risk profiles. Sitaxsentan was withdrawn from the market due to DILI, bosentan carries a black box warning for hepatotoxicity, and ambrisentan appears to be devoid of liver toxicity. When the 3 compounds were tested in the rat HEPATOPAC at a similar concentration range, sitaxsentan and bosentan elicited a dose-dependent in vitro BA-LRA response with positive scores at 100 and 30 µM, respectively, whereas ambrisentan did not cause an effect at concentrations up to 100 µM (Figure 3A). Using the liver exposure index-based prediction model, sitaxsentan and bosentan were identified as positive for DILI risk as they produced positive in vitro BA-LRA responses at a liver exposure index less than 2, whereas ambrisentan was regarded as negative for bioactivation-mediated DILI risk as it showed no elevated BA-LRA at the highest tested concentration, a liver exposure index of 25× Figure 3B). A similar analysis was also performed for a pair of piperazine drugs with antidepressant activity, nefazodone and buspirone (Figs. 3C and 3D). The DILI+ve drug nefazodone displayed an in vitro BA-LRA signal at 30 µM which corresponds to a liver exposure index of less than 1, whereas buspirone had minimal effect at the same test concentration which equals a liver exposure index greater than 6. These exemplar data indicate that application of the in vitro BA-LRA during the lead identification stage of drug discovery would help select or prioritize chemical series with lower inherent DILI liability.
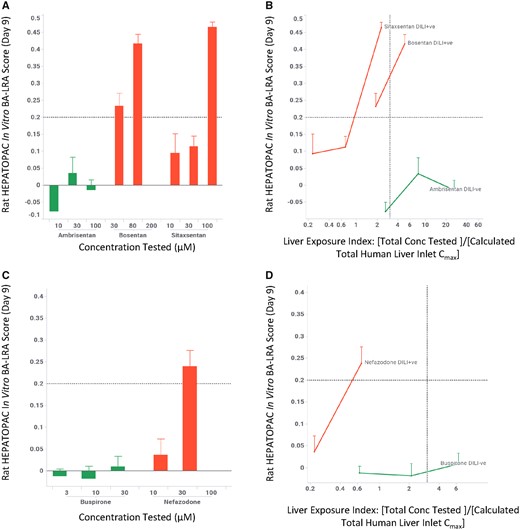
Rat HEPATOPAC in vitro LRA differentiates drug-induced liver injury (DILI) risk among different structural series from the same pharmacologic classes. Rat HEPATOPAC cultures were exposed to drugs at listed concentrations and harvested after 9 days. Gene expression changes of the 10 in vitro bioactivation liver response assay (BA-LRA) genes relative to endogenous controls were compared with concurrent vehicle controls and used to calculate BA-LRA scores as described in the Materials and Methods section. The liver exposure index was calculated as the ratio of total (free + bound) drug concentration tested in the HEPATOPAC to the estimated total Cmax drug concentration at the human liver inlet. Error bars represent standard deviations of at least 3 experimental replicates.
Examples of Structure-activity Relationship for Close Structural Analogs
In drug discovery, once a lead series is identified, drug candidates are further optimized to improve potency/pharmacokinetics/safety, as minor modifications of a chemical structure can often result in significant changes of such critical compound properties. We evaluated the ability of the in vitro BA-LRA model to distinguish close structural analogs using some well-known drug pairs, comparing their dose-response relationships. As shown in Figure 4, the drugs associated with higher metabolic risk, clozapine and alpidem, showed elevated in vitro BA-LRA responses whereas the lower risk analogs, olanzapine and zolpidem respectively, generated minimal or significantly reduced responses. Once normalized to the liver exposure, the higher risk drugs yield positive scores at relatively low liver exposure indices; whereas the safer drugs either did not show a positive response or only reach a positive threshold at a relatively high liver exposure index. Additional case examples (tasosartan vs valsartan, metiamide vs cimetidine) can be found in Supplementary Figure 4. These results demonstrate the utility of the in vitro BA-LRA in differentiating close structural analogs by their chemically reactive metabolism-mediated hepatotoxicity potential. Such an application can provide guidance to structure-activity-relationship-based hypothesis-driven DILI derisking efforts when evidence for chemically reactive metabolite formation raises a concern for a structural series.
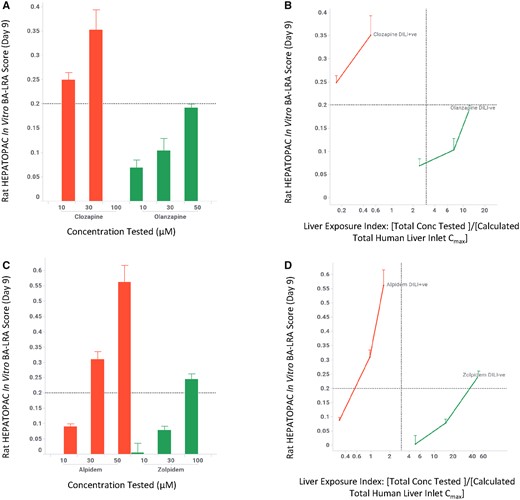
In vitro LRA differentiates drug-induced liver injury (DILI) risk of close structure analogs. Rat HEPATOPAC cultures were exposed to drugs at listed concentrations and harvested after 9 days. Gene expression changes of the 10 in vitro bioactivation liver response assay (BA-LRA) genes relative to endogenous controls were compared with concurrent vehicle controls and used to calculate BA-LRA scores as described in the Materials and Methods section. The liver exposure index was calculated as the ratio of total (free + bound) drug concentration tested in the HEPATOPAC to the estimated total Cmax drug concentration at the human liver inlet. Error bars represent standard deviations of at least 3 experimental replicates.
Drugs With Comparable In Vitro BA-LRA Profiles Differentiated by Exposure Margins
We observed that a number of hepatotoxic drugs and their nontoxic analogs displayed similar in vitro BA-LRA profiles when tested at similar concentrations in the rat HEPATOPAC. Drugs in this category include troglitazone versus rosiglitazone, sudoxicam versus meloxicam, lumiracoxib versus diclofenac, and ticlopidine versus clopidogrel (Figure 5 and Supplementary Figure 4). However, an examination of clinical doses and exposures of this group of drug pairs reveals that the higher risk compounds are noticeably always associated with significantly higher clinical doses and greater liver exposures. On the other hand, the more potent, lower dosed analogs show lower risk. That is, the in vitro BA-LRA profiles for the pairs of compounds were comparable at similar test concentrations, but the liver exposure index at which a positive BA-LRA was achieved in vitro was significantly lower for the higher risk drugs than that of their lower risk counterparts with greater therapeutic potency. This suggests that the differences in DILI risk profiles are being driven by pharmacologic target potency, and therefore the requisite therapeutic doses and clinical liver exposures (ie, lower doses have lower risk). These results agree with previously published reports on the bioactivation potential of these compounds (Stepan et al., 2011) and underscore the importance of taking potency, human clinical dose, and exposure into consideration when assessing the contribution of BA-LRA potential to DILI risk when using the in vitro rat HEPATOPAC BA-LRA model.
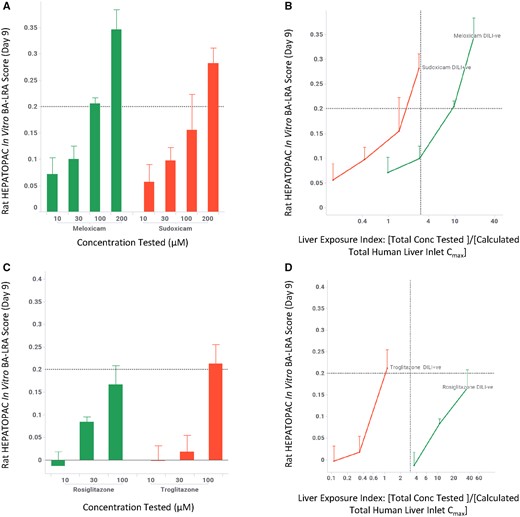
Drugs with comparable bioactivation liver response assay (BA-LRA) profiles in the rat HEPATOPAC differentiated by exposure margin. Rat HEPATOPAC cultures were exposed to drugs at listed concentrations and harvested after 9 days. Gene expression changes of the 10 in vitro BA-LRA genes relative to endogenous controls were compared with concurrent vehicle controls and used to calculate BA-LRA scores as described in the Materials and Methods section. The liver exposure index was calculated as the ratio of total (free + bound) drug concentration tested in the HEPATOPAC to the estimated total Cmax drug concentration at the human liver inlet. Error bars represent standard deviations of at least 3 experimental replicates. Abbreviation: DILI, drug-induced liver injury.
Mechanistic Studies Confirm the Involvement of Cytochrome P450 in Mediating the In Vitro BA-LRA Response
As the in vitro BA-LRA response is postulated to reflect the formation of chemically reactive metabolites following drug treatment, we reasoned that blocking the metabolic pathway responsible for bioactivation should attenuate or eliminate the BA-LRA signal. 1-Aminobenzo-triazole (ABT), a well-known P450 inhibitor, was coadministered (1 mM) with the test drug during the HEPATOPAC incubation and was able to inhibit the formation of oxidative metabolites (greater than 95% inhibition for MK-3207, eg). We also tested siRNA-mediated knockdown of Cytochrome P450 reductase (POR) and Cytochrome b5 (CYB5) which are known cofactors for P450-mediated reactions (Reed et al., 2018). Pre- and coincubation with these siRNAs in the HEPATOPAC showed greater than 85% reduction in the target mRNA levels and significantly reduced the formation of P450-mediated metabolites (approximately 70% reduction for MK-3207, eg). As shown in Figure 6, acetaminophen and MK-3207, when exposed alone at selected concentrations to the rat HEPATOPAC, elicited strong in vitro BA-LRA responses which could be effectively attenuated by the cotreatment with ABT (1 mM) or by siRNA-mediated knock down of P450 cofactors, indicating dependence on P450-mediated metabolism in driving the positive BA-LRA response. In contrast, the in vitro BA-LRA response for bardoxolone was not affected by either ABT or siRNA treatment, confirming the lack of dependency on P450 biotransformation for its BA-LRA signal. ABT (1 mM) or POR/CYB5 siRNA alone elevated baseline levels of BA-LRA gene expression slightly, but did not result in positive in vitro BA-LRA in the rat HEPATOPAC (Figure 6).
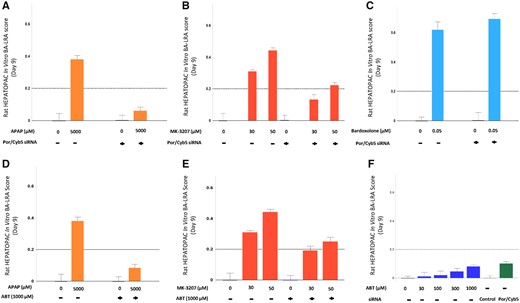
Inhibition of P450 attenuates chemically reactive metabolite-mediated in vitro bioactivation liver response assay (BA-LRA) responses. Rat HEPATOPAC cultures were treated with either the P450 inhibitor, 1-aminobenzo-triazole (ABT) at 1 mM, or pre- and cotreated with POR and CYB5 siRNAs for 9 days to inhibit P450-mediated metabolic activities. Error bars represent standard deviations of 3 experimental replicates. For BA-LRA responses determined following treatment with drug + ABT, or drug + siRNA, the data are expressed relative to ABT alone or siRNA alone, respectively as controls.
Rat In Vitro BA-LRA Response Reproducibility and Baseline Control Variability
To monitor the performance and reproducibility of the in vitro BA-LRA, 2 positive controls (sitaxsentan and MK-3207 each at a single concentration of 100 and 30 µM, respectively) were included in each test plate. Results from experiments conducted over 4 years across 3 different mixed-donor hepatocyte lots showed no significant differences in the BA-LRA response among different lots. For these 3 different rat HEPATOPAC lots (4231, 4267, 6132) means ± standard deviations (n = number of independent biological replicates) for the sitaxsentan positive control for example, were 0.35 ± 0.05 (n = 83), 0.36 ± 0.08 (n = 65), and 0.34 ± 0.05 (n = 333). The assay performance over time was also evaluated across different production lots for a single mixed donor lot (6132) over a period of approximately 2 years. For both positive controls, the average coefficient of variation for intrastudy was generally less than 10% whereas the coefficient of variation for interstudy was approximately 15% for a total of 25 separate studies. The control variability from these studies was used to help establish that the baseline variability is well below the set in vitro BA-LRA threshold of 0.2. Across all of these studies the mean ± standard deviation for vehicle controls was 0.00 ± 0.03 (n = 481), and a 6.5× standard deviation (our current BA-LRA threshold of 0.20) gave a confidence internal of nearly 100% (1 in approximately 12 billion frequency for outliers) in distinguishing real signal versus noise.
Development and Application of Human In Vitro BA-LRA
We sought to develop a human HEPATOPAC-based in vitro BA-LRA, similar to the rat in vitro assay. Briefly, RNA-Seq data (accessible through GEO Series accession number GSE150069) for 6 model compounds (bardoxolone, beta-naphthoflavone, MK-3207, ticlopidine, clarithromycin; and warfarin) tested in 5-day incubations of human HEPATOPAC were used to assess the responsiveness of human orthologs of the previously reported in vivo rat liver BA-LRA coexpression gene network (Monroe et al., 2020) in human HEPATOPAC. The 10 most upregulated genes from this network in both the RNA-Seq and PCR-based data were selected as the human in vitro BA-LRA signature gene set (Table 1). The same 93-compound test set was then evaluated in the human HEPATOPAC from 1 single donor (3121A), and a smaller subset of 16 compounds was retested using HEPATOPAC from a second single human donor (4106) in a 9-day repeat dose experiment using the study same design as the rat. Both donors were Caucasian females, 52 and 21 years of age, respectively, with medical history including respiratory diseases, tobacco, and drug use. Although for the majority of the test compounds, the BA-LRA responses were similar between human and rat, some appreciable differences were observed between the 2 species as well as between the 2 human donors (Table 1 and Supplementary Table 1 and Figure 1). Among BA-LRA genes, gene expression fold changes were generally greater in the rat HEPATOPAC than those of the human HEPATOPAC (Supplementary Table 1). Furthermore, 6 compounds from the 93 compound test set produced different in vitro BA-LRA responses in rat and human HEPATOPAC and as a result, predicted different DILI outcomes (Supplementary Table 1). Two of these 6 compounds, namely zafirlukast (DILI+ve) and diltiazem (DILI−ve) show responses in human which are absent in rat HEPATOPAC, whereas benoxaprofen (DILI+ve), etomoxir (DILI+ve), clopidogrel (DILI+ve), and naproxen (DILI−ve) show responses in rat that are not apparent in human HEPATOPAC.
We investigated whether differences in metabolism profiles between the rat and human HEPATOPAC could account for the species differences seen in some of the in vitro BA-LRA responses. A case study is presented here for clopidogrel (Figure 7). When tested in vitro at 100 µM (approximately 6× human Iinlet, max), clopidogrel produced a positive BA-LRA response in the rat but not the human HEPATOPAC (Figure 7A). Metabolite profiles from these HEPATOPAC incubations showed significant differences between the rat and human systems (Supplementary Figure 3). In the human HEPATOPAC, a higher turnover of the parent drug was seen with hydrolysis metabolites generated through the esterase pathway, in agreement with the metabolism profile seen in vivo in human subjects (Anderson et al., 2010; FDA label, available at https://www.accessdata.fda.gov/drugsatfda_docs/label/2016/020839s062s064lbl.pdf, last accessed April 8, 2020). In contrast, a lower turnover of the parent drug was noted in the rat HEPATOPAC with significantly higher amounts of P450-mediated metabolites, suggesting the P450-mediated pathway accounts for the rat BA-LRA response. To further evaluate this hypothesis, we tested known metabolites from these 2 metabolic pathways in rat HEPATOPAC (Figs. 7B and 7C). A positive in vitro BA-LRA response was seen with the P450-mediated thiolactone metabolite as well as the parent compound at 100 µM, but not with the hydrolysis metabolite SR26334, supporting a conclusion that the positive in vitro rat BA-LRA response is P450 mediated. This agrees with the known pharmacological action of clopidogrel being through a chemically reactive metabolite generated via P450. These data indicate that species differences in metabolic flux result in a blunted bioactivation response in the human HEPATOPAC, and DILI risk for clopidogrel likely is directionally lower in humans than the rat model predicts. This is consistent with the hypothesis proposed by Stepan et al. (2011) as to why clopidogrel is not associated with a high incidence of DILI despite having a documented low incidence reactive metabolite liability (LiverTox database, https://www.ncbi.nlm.nih.gov/books/NBK547852, last accessed April 8, 2020) and a moderate clinical dose. It is important to point out though that not all the species differences in the in vitro BA-LRA responses that were observed could be explained by metabolism differences. For example, no significant species differences in metabolite profiles were seen for naproxen and yet very different BA-LRA outcomes were observed (Supplementary Table 1). These comparative results between rat and human suggest that a human HEPATOPAC-based BA-LRA model may provide more human-relevant risk assessment, particularly when there are known species differences in drug metabolism and xenobiotic responses.
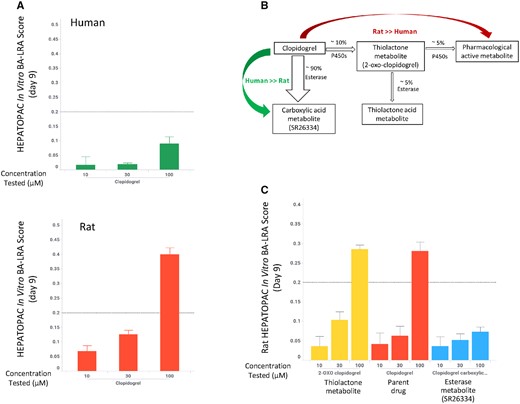
Differential bioactivation liver response assay (BA-LRA) responses of clopidogrel in the human and rat HEPATOPAC. A, Clopidogrel produced a positive BA-LRA response in the rat but not the human HEPATOPAC at 100 µM. HEPATOPAC cultures were exposed to clopidogrel at listed concentrations and harvested after 9 days. HEPATOPAC in vitro BA-LRA scores were calculated as described in the Materials and Methods section. Error bars represent standard deviationss of 3 experimental replicates. B, Clopidogrel metabolism pathways in human. C, The P450-mediated thiolactone metabolite and the parent compound, not the hydrolysis metabolite SR26334, elicited a positive BA-LRA response in the rat HEPATOPAC at 100 µM.
Quantitative differences in human in vitro BA-LRA responses were also observed among different single donor lots (Supplementary Figure 1). Using the liver exposure index-based model, these quantitative differences could potentially translate into different risk levels estimated for the same test compound, suggesting that including multiple donors or using a pooled human hepatocyte-based HEPATOPAC model could reduce donor variability and be developed for more routine screening when donor differences are not critical for the in vitro human BA-LRA.
DISCUSSION
To help mitigate against DILI risk surfacing late in drug development, we established a resource-sparing and moderately high-throughput 9-day in vitro assay using the rat HEPATOPAC to derisk early for the potential of drug candidates to generate a high burden of chemically reactive metabolites. An evaluation of 93 DILI+ve and DILI−ve drugs using this model demonstrated approximately 81% sensitivity and approximately 90% specificity in detecting drugs with a higher potential for chemically reactive metabolite-mediated hepatotoxicity. This in vitro rat BA-LRA has been successfully utilized to support internal programs to identify preferential chemical series with lower BA-LRA risk, to identify and eliminate toxicophores responsible for driving positive in vivo rat BA-LRA signals (Monroe et al., 2020) seen in certain structural series, and to guide structure-activity relationship strategies to reduce the bioactivation potential from lead candidates. As we have adopted the model for internal use, confidence in the approach has grown steadily among stakeholders as favorable results from prospective evaluations has expanded acceptance.
Advantages and Disadvantages of the In Vitro BA-LRA Versus Other Methods of Detecting Chemically Reactive Metabolite Formation
Formation of chemically reactive metabolites has been frequently linked to certain drug-induced adverse reactions in the clinic, such as DILI, agranulocytosis, lymphocytopenia, and skin reactions. To minimize the potential for chemically reactive metabolite formation in the drug discovery pipeline, several different approaches have been employed by various pharmaceutical companies, including covalent protein binding, electrophile trapping, and time-dependent P450 inhibition (Sakatis et al., 2012). Although these assays can be useful for hazard identification, their utility in quantitative DILI risk assessment is somewhat limited, partially due to their inability to capture the complexity of competing toxic versus innocuous metabolism pathways, and more importantly, downstream compensatory cellular responses, and toxicological consequences in normal living hepatocytes at the exposure level relevant to human clinical use. The in vitro BA-LRA offers several advantages over these traditional methods, as this toxicogenomics signature-based approach developed in a more physiologically relevant and stable liver cell culture system (HEPATOPAC) provides a holistic readout of cellular stress or adaptive responses to insults caused following the formation of chemically reactive metabolites from drug treatment durations that can be maintained for 9 days. In addition, the concentration-dependent transcriptional signature response can be interpreted in the context of projected human liver exposures to guide dose and exposure-based clinical risk assessment. Furthermore, this approach does not require generation of radiolabeled compounds, so structure-activity relationship hypotheses are more readily testable and can be easily adapted to adeptly guide medicinal chemistry strategy. A disadvantage of HEPATOPAC is the 9-day study duration as compared with more rapid turnaround approaches.
The case examples presented in this paper illustrate some of the compelling performance advantages of the in vitro BA-LRA whereas other traditional methods have failed to provide compound differentiation. For example, clozapine is associated with a high incidence of hepatotoxicity and life-threatening agranulocytosis, whereas olanzapine does not exhibit these adverse effects. Previous reports suggested a reactive iminium metabolite was formed by both drugs, and their profiles were indistinguishable in the extent of covalent binding and glutathione adduct formation in vitro (Nakayama et al., 2011). However, in the HEPATOPAC BA-LRA, we observed a significant difference between these 2 drugs when tested at similar concentrations. A positive BA-LRA was seen with clozapine at a test concentration of ≤ 10 µM (liver exposure index ≪ 1×) but not with olanzapine until the test concentration reached 50 µM (liver exposure index ≫ 10×) (Figure 7). Another example is the liver safe drug buspirone which was identified as a false positive for DILI based on covalent-binding data, as it showed covalent binding similar to the hepatotoxic drug nefazodone even after adjusting for total daily body burden (Bauman et al., 2009). In rat HEPATOPAC, buspirone did not cause a positive BA-LRA signal at 30 µM (liver exposure index approximately 6×), whereas nefazodone showed a strong signal at the same concentration (liver exposure index < 1×) indicating very different DILI potential between these 2 drugs at their therapeutic doses.
Mechanism-based DILI Risk Assessment Versus In Vitro Cytotoxicity
Our DILI derisking strategy focuses on reducing mechanism-based liabilities in drug candidates, such as formation of chemically reactive metabolites (Monroe et al., 2020), hepatic transporter inhibition/bile acid accumulation (Hafey et al., unpublished data; Li et al., 2019), and mitochondrial dysfunction (Xu et al., 2019). For the 93 drugs we have evaluated, there was generally a lack of correlation between clinical DILI risk and in vitro cytotoxicity at similarly relevant clinical liver exposure margins in the HEPATOPAC, as similar percentages of compounds were cytotoxic at relevant concentrations among both DIL+ve and DILI−ve categories (Table 4). This is in contrast with a good separation of clinically hepatotoxic and nonhepatotoxic drugs by the in vitro BA-LRA model, suggesting that mechanistic agnostic compound-induced cytotoxicity in the rat HEPATOPAC may not always be as informative. This is consistent with observations made previously by Schadt et al. (2015) but differs from findings by others (Khetani et al., 2013; Proctor et al., 2017; Shah et al., 2015). The discrepancy among investigators could result from the differences in compound selection by various groups for model validation, as we have primarily focused on drugs that cause DILI suspected to derive through a chemically reactive metabolite mechanism. We did observe, however, significant changes in cytotoxicity parameters in the rat HEPATOPAC (AST/LDH/GLDH/Urea) following treatment with DILI-positive drugs (unlikely due to chemically reactive metabolites) such as trovafloxacin and tolcapone, whereas minimal cytotoxicity was seen with DILI-negative analogs such as levofloxacin and entacapone (Supplementary Table 1). Further effort is needed to understand the implications of drug-induced cytotoxicity without an associated mechanistic signal in the HEPATOPAC model for DILI risk assessment. It is also likely that different experimental conditions contribute to different outcomes. For example, we used 10% serum, whereas other groups have chosen to treat cells in serum-free condition. Significant differences are seen in unbound drug concentrations between those conditions, particularly for highly protein bound drugs, which could account for some discrepancy in cytotoxicity findings. Pleiotropic benefits of serum on general cell health may also contribute to observed differences. For example, Ware et al. (2017) evaluated 8 of the same compounds in human HEPATOPAC (7 days) that we also evaluated in our human HEPATOPAC BA-LRA (9 days). We compared gene expression changes in genes commonly reported including P450 enzyme induction and NRF1/NRF2 activation pathways. As Ware et al. used a serum-free condition, we estimated unbound drug concentrations in our system and only 2/8 compounds (rosiglitazone and nefazodone) were tested in a similar range. Although we calculate comparable mRNA induction for CYP2C8, CYP3A4 between the 2 studies, we observed robust BA-LRA signals with these 2 compounds, whereas NRF1/NRF2 gene responses deduced from their gene expression results were blunted or absent. Lack of serum has been noted previously to result in a decline of HEPATOPAC functions (Khetani et al., 2013; Ware et al., 2017).
In Vitro Models Development
In recent years significant progress has been made in the development of advanced in vitro liver models. Among these models, the micropatterned coculture of a primary hepatocyte (HEPATOPAC) system was chosen because it closely emulates and maintains in vivo liver-like functionalities over a relatively long period of time as demonstrated by the functional characterization presented in this study (albumin/urea production rate and transcriptomics analysis, shown in Table 2 and Figure 1) and favorable drug metabolism profiles published by other groups (Khetani and Bhatia, 2008; Kratochwil et al., 2017; Wang et al., 2010). While future advances in replicating zonal compartmentation, separating blood and bile flow, and including diverse cell types may expand utility, we have demonstrated practical utility for drug screening with the current and less complex HEPATOPAC model system.
With the current 96-well HEPATOPAC format, up to 60 compounds per study can be tested with limited automation at 3 concentrations and in triplicates using 15 96-well HEPATOPAC plates. To implement this model in a higher throughput fashion where hundreds of compounds can be screened simultaneously, development of a new HEPATOPAC 384 well format and advanced automation will be needed. The Rat HEPATOPAC has become a core DILI derisking tool and is being used in conjunction with the in vivo rat BA-LRA, to leverage the fact that both in vitro and in vivo transcriptomics biomarkers and drug metabolite formation can be corroborated in these 2 test systems from the same species. At the present time human HEPATOPAC is reserved for when significant species differences in metabolism are suspected based on results from metabolism screening studies, and directional guidance is needed for DILI risk assessment. Human HEPATOPAC is anticipated to play a more routine role as an optimized human model from pooled donors becomes available and contribution from donor differences is better characterized.
SUPPLEMENTARY DATA
Supplementary data are available at Toxicological Sciences online.
ACKNOWLEDGMENTS
We thank Dr Joseph DeGeorge for his feedback and support of the project, members of our Clinical Pathology group for conducting medium cytotoxicity endpoint measurements, Dr Andreas Baudy and Dr Theresa Nguyen for the generation of RNA samples for RNA-Seq experiment, Katerina Vlasakova, Yan Yu, John Barnum, Elizabeth Freeland, Krista Striano, and Lei Zhu for their technical assistance. The authors also acknowledge the scientific input and technical support provided by the current and previous members of BioIVT team.
DECLARATION OF CONFLICTING INTERESTS
The authors declared no potential conflicts of interest with respect to the research, authorship, and/or publication of this article.

Comments