


Abstract
Mitochondrial dysfunction is a common cause in pathophysiology of different neurodegenerative diseases. Elimination of dysfunctional and damaged mitochondria is a key requirement for maintaining homeostasis and bioenergetics of degenerating neurons. Using global microRNA (miRNA) profiling in a systemic rotenone model of Parkinson’s disease, we have identified miR-146a as upmost-regulated miRNA, which is known as inflammation regulatory miRNA. Here, we report the role of activated nuclear factor kappa beta (NF-kβ) in miR-146a-mediated downregulation of Parkin protein, which inhibits clearance of damaged mitochondria and induces neurodegeneration. Our studies have shown that 4-week rotenone exposure (2.5 mg/kg b.wt) induced oxidative imbalance-mediated NF-kβ activation in 1‐year‐old rat’s brain. Activated NF-kβ binds in promoter region of miR-146a gene and induces its transcription, which downregulates levels of Parkin protein. Decreased amount of Parkin protein results in accumulation of damaged and dysfunctional mitochondria, which further promotes the generation of reactive oxygen species in degenerating neurons. In conclusion, our studies have identified direct role of NF-kβ-mediated upregulation of miR-146a in regulating mitophagy through inhibition of the Parkin gene.
Systemic exposure of rotenone produces most of the cellular and molecular features of Parkinson’s disease (PD) and is considered as one of the best models to study the mechanism of PD pathogenesis (Cannon et al., 2009). Genes associated with PD (Parkin, Pink-1, LRRK 2, DJ-1, etc.) interfere with mitochondrial function, morphology, and dynamics (Deas et al., 2011; Narendra et al., 2009; Vives-Bauza and Przedborski, 2011). Mitochondria are multifunctional organelles, primarily responsible for energy production via oxidative phosphorylation and have substantial roles in regulating survival, death, signaling, and inflammatory pathways of cells (Kösel et al., 1999; Sherer et al., 2002a). Rotenone, a potent inhibitor of mitochondrial respiratory chain complex I, induces accumulation of reactive oxygen species (ROS) similar to PD (Radad et al., 2006; Sherer et al., 2003a,b).
Severely compromised removal of damaged mitochondria promotes accumulation of dysfunctional mitochondria and oxidative imbalance in neurons of PD brains (Greenamyre et al., 2003; Radad et al., 2006). Studies using genetic-models or chemical based animal and cellular models as well as human postmortem tissues have confirmed impaired mitophagy in degenerating neurons of PD brain, which might be a crucial promoting factor for aggregation of misfolded proteins and synaptic dysfunction (Gao et al., 2017; Ryan et al., 2015). Damaged and dysfunctional mitochondria are removed by the ubiquitin-proteasome system, which eliminates mitochondrial outer membrane proteins or by the autophagy-lysosome pathway, which degrades mitochondria as whole organelles called mitophagy (Kim et al., 2007; Pickrell and Youle, 2015). PINK1 (PTEN-induced putative kinase 1) and Parkin (PARK2) are 2 major proteins, which regulate mitophagy in mammalian cells (Chen and Dorn, 2013; Ivankovic et al., 2016).
Loss of mitochondrial membrane potential (MMP) and increased oxidative stress accumulates PINK1 on the outer mitochondrial surface, where it induces the recruitment and translocation of Parkin from the cytosol to damaged mitochondria (Ashrafi and Schwarz, 2013; Durcan and Fon, 2015). After translocating to mitochondria, the E3-ubiquitin ligase activity of Parkin induces the degradation of various mitochondrial membrane and matrix proteins. Several studies have linked mutations in PINK1 and Parkin genes with a higher percentage of PD occurrence in humans (Deng et al., 2008; Lücking et al., 2000; Pickrell and Youle, 2015; Savitt et al., 2006; Venderova et al., 2009). Also, genetical studies carried out in fly model suggests that both PINK1 and Parkin are prerequisite for mitochondrial integrity and loss of either PINK1 or Parkin promotes mitochondrial dysfunction resulting in degeneration of flight muscles and dopaminergic neurons (Deng et al., 2008; Koh and Chung, 2012). However, upregulation of the Parkin gene promotes neuronal survival during PD (Sun et al., 2018).
Role of mitochondrial dysfunction in PD has been demonstrated by several labs and few compounds like CoQ10, which inhibit mitochondrial dysfunction have also reached to clinical trials generates appeal for studying the role of microRNAs (miRNAs) in neurodegeneration and mitochondrial dysfunction (Thomas and Beal, 2010). Studies carried out in our laboratory and elsewhere have demonstrated a substantial role of miRNAs in the regulation of neural development and neurodegeneration (Jauhari et al., 2017, 2018a,b; Jauhari and Yadav, 2019; Lau and Hudson, 2010; Pandey et al., 2015a,b; Singh et al., 2014; Singh and Yadav, 2020; Yadav et al., 2011). Dicer knockdown and knockout studies have shown the essential roles of miRNAs in neuronal development and neuronal cell death (Giraldez et al., 2005; Kawase‐Koga et al., 2009). Interestingly, differentiating and developing neurons are regulated by the expression of several miRNAs, which are controlled by transcription factors with feedback loop formation (Jauhari et al., 2018a,b; Pandey et al., 2015a,b; Yadav et al., 2011). Although several studies have attempted to identify the miRNAs as biomarkers for PD development, most of the studies have identified a different set of miRNAs. Studies, which involve functional aspects of PD and use chemical-induced systemic models of PD, are required to get a correlation between deregulation of miRNA expression and PD pathogenesis.
In this study, we have performed global miRNA profiling in aged rat brain given systemic exposure of rotenone and identified set of miRNAs deregulated with PD pathogenesis. Furthermore, we have carried out several studies to demonstrate the role of miR-146a in the suppression of mitophagy via targeting and inhibition of expression of Parkin.
MATERIALS AND METHODS
Chemicals
Culture medium and all materials required for cell culture and real-time PCR and miRNA isolation including TaqMan Low-density Array (TLDA), miRVana, individual miRNA assays, reverse transcription (RT) kit, preamplification master mixture, TaqMan universal master mixture, were procured from Thermo Fisher Scientific. For transfecting cells, DharmaFECT1 reagent (T200102) from Dharmacon was used. Nontarget control (NTC) was procured from Dharmacon, Pittsburgh, Pennsylvania. Mimics and inhibitors of miRNAs were obtained from Thermo Fisher. Antibodies DJ-1, PINK1, PARKIN, NF-kβ (nuclear factor kappa beta) were procured from cell signaling technologies. Antibody against β-Actin, LC3a/b, and rotenone were procured from Sigma-Aldrich, St. Louis, Missouri. Antibody for tyrosine hydroxylase (TH) was procured from Stem Cell Technologies, Vancouver, British Columbia, Canada. Infrared-labeled secondary antibodies were obtained from LI-COR Biosciences, Lincoln City, Nebraska. All other regular chemicals were purchased from Sigma-Aldrich.
Culture, differentiation, chemical exposure, and transfection of neurons
SH-SY5Y cells were obtained from ATCC, were grown in MEM/F12 with 10% fetal bovine serum, nonessential amino acid, and 1% antibiotic and antimycotic solution. Cells were kept in 5% CO2–95% atmosphere with high humidity at 37°C. SH-SY5Y cells were differentiated as described in our earlier publications (Jauhari et al., 2017, 2018b). In brief, SH-SY5Y cells were differentiated by exposing them with retinoic acid (RA) (10 μM) for 5 days, followed by 3-day brain-derived neurotrophic factor (BDNF) (100 ng/ml) exposure. After 5 days of RA exposure, cells were washed with PBS and cell culture media was replaced with media containing BDNF (100 ng/ml) but no serum. Cell culture media of differentiating cells were replaced every alternate day with fresh media containing 10 μM RA (up to 5 days) or 100 ng/ml BDNF (3 days after RA).
Animals
Albino Wistar rats were obtained from the animal house facility of CSIR-Indian Institute of Toxicology Research (IITR), Lucknow. All the animals were maintained on a commercial pellet diet and water ad libitum in a temperature controlled room with a 12/12-h light/dark cycle and cared for in accordance to the policy laid down by Animal Care Committee of CSIR-IITR. The ethical committee of the CSIR-IITR approved animal experimentation.
Rotenone treatment
Rotenone was first dissolved in 100% dimethyl sulfoxide as a ×50 stock solution, which was further diluted in corn oil to obtain a final concentration of 2.5 mg/ml. The fresh solution was prepared 2 times/week, stored in vials of amber color, and mixed by inversion of vials several times before injection. Rotenone was injected intraperitoneally 2.5 mg/kg body weight at a volume of 1 ml/kg, and control animals received the vehicle only. Rotenone was administered in 1‐year‐old rats for 4 consecutive weeks (5 days/week). Experimental groups comprised 7 animals, with an additional 10 animals for behavioral studies.
Neurobehavioral studies
Spontaneous locomotor activity (SLA) was performed to study the locomotor deficits induced by rotenone in 1‐year‐old rats. Four-week rotenone (2.5 mg/kg) exposed 1‐year‐old rats along with their vehicle controls were monitored for SLA to measure the locomotor impairments. Ten animals from each group were observed individually in the activity monitoring cage. After acclimatization of 1 min, motor activity was recorded in terms of total distance traveled, moving time, resting time, numbers of rearings, and stereotypic count for 5 min.
RNA isolation and real-time PCR
miRVana miRNA isolation kit was used to isolate total RNA containing small RNAs as described by the manufacturer. For global profiling of miRNAs, Rodent TLDA of Applied Biosystems was used. RT and preamplification were carried out using Megaplex RT Primers (Rodent Pool Set v3.0) and Megaplex PreAmp Primers (Rodent Pool Set v3.0) and miRNA RT kit. RT, preamplification, and real-time PCR were carried out as described in our earlier publications (Jauhari et al., 2017; Pandey et al., 2015b; Yadav et al., 2011). Real-time PCR for all the genes was carried out by using SYBR Green chemistry in RT prepared with high capacity cDNA kit of Thermo Fisher, California. Sequences detail of primers used in real-time PCR is described in Supplementary Table 1.
Western blotting, immunohistochemistry, immunocytochemistry, and live cell imaging
The total cell lysates preparation and Western blotting was performed as described in our earlier studies (Pandey et al., 2015b; Yadav et al., 2011). After electrophoresis, proteins were transferred to low background PVDF membrane and blocked with 5% nonfat milk for 1 h at room temperature. After blocking, overnight incubation was carried out with primary antibody at 4°C. After multiple washing, membranes were incubated in IR dye-conjugated secondary antibody for 1 h. After 3 wash of 10 min each, membranes were scanned using LI-COR ODYSSEY CLx machine.
For the immunohistochemical studies, brains of 4-week rotenone exposed rats were perfused at the time of dissection with 4% paraformaldehyde (PFA) and cold PBS. Brains were stored in 4% paraformaldehyde. Sections (20 µM) were sliced in Thermo microtome at −20°C of substantia nigra (SN) region. Sections were stored in PBS at 4°C. Sections were washed 3 times (10 min each time) with PBST and incubated in citrate buffer for 25 min at 60°C for antigen retrieval followed with 3 wash of PBST (10 min each). After that sections were blocked with 3% BSA + 0.1% Tween20 for 2 h at room temperature and were incubated with anti-SNCA primary antibody for overnight at 4°C with gentle shaking. After primary antibody incubation, sections were washed with PBST and incubated with fluorophore-labeled appropriate secondary antibody at room temperature for 2 h with gentle shaking. Again, sections were washed with PBST and mounted with DAPI antifade and images were captured at ×100 magnification using Nikon Eclipse 80i upright Fluorescence microscope equipped with Nikon DS-Ri1 12.7-megapixel camera, Japan. For immunocytochemical studies SH-SY5Y cells were fixed with 4% PFA for 20 min and washed with PBS 3-time followed by incubation in 0.1% TritonX100 in PBS for 15 min to permeabilize the membrane. After permeabilization, cells were washed with PBS 3-time and blocked with 10% donkey serum for 45 min followed by overnight incubation in primary antibody at 4°C. After primary antibody incubation, cells were washed 3 times with PBS and incubated in secondary antibody for 2 h at room temperature. Finally, cells were washed 3 times with PBS and DAPI (nuclear stain) with antifade was added on cells. Images were captured using a fluorescent microscope. Live cell imaging was performed to analyze the mitochondrial structure. CellLight Mitochondria-GFP, BacMam 2.0 from Thermo Fisher was utilized to image mitochondria in live cells according to the manufacturer.
Transmission electron microscopy
Vehicle control and rotenone exposed rats were anesthetized with diethyl ether were perfused with PFA (4%) and glutaraldehyde (0.1%) solution. Substantia-nigra region was isolated from perfused brain and cut into fine pieces (1 mm). Primary fixation of tissues was carried out for 4 h in glutaraldehyde (2.5%) prepared in sodium cacodylate buffer (0.1 M, pH 7.2). After fixation, tissues were washed 3 times with sodium cacodylate buffer and postfixed in 1% Osmium tetroxide for 4 h. Postfixed tissues were washed with sodium cacodylate buffer, dehydrated in acetone series (15%–100%), and embedded in Araldite-dodecenyl succinic anhydrite (DDSA; hardener) mixture. After embedding, blocks were processed as described in our earlier studies (Yadav et al., 2017).
ROS accumulation and MMP estimation
ROS accumulation in SH-SY5Y cells were measured by using DCFDA according to manufacturer. Briefly, 20 µM DCFDA were added to experimental cells along with their respective controls and incubated 45 min at 37°C with 5% CO2 in the dark. After incubation cells were washed with ×1 PBS and measure fluorescence Ex/Em = 485/535 nm immediately. For MMP estimation JC-1 was used. Cells were incubated in JC-1 (2 µg/ml) for 10 min at 37°C in the dark. Include blank wells (with nonstained cells). After incubation cells were washed with ×1 PBS and fluorescence were measured at Ex/Em= 535/590 nm and Ex/Em= 485/535 nm simultaneously.
In silico studies
In silico miRNA target prediction was performed by using TargetScan online web portal. Gene ontology (GO) pathway analysis was performed to verify predicted target genes against the PANTHER DNA database (http://pantherdb.org/, last accessed November 8, 2019). In brief, all predictive targets of miR-146a were fetched using TargetScan web portal. All predictive targets of miR-146a were analyzed using PANTHAR DNA database for their prospective GO pathway analysis, cellular component analysis and biological process analysis.
Statistical analysis
The Student’s t test was employed to calculate statistical significance. p < .05 in Student’s t test was considered as significant.
RESULTS
Rotenone-induced Cellular, Molecular, and Neurobehavioral Changes in Aged Rat Brain
Immunohistochemical assay with anti-SNCA antibody has shown substantial levels of accumulated alpha-synuclein (SNCA) in SN region of brains of 1‐year‐old rats given systemic exposure of rotenone (2.5 mg/kg b.wt; ip) (Figure 1A). Real-time PCR studies have shown a significant time-dependent decrease in expression of DJ-1, PINK1, Parkin, and TH genes in the SN of rats exposed with rotenone for 1, 2, or 4 weeks (Figure 1B). Similar to mRNA expression, levels of proteins are also decreased after systemic exposure with rotenone in 1‐year‐old rats (Figure 1C). SLA test carried out in rats exposed with rotenone for 4 weeks have significantly inhibited total travel distance, time moving, stereotypic counts, and rearing, while time resting was significantly increased (Figs. 2A–E). Exposure of rotenone to 1‐year‐old rats also significantly decreased the weight of rats in a time-dependent manner (Figure 2F). Ultrastructure imaging carried out by transmission electron microscopy (TEM) in SN of 4-week rotenone exposed brains indicated distortions in structures of mitochondria and myelin sheath (Figs. 3A–D). Analysis of TEM images has shown the presence of rounded, spherical, or oval shape mitochondria in SN of rotenone exposed rats in comparison with filamentous mitochondria in vehicle control rats (Figs. 3A and 3B). Rotenone exposure induced degeneration or disruption of myelin in SN of rat brains (Figure 3D).
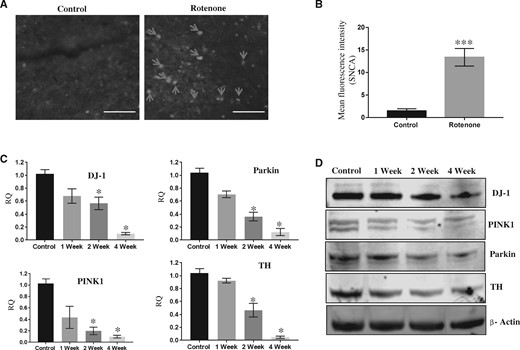
Rotenone exposure induced Parkinson’s disease like cellular and molecular alterations in aged rat brains. (A) Images and (B) bar graph of immunohistochemical analysis of SNCA accumulation in substantia nigra (SN) of control or 4-week rotenone exposed 1‐year‐old rats. Scale bar 25 µM. C, Real-time PCR-based relative quantification (RQ) of mRNA of DJ-1, PINK1, Parkin, and tyrosine hydroxylase (TH) in total RNA isolated from SN of control or 1-, 2-, and 4-week rotenone exposed rats. D, Western blots of DJ-1, PINK1, Parkin, TH, and β-Actin in SN of control or 1-, 2-, and 4-week rotenone exposed rats. Rotenone 2.5 mg/kg b.wt 6 days in a week in 1‐year‐old rats. Student’s t test was performed to calculate significance. Mean fluorescence intensity was calculated using ImageJ, HPRT was used as normalization control for real-time PCR. *p < .05, ***p < .001.
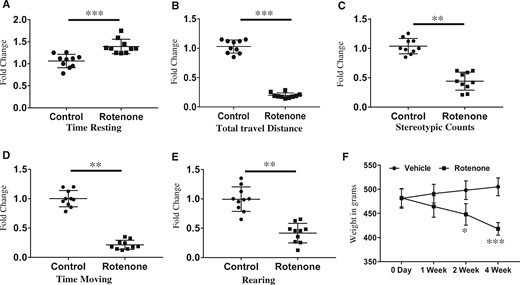
Four-week rotenone exposure (2.5 mg/kg b.wt) induced neurobehavioral alterations in aged rats. Twenty rats of 1 year age were equally divided into 2 groups and 1 group was exposed with rotenone (2.5 mg/kg b.wt) for 4 weeks and second group was exposed with corn oil for 4 weeks. After completion of the exposure, spontaneous locomotor activity (SLA) test was performed to measure locomotor behavior like, (A) time resting, (B) total travel distance, (C) stereotypic counts, (D) time moving, and (E) rearing. F, Average percentage change in total body mass of control and rotenone exposed rats. Values of SLA test were analyzed and presented in the form of fold change. Student’s t test was performed to calculate significance. *p < .05, **p < .01, ***p < .001.
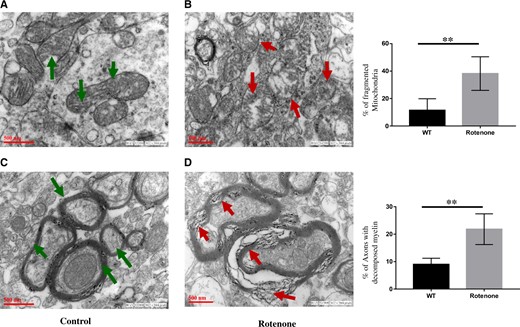
Four-week rotenone exposure (2.5 mg/kg b.wt) disrupted mitochondrial morphology in substantia nigra (SN) of 1‐year‐old rat brains. Electron micrographs of SN isolated from control (A and C) rats and rotenone exposed (B and D) rats. Green arrows in (A) demonstrating normal mitochondrial structure, and (C) normal myelination in SN of control rats. In SN of 4-week rotenone (2.5 mg/kg b.wt) exposed rats, red arrows show fragmented mitochondria (B) or decomposed or degraded myelin structure (D). Bar diagrams of % of fragmented mitochondria and % of axons with decomposed myelin’s are represented in panel (E). Scale bar 500 nm. **p < .01.
Global miRNA Profiling to Identify the miRNAs Deregulated by Rotenone in 1‐year‐old Rats
Using rodent TLDA arrays, expression of all the known miRNAs were measured in total RNA isolated from the brain of rats given systemic exposure of rotenone (2.5 mg/kg b.wt, for 4 weeks) or vehicle control. Volcano plot analysis of TLDA data was carried out by fixing 2-fold as minimum change and p ≤ .05 has shown significant upregulation in 6 miRNAs and significant downregulation in 12 miRNAs in the brain of 1‐year‐old rats exposed with rotenone (2.5 mg/kg b.wt, for 4 weeks). Systemic exposure of rotenone in 1‐year‐old rats produced maximum upregulation in expression of miR-146a followed by miR-214, miR-223, and miR-7e, and maximum downregulation in expression of miR-484 followed by miR-141, miR-200a, and miR-487b (Figs. 4A and 4B). Furthermore, real-time PCR of identified miRNAs carried out with individual primers have confirmed time-dependent regulation of up- and downregulated miRNAs in rotenone exposed rats (Figure 4C).
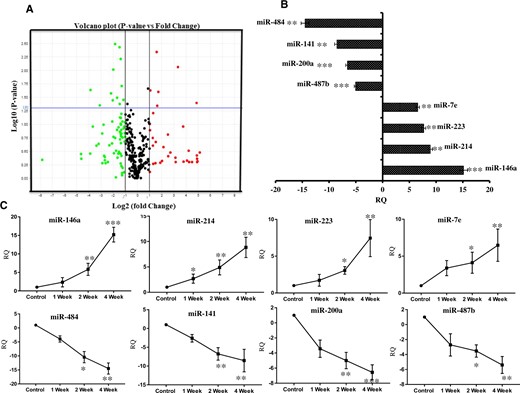
Global expression profiling of miRNAs in brain of rats exposed with rotenone (2.5 mg/kg b.wt) for 4 weeks. A, Volcano plot analysis of global miRNA profile in brains of 1‐year‐old rats exposed with rotenone versus vehicle control for 4 weeks. B, Relative quantification (RQ) of top 8 deregulated miRNAs by rotenone exposure in rat’s brain. C, Real-time PCR of identified miRNAs in brain of rats exposed with vehicle control or rotenone for 1, or 2 or 4 weeks. Global miRNA expression profile was performed in total RNA isolated from whole brain exposed with rotenone 2.5 mg/kg b.wt for 4 weeks. TaqMan low-density miRNA array pool A rat V2.3 was used and ran in triplicates. The blue horizontal line in volcano plot denoting the p value of .05, whereas 2 vertical black lines showing the minimum cut-off boundary (±1- or 2-fold) for significant up-or downregulated miRNAs. Over the blue line all red dots denote significantly upregulated miRNAs and green dots denote significantly downregulated miRNAs. *p < .05, **p < .01, ***p < .001.
Rotenone Upregulates Expression of miR-146a by NF-kβ Activation
As reported earlier, exposure of rotenone (2.5 mg/kg b.wt, for 4 weeks) significantly induced NF-kβ activation by phosphorylation of IkB-α in the SN of rats in a time-dependent manner (Figs. 5A and 5B). Interestingly, rotenone exposure also inhibited LC3 expression in SN in time-dependent manner (Supplementary Figure 1). In silico mapping of miR-146a gene promoter region shows putative binding sites of NF-kβ in both rat and humans (Figure 5C). Similar to rats SN, exposure of rotenone also induced NF-kβ activation by phosphorylating of IkB-α (Figure 6A) and Parkin inhibition (Supplementary Figure 2) in differentiated SH-SY5Y cells. Furthermore, to identify the link between NF-kβ and miR-146a, we exposed differentiated SH-SY5Y cells with lipopolysaccharide (LPS: as LPS is a positive regulator of NF-kβ) and MG132 (proteasome inhibitor), which is an inhibitor of NF-kβ activation. As expected, exposure of lipopolysaccharide-induced NF-kβ activation by phosphorylation of IkB-α, whereas exposure of MG132 (proteasome inhibitor) decreased phosphorylation of IkB-α (Figs. 6B and 6C). Real-time PCR of miR-146a carried out in differentiated SH-SY5Y cells has shown significant upregulation in rotenone or LPS exposed cells, whereas downregulated by MG132 (Figs. 6A–C).
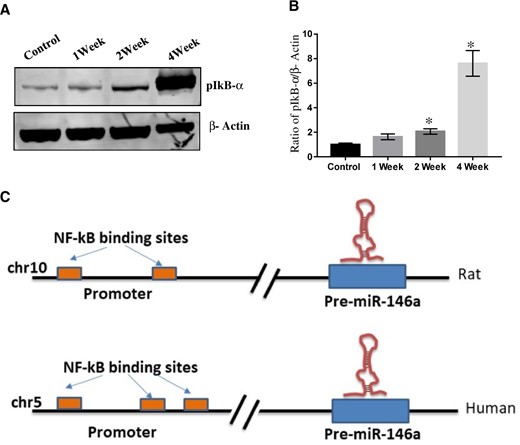
Rotenone exposure induced phosphorylation of NF-kβ. A, Western blot of pIkB-α and β-Actin in whole cell lysate prepared from substantia nigra (SN) of control or 1-, 2-, and 4-week rotenone exposed rats. B, Densitometry of Western blot of pIkB-α and β-Actin in whole cell lysate prepared from SN of control or 1-, 2-, and 4-week rotenone exposed rats. C, In silico mapping of NF-kβ binding sites in miR-146a promotor region. Densitometry was performed using ImageJ software. *p < .05.
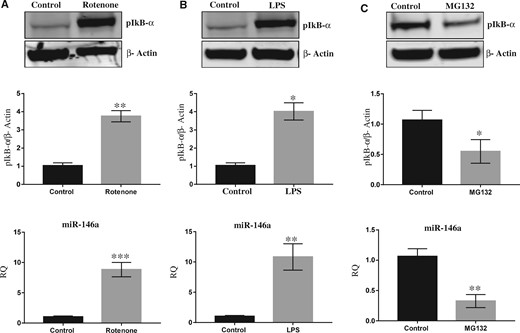
Rotenone induced expression of miR-146a by activating NF-kβ. A, Western blot and Densitometry of pIkB-α and β-Actin in whole cell lysate prepared from SH-SY5Y cells exposed with rotenone with real-time PCR of miR-146a in SH-SY5Y cells exposed with rotenone. B, Western blot and Densitometry of pIkB-α and β-Actin in whole cell lysate prepared from SH-SY5Y cells exposed with lipopolysaccharide (LPS) with real-time PCR of miR-146a in SH-SY5Y cells exposed with LPS. C, Western blot and Densitometry of pIkB-α and β-Actin in whole cell lysate prepared from SH-SY5Y cells exposed with MG-132 with real-time PCR of miR-146a in SH-SY5Y cells exposed with MG-132. Densitometry was performed using ImageJ software. *p < .05, **p < .01, ***p < .001. Abbreviation: RQ: relative quantification.
Rotenone-induced Mitochondrial Etiology Is Regulated by Expression of miR-146a
Confocal microscopy carried out in SH-SY5Y cells has shown rotenone-induced fragmentation in mitochondria, which also become rounded and short (Figure 7A). Similar to rotenone exposure, overexpression of miR-146a induced mitochondrial fragmentation in SH-SY5Y cells (Figure 7A). Mitochondrial fragmentation was inhibited in rotenone exposed SH-SY5Y cells, when expression of miR-146a is inhibited by synthetic inhibitors of miR-146a (Figs. 7A and 7B). Similarly, inhibition of miR-146a also inhibited ROS accumulation and also partially rescued MMP in rotenone exposed differentiated SH-SY5Y cells, whereas ectopic overexpression of miR-146a has induced ROS accumulation and MMP loss, similar to rotenone (Figs. 7C and 7D).
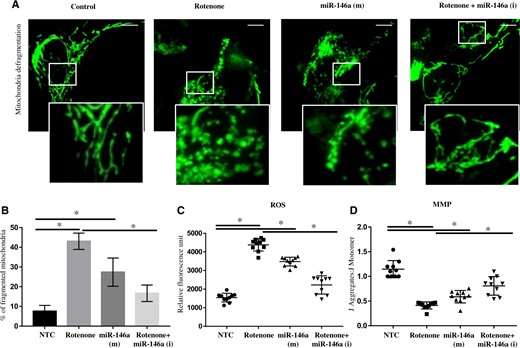
Inhibition of miR-146a rescued rotenone induced mitochondrial fragmentation and oxidative imbalance. A, The overall morphology of the entire mitochondrial network was studied by confocal microscopy in SH-SY5Y cells, Control, exposed with Rotenone, transfected with synthetic mimics of miR-146a (Syn-miR-146a) and transfected with synthetic inhibitors of miR-146a (Anti-miR-146a) and exposed with rotenone SH-SY5Y cells. Scale bar 10 µM. B, Bar diagram of % of fragmented mitochondria in Control, exposed with Rotenone, transfected with Syn-miR-146a and transfected with Anti-miR-146a and exposed with rotenone, SH-SY5Y cells. C, Relative DCFDA fluorescent units in SH-SY5Y cells transfected with nontarget control (NTC), or exposed with rotenone, or transfected with Syn-miR-146a or transfected with inhibitors of miR-146a and exposed with rotenone. D, Estimation of mitochondrial membrane potential (MMP) using JC-1 in SH-SY5Y cells transfected with NTC, or exposed with rotenone, or transfected with synthetic mimics of miR-146a or transfected with inhibitors of miR-146a and exposed with rotenone, or transfected with inhibitors of miR-146a. All experiments were performed in triplicates. Mitochondria in SH-SY5Y cells were visualized by CellLight Mitochondria-GFP, BacMan 2.0 of Thermo Fisher using confocal microscopy. *p < .05. Abbreviation: ROS, reactive oxygen species.
Parkin Has a Binding Site for miR-146a in Its 3′UTR
In silico target mining studies using TargetScan web portal suggested that Parkin (PARK2) has a putative binding site of miR-146a in its 3′UTR (Supplementary Figure 3A). Moreover, extensive analysis of 3′UTR of Parkin gene also suggested that the binding site for miR-146a is conserved in humans and rats (Supplementary Figure 3A). Furthermore, we did in silico pathway analysis for the targets of miR-146a mapped by TargetScan using Panther DNA database. GO analysis indicated that approximately 7.3% of the target genes of miR-146a was associated with apoptosis signaling pathway and approximately 3.6% genes were associated with PD (Supplementary Figure 3B). GO cellular component analysis resulted in approximately 36.10% miR-146a target genes are in cell part, approximately 16% in membrane and 1.2% synapse (Supplementary Figure 3C). Furthermore, GO biological process analysis has shown that biological processes were more diversified, with 27% of the target molecules involved in cellular processes, 19.5% in metabolic processes, 15.10% in multicellular organismal process, 9.8% biological regulation, and 8.8% in developmental processes (Supplementary Figure 3D).
miR-146a Targets and Regulate the Expression of Parkin
Immunoblotting and immunocytochemistry studies carried out in SH-SY5Y cells have shown significant downregulation of Parkin gene in cells exposed with mimics of miR-146a, whereas some increase is also observed in levels of Parkin in cells transfected with inhibitors of miR-146a (Figs. 8A–E). Interestingly, imbibition of miR-146a by synthetic inhibitors inhibits NF-kβ phosphorylation and increased Parkin level in rotenone exposed SH-SY5Y cells (Supplementary Figs. 4 and 5).
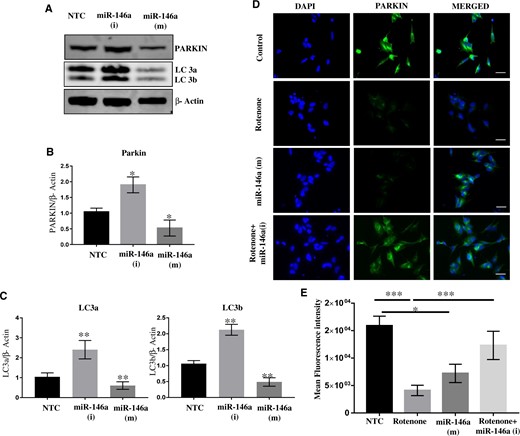
miR-146a binds and regulate expression of Parkin. A, Western blots of Parkin, LC 3a/b, and β-Actin in SH-SY5Y cells transfected with nontarget control (NTC) or synthetic inhibitor of miR-146a or synthetic mimics of miR-146a. B, Densitometry of Western blots of Parkin, LC 3a/b, and β-Actin in SH-SY5Y cells transfected with NTC or synthetic inhibitor of miR-146a or synthetic mimics of miR-146a. C, Real-time PCR of Parkin in SH-SY5Y cells transfected with NTC or synthetic inhibitor of miR-146a or synthetic mimics of miR-146a. D, Immunofluorescence of Parkin in SH-SY5Y cells transfected with NTC or synthetic inhibitor of miR-146a or synthetic mimics of miR-146a. Scale bar 10 µM. E, Mean fluorescence intensity of Parkin fluorescence in SH-SY5Y cells transfected with NTC or synthetic inhibitor of miR-146a or synthetic mimics of miR-146a. Densitometry was performed using ImageJ software. All experiments were performed in triplicates using SH-SY5Y cells of different passage. *p < .05, **p < .01, ***p < .001.
DISCUSSION
This study identified miR-146a as most significantly upregulated miRNA after systemic exposure of rotenone and demonstrated its role in rotenone-induced mitophagy mediated by downregulation of the Parkin gene. Systemic rotenone model of PD used in this study replicates most of the pathological features of human PD and shows the least variability among animals, which was the major limitation of the rotenone model (Cannon et al., 2009). The systemic well-established rotenone model of PD accurately replicates many aspects of the pathology of human PD and used extensively to study the molecular mechanism of disease pathogenesis (Cannon et al., 2009). It has demonstrated that middle-aged rats (12–14 months) are most sensitive toward rotenone exposure and develop PD symptoms after 8–10 days of exposure (Cannon et al., 2009). Therefore, we used 1‐year‐old rats and administered rotenone intraperitoneally (2.5 mg/kg b.wt) for 4 weeks (6 days in a week) as suggested in earlier studies to induce Parkinson like biochemical, molecular, and behavioral pathology (Betarbet et al., 2000; Cannon et al., 2009; Greenamyre et al., 2003). The decrease in the level of DJ-1, PINK1, Parkin, and TH, whereas the accumulation of SNCA is biochemical characteristic features of the pathogenesis of PD in animal models, in vitro models and human patients (Dawson et al., 2010; Klein and Schlossmacher, 2006; Polymeropoulos et al., 1997; Schapira and Jenner, 2011; Sherer et al., 2002b). Accumulation of SNCA proteins along with downregulation of DJ-1, Parkin, PINK1, and TH proteins observed in 1‐year‐old rats given systemic exposure of rotenone further supports the reliability of systemic rotenone exposed PD model. Electron microscopy of SN has shown the conversion of filamentous mitochondria to oval or rounded mitochondria and degradation of the myelin sheath in 1‐year‐old rats exposed with rotenone for 1 month. Mitochondrial fission or fragmentation and myelin decomposition are the established characteristics of neurodegeneration (Bossy-Wetzel et al., 2003; Braak and Del Tredici, 2004). Neurobehavioral alterations observed in rotenone exposed rats have further confirmed that 1-month exposure of rotenone to 1‐year‐old rats mimics PD like pathophysiology. Impaired locomotion, including movement slowness, difficulties with gait and balance, and tremor are the primary manifestation of for PD (Mazzoni et al., 2012). Rotenone exposure significantly increased time resting, whereas total travel distance, stereotypic counts, time moving, and rearing significantly decreased in rotenone exposed rats. Decreased levels of LC3 protein in the SN region suggest the role of autophagic inhibition in rotenone-induced neurodegeneration. In humans, loss or inhibition of autophagic response during PD pathogenesis has been identified in several studies (Anglade et al., 1997; Pan et al., 2008).
Global miRNA profiling carried out in brains of 1‐year‐old rats given systemic exposure of rotenone for 1 month identified most prominent upregulation in expression of miR-146a (15.11-fold), a miRNA known to be induced by inflammatory factors like interleukin 1 and tumor necrosis factor-alpha during innate immune response (Aronica et al., 2010; Bhaumik et al., 2009; Gu et al., 2015; Lukiw et al., 2008). Saba et al. (2012) have reported consistent upregulation of miR-146a in Prion infected brains (Saba et al., 2012). Interestingly, the elevated level of miR-146a was correlated with regulate inflammatory circuit and immune responses during neurodegeneration (Lukiw et al., 2008; Saba et al., 2012). Since the last 3 decades, we know that PD patients undergo inflammatory changes, however recent studies have started showing a causative role of neuroinflammation in PD patients (Hald and Lotharius, 2005; Whitton, 2007). Rotenone is a known potent oxidative stress inducer by inhibiting complex I activity during oxidative phosphorylation (Schapira et al., 1990; Testa et al., 2005). NF-kβ is a master regulator of gene expression, which is known to get activated during oxidative stress, neurodegeneration, neurotoxicity, neuroinflammation, etc. (Mattson and Camandola, 2001; O’Neill and Kaltschmidt, 1997). NF-kβ is also known to regulate gene expression of proinflammatory enzymes and cytokines, chemokines, adhesion molecules, proinflammatory transcription factors, to modulate the neuronal survival (Shih et al., 2015). Modulation of NF-kβ in neuroinflammation during neurodegeneration activate proinflammatory cytokines and other genes which results in prolonged cell damage (Tobon-Velasco et al., 2014). As inhibition of NF-kβ in astrocytes is sufficient to delays neurodegeneration (Li et al., 2018). Therefore, we studied the activation of NF-kβ during rotenone exposure in the SN region of the brain. The time-dependent increase observed in phosphorylation of pIkB-α in rotenone exposed rats indicates NF-kβ activation, which suggested that neuroinflammation can be involved in the pathogenesis of PD in very early stages. Activation of NF-kβ by rotenone-induced oxidative stress is also previously been shown by several studies (Abdelsalam and Safar, 2015; Chen et al., 2011; Gao et al., 2015). Activated NF-kβ regulates transcription of various genes and pathways (Barnes and Karin, 1997; Collins et al., 1995; Ghose et al., 2011; O’Neill and Kaltschmidt, 1997). Promoter analysis of miR-146a gene shows a presence of NF-kβ binding site in promoter regions of the miR-146a gene and indicates toward a role of increased phosphorylation of NF-kβ in inducing the expression of miR-146a gene. To confirm the regulation of miR-146a by NF-kβ, we exposed SH-SY5Y cells with LPS and measured expression of pIkB-α and miR-146a. Our results suggested that miR-146a expression is increased by LPS exposure in pIkB-α dependent fashion. Furthermore, our studies confirm our findings by inhibition of NF-kβ by the chemical inhibitor (MG132) in SH-SY5Y cells. Interestingly, it has been observed that the expression of miR-146a is regulated by NF-kβ and vice versa during neurodegeneration (Ghose et al., 2011), which further confirms oxidative stress-induced miR-146a expression mediated by NF-kβ during neurodegeneration.
Further to identify the functional role of miR-146a in rotenone-induced neurodegeneration, differentiated SH-SY5Y cells were used as these are established in vitro neuronal model for mechanistic studies (Agholme et al., 2010; Xie et al., 2010). SH-SY5Y cells were differentiated into mature neurons by sequential exposure of RA and BDNF as reported in our previous studies (Jauhari et al., 2017). As expected, rotenone exposure induced oxidative stress and induced synaptic and neuritic degeneration in differentiated SH-SY5Y cells, which mimics the pathologic conditions of rotenone exposed 1‐year‐old rat brain.
Fragmentation of mitochondria is observed as a common etiology for mitochondrial dysfunction in degenerating neurons (Knott et al., 2008). Similarly, exposure of rotenone to differentiated SH-SY5Y cells also induced mitochondrial fragmentation. Interestingly, ectopic overexpression of miR-146a in differentiated SH-SY5Y cells induced mitochondrial fragmentation, whereas inhibition of miR-146a in rotenone exposed differentiated SH-SY5Y cells inhibited mitochondria fragmentation. Transfection studies of miR-146a suggest that miR-146a induces PD like changes by mitochondrial fragmentation/dysfunction. Furthermore, miR-146a inhibition in rotenone exposed SH-SY5Y cells, partially rescued ROS accumulation and MMP loss, which further confirms the role of miR-146a in rotenone-induced mitochondrial dysfunction. However, these studied need to be explored more with other mitochondrial physiology tools. Our results are in support of the previous findings, which shows that rotenone-induced mitochondrial fragmentation in neurodegeneration (Greenamyre et al., 2003; Panov et al., 2005; Radad et al., 2006).
We next examined the target genes for miR-146a using online web portal TargetScan. In silico target, mining suggested that Parkin 3′UTR has putative binding sites for miR-146a. Parkin harbors miR-146a binding site at their 3′UTR between nucleotides 400 and 410. Moreover, GO pathway analysis further confirms that target genes of miR-146a are most significantly involved in an apoptosis signaling pathway, inflammation signaling pathway, Alzheimer, Parkinson, Huntington disease pathway, synaptic vesicle pathway, P53 pathway, etc. Moreover, cell component analysis has shown that miR-146a target genes are in a synapse, cell part, extracellular matrix, membrane, etc.
Furthermore, biological pathway analysis has suggested that miR-146a involved in the developmental process, immune response pathway, locomotion, cellular process, etc. Taken all together GO pathway analysis further suggested the significant involvement of miR-146a in apoptosis, inflammation, and neurodegeneration. Gain and loss of function studies have demonstrated the role of miR-146a in regulating expression of the Parkin gene. Overexpression of miR-146a in SH-SY5Y cells significantly downregulated levels of Parkin protein, whereas inhibition of miR-146a accumulated Parkin protein. Interestingly, inhibition of miR-146a in rotenone exposed SH-SY5Y cells rescued Parkin level confirmed by immunofluorescence studies. Moreover, LC3 was also regulated by miR-146a similar to Parkin suggested that miR-146a regulate Parkin-mediated autophagy/mitophagy. These results suggested that miR-146a plays a crucial role in rotenone-induced neurodegeneration by inhibiting mitophagy mediator Parkin. Recent studies showing the role of the microbiome in PD pathogenesis and have identified differences in microbiome as a source of inflammation in PD patients further supports the role of inflammatory changes in PD pathogenesis (Caputi and Giron, 2018).
In conclusion, rotenone-induced alterations in cells activate phosphorylation of NF-kβ. Phosphorylated NF-kβ translocated to the nucleus, where it bound to promotor of miR-146a gene and increased its transcription. Increased transcription of miR-146a increases the level of miR-146a, which reduced mitophagy by inhibiting Parkin level (Figure 9). In conclusion, our studies have identified the role of miR-146a in PD like neurodegeneration induced by systemic exposure of rotenone. In addition, alterations in mitophagy is a common pathological feature in neurodegenerative diseases; therefore, targeting miR-146a might provide therapeutic intervention during neurodegenerative diseases.
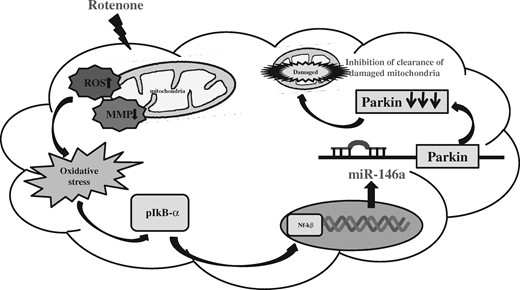
Schematic diagram of miR-146a-mediated rotenone-induced neurodegeneration. Abbreviations: MMP, mitochondrial membrane potential; ROS, reactive oxygen species.
ACKNOWLEDGMENTS
A.J. and S.M. are grateful to UGC, New Delhi, and T.S. is grateful to DST, New Delhi for providing research fellowships. The CSIR-IITR communication number is 3588.
FUNDING
SERB, New Delhi (GAP359); Council of Scientific and Industrial Research (CSIR) Network Project (miND) (BSC115).
DECLARATION OF CONFLICTING INTERESTS
The authors declared no potential conflicts of interest with respect to the research, authorship, and/or publication of this article.

Comments