


Abstract
Human exposure to naphthalene (NA), an acute lung toxicant and possible human carcinogen, is primarily through inhalation. Acute lung toxicity and carcinogenesis are thought to be related because the target sites for both are similar. To understand susceptibility of the developing lung to cytotoxicity of inhaled NA, we exposed neonatal (7 days), juvenile (3 weeks), and adult mice to 5 or 10 ppm NA vapor for 4 h. We measured vacuolated airway epithelium morphometrically, quantified NA and NA-glutathione levels in plasma and lung, and quantified gene expression in microdissected airways. NA inhalation caused airway epithelial cytotoxicity at all ages, in both sexes. Contrary to a previous study that showed the greatest airway epithelial cytotoxicity in neonatal mice following intraperitoneal NA injection, we observed the most extensive airway epithelial toxicity in older, juvenile, animals exposed to NA by inhalation. Juvenile female animals were the most susceptible. Furthermore, NA inhalation in juvenile animals resulted in damage to conducting airway Club cells that was greater in proximal versus distal airways. We also found NA tissue burden and metabolism differed by age. Gene expression pathway analysis was consistent with the premise that female juvenile mice are more predisposed to damage; DNA damage and cancer pathways were upregulated. Our data demonstrate special susceptibility of young, juvenile mice to NA inhalation-induced cytotoxicity, highlight the importance of route of exposure and airway location in toxicity of chemicals in the developing lung, and provide metabolic and molecular insights for further identification of mechanisms underlying age and sex differences in NA toxicity.
Naphthalene (NA) is one of the most abundant polycyclic aromatic hydrocarbons in air (Buckpitt et al., 2010; Chuang et al., 1999) and is a respiratory toxicant as well as a possible human carcinogen (USEPA, 1998). The response of the developing lung to NA vapor exposure has not been investigated. This is a concern because children are ubiquitously exposed to NA vapors which are produced by combustion processes. Although there is no information about tumor incidence following childhood NA exposures, there is a correlation between urinary NA metabolites and chromosomal aberrations in T-lymphocytes of children (Orjuela et al., 2012). Elevated NA serum levels have also been linked to asthma in children (Al-Daghri, 2008). Human exposure to NA is widespread (Li et al., 2008), and it is important to consider the effects of continual exposure on susceptible populations and during critical stages of lung growth and maturation.
A key step in identifying the risk of developmental toxicity is to understand the pattern of acute lung toxicity following NA vapor inhalation in the young. To date, assessment of NA lung toxicity during development has only been investigated in male mice exposed via intraperitoneal (i.p.) injection (Fanucchi et al., 1997a). As an important extension of that study, we have chosen to study both male and female mice, at three developmental stages, following NA inhalation exposure. There are advantages and disadvantages to using young mice as a model for human children. Although both species undergo postnatal development of cytochrome P450 (CYP) expression in the lung, the mouse and human CYP isoforms expressed are thought to have inherently different activity levels, which is the basis for a great deal of controversy regarding whether the mode of action for NA is conserved between species (Cruzan et al., 2009). On the other hand, the mouse is a strong model to study Club cell toxicity because Club cells are abundant throughout the airway tree in the mouse, and much is known about the activation/detoxification of NA in the mouse. Further, chronic exposure studies in mice have linked inhalation exposure to NA with formation of lung tumors (Abdo et al., 1992; National Toxicology Program, 1992).
NA requires bioactivation by CYPs monooxygenases to cause airway epithelial cytotoxicity (Buckpitt et al., 1992,, 1995; Chichester et al., 1991; Devereux et al., 1989; Li et al., 2011). Inhibition of CYP with piperonyl butoxide results in decreased lung toxicity (Warren et al., 1982); whereas, depleting glutathione (GSH) with diethylmaleate increases toxicity (Warren et al., 1982). A balance of CYP-mediated bioactivation and antioxidant-based detoxification (which can be impacted by GSH abundance and regeneration, and glutathione S-transferase activity/expression) is related to susceptibility [(Phimister et al., 2004; Plopper et al., 2001; West et al., 2000) and reviewed in Buckpitt et al. (2002)]. Within the lung, CYPs are focally expressed in specific cell types and locations and their spatial expression can differ during development and maturation. Adult conducting airway nonciliated bronchiolar epithelial Club cells (formerly called Clara cells) (Plopper et al., 1987) are selectively damaged by both inhalation (West et al., 2001) and i.p. administration of NA (Plopper et al., 1992b,c; West et al., 2001) partially due to their high levels of CYPs that are active toward NA (Buckpitt et al., 1995; Chichester et al., 1991; Devereux et al., 1989).
NA is primarily detoxified by phase II enzymes and conjugation to GSH (Fanucchi et al., 2000; Phimister et al., 2004,, 2005; Plopper et al., 2001). Studies of injected NA have found that isoform selectivity, abundance and activity of CYPs, and phase II biotransformation enzymes contribute to species (Plopper et al., 1992b,c) and age (Fanucchi et al., 1997a, 2000) differences in airway epithelial toxicity following NA exposure. Airway epithelial CYP expression increases in development, in parallel with the maturation of Club cells. Male National Institutes of Health (NIH) Swiss mice have increasing airway CYP activity with age (Fanucchi et al., 1997b) and mice with immature Club cells are more susceptible than adults to injected NA (Fanucchi et al., 1997a).
Extrapulmonary metabolism of NA is also important. Reactive NA metabolites produced in the liver can be circulated to the lung (Buckpitt and Warren, 1983; Kanekal et al., 1991; Kovalchuk et al., 2017). Human liver microsomes are capable of metabolizing NA to NA-dihydrodiol, 1-naphthol, and 2-naphthol with Km values in the low micromolar range (Cho et al., 2005). Although humans are thought to be less susceptible to NA than mice because of lower CYP activity in the human lung (in general and toward NA in particular), metabolism in the liver may influence toxicity in the lung through circulation of metabolites.
Inhalation is a major route of environmental exposure to NA. There have been no studies of susceptibility to inhaled NA in the developing lung, and the chronic bioassays evaluating NA lung tumor formation were conducted in adult rats (Abdo et al., 2001; National Toxicology Program, 2000) and mice (Abdo et al., 1992; National Toxicology Program, 1992). Earlier studies on the toxicity of i.p. injected NA may not apply to toxicity of inhaled NA, as the toxic outcome of i.p. administered NA may be heavily influenced by metabolites generated in the liver and/or the impact of first-pass metabolism on bioavailability in the target site. The current studies test the hypothesis that NA delivered to developing animals by inhalation will have a different impact on the lung, in terms of site-specific damage and overall susceptibility to toxicity than in the prior study where NA was given intraperitoneally. Because one goal of our study is to probe possible linkages between acute toxicity and the downstream lung cancer outcome of the National Toxicology Program (NTP) studies in mice, we looked beyond the roles of CYP and GSH to understand the impact of NA exposure on a variety of genes involved in disease progression and cell cycle regulation in both sexes in the conducting airway injury target region. These experiments define the pattern and location of acute cytotoxicity using quantitative methods and relate this to the dose of NA delivered to the lung and the subsequent conjugation of NA metabolites to GSH. The outcome is placed into the context of the developmental pattern of gene expression, and NA exposure response thereof, by examining key genes involved in bioactivation, detoxification, and carcinogenesis.
MATERIALS AND METHODS
Animals
Adult male and female C57BL/6 mice were purchased from Harlan Labs and were used for breeding. All mice were maintained in a barrier facility with filtered air in AAALAC approved conditions on a 12-h light/dark cycle with food and water ad libitum. All animal experiments were performed under protocols approved by the University of California, Davis IACUC in accordance with NIH guidelines.
Whole body inhalation exposure
Male and female C57BL/6 mice (7 days, 3 weeks, 8 weeks) were exposed to NA vapor (5 or 10 ppm) via whole body inhalation for 4 h as described previously (West et al., 2001). Concentration of 10 ppm was selected as the upper limit to correspond with the low dose used in the NTP chronic bioassay and to replicate the Occupational Safety and Health Administration (OSHA) limit for NA exposures in workers. All exposures began between 8 and 9AM PST (2–3 h after the start of the light cycle). Neonatal (7 days) pups were exposed with the dam. Each litter of 7 days pups was normalized to a uniform litter size of 6–9 pups at 1 day to limit differential effects of maternal nutrition in large litters on postnatal growth. Small litters (less than N = 6) were excluded from this study. Each litter was considered to be an N of 1, and endpoints were randomized among pups from the same litter so that each endpoint was made up of 5+ litters. Juvenile (3 weeks) pups were exposed postweaning. Animals were euthanized with an overdose of pentobarbital either 24 h after the end of exposure, or within 15 min of the end of exposure. Age-matched control mice were included for comparison. Histopathology was similar for filtered air exposed mice (N = 2, data not shown) and age-matched unexposed controls (N = 5–6). Thus, unexposed controls (naive) were used for these studies due to limitations on exposure chamber availability.
High-resolution light microscopy and stereology
Animals (N = 5) were sacrificed 24 h after the end of the exposure and exsanguinated. The lungs were removed en bloc and inflated via tracheal cannula at 30 cm of pressure for 1 h with Karnovsky’s fixative (0.9% glutaraldehyde/0.7% paraformaldehyde in cacodylate buffer, adjusted to pH 7.4, 330 mOsmol/kg H2O) as described previously (Van Winkle et al., 2001). Lungs were stored in fixative until use. Karnovsky’s fixed tissue samples were embedded separately in Araldite 502 epoxy resin. Specimens were sectioned at 1 μm (Leica Ultracut UCT ultramicrotome with glass knives) and stained with methylene blue/azure II. High magnification images of proximal intrapulmonary airway defined by central location within the lung lobe (to include the mainstem lobar bronchus within three generations as defined by block selection at time of tissue embedment of the left lobe) and terminal bronchioles (defined as having openings to alveolar ducts and limited to the last 200 μm of these airways) were captured using a 20× objective lens using an Olympus BH-2 microscope in bright field mode. Images were converted to grayscale in Adobe Photoshop.
Quantitative measurements of damage were made using the Stereology Toolbox program (Morphometrix, Davis, CA) as previously described (Fanucchi et al., 1997a; Li et al., 2017; Van Winkle et al., 1995). A cycloid test system of known length per point (l/p) was used to perform point (P) and intercept (I) counting on vertical uniform random sections as previously described (Howard and Reed, 1998; Hsia et al., 2010). Volume of damaged epithelial cells per basal lamina surface area (Vs) was calculated to give a quantitative measure of mass of damage (μm3/μm2). The formula for this calculation is Vs = (l/p)(Pd/2I), where l/p is the length of cycloid per point at the level of the tissue, Pd is the number of test points hitting structures of interest (damaged epithelial cells), and I is the number of intersections with the epithelial basal lamina. A minimum of 200 points per region of interest (proximal airways, terminal bronchioles) was counted. Damaged epithelial cells were defined as airway epithelial cells attached to the basal lamina that contained cytoplasmic vacuoles. Exfoliated cells that were not attached to the basal lamina were not counted.
NA and NA-GSH in plasma and lung tissue
Animals (N = 6–9) were sacrificed within 15 min of the end of the exposure. Blood was collected and placed in Eppendorf tubes on ice, then centrifuged at 20 000 × g for 5 min at 4°C. Supernatant was transferred to new Eppendorf tube and stored at −80°C. Lungs were removed en bloc, rinsed with PBS, and placed in an Eppendorf tube to be stored at −80°C. NA and NA-GSH levels in plasma and lung homogenates were determined using gas chromatography-mass spectrometry and liquid chromatography-mass spectrometry, respectively, as described (Kovalchuk et al., 2017). The limits of detection for NA and NA-GSH were 0.8 and 0.55 pmol, respectively (on column).
NanoString gene expression
For collection of intrapulmonary airway tree samples, the trachea was cannulated and the lungs inflated to capacity with RNAlater (Ambion/Applied Biosystems; Foster City, CA) at 24 h after exposure. The lungs were stored at −20°C until microdissection and RNA isolation could be performed. Conducting airways were microdissected away from parenchymal tissues as previously described (Plopper et al., 1991; Sutherland et al., 2010; Van Winkle et al., 1996). RNA isolation from airways was carried out using the RNeasy Plus Mini Kit (Qiagen; Hilden, Germany) using gDNA eliminator columns. Total RNA concentration and purity was monitored using a NanoDrop spectrophotometer (ThermoFisher; Waltham, MA). Gene expression analysis was performed on 100 ng of RNA per sample using the NanoString nCounter Analysis System (NanoString Technologies; Seattle, WA). The NanoString codeset was custom-designed and composed of 87 genes of interest and 3 housekeeping genes (Gusb, Actb, Pgk1). Custom nCounter CodeSet Design Report with probe identifiers and isoform coverage is included in the supplement (Supplementary Table 1). Specific genes of interest included 4 genes to overlap with qRT-PCR and digital PCR methods (Cyp2F2, Gclm, Ephx1, Scgb1a1), as well as genes related to GSH synthesis, lung tumors, DNA damage/repair, and xenobiotic metabolism. Raw count data (Supplementary Table 2) was first normalized to the spike-in positive controls to account for assay efficiency, and then normalized to the geometric mean expression value of the five housekeeping genes using nSolver software (NanoString Technologies; Seattle, WA). Data were examined using both nSolver and Ingenuity Pathway Analysis (Qiagen; Hilden, Germany). Causal analysis approaches in Ingenuity Pathway Analysis have been previously described (Kramer et al., 2014).
Statistics and data presentation
GraphPad Prism was used to perform 2-way ANOVA (age, sex) with Tukey’s multiple comparisons post hoc test. A 3-way ANOVA (with Tukey’s multiple comparisons post hoc test) was run with n = 5 per group to examine the effect of sex, age, and airway level on normalized volume of epithelial damage (Vs). Data are reported as mean ± standard error. Values of p < .05 were considered statistically significant (*p < .05, **p < .01, ***p < .001, ****p < .0001). Statistics on figures are shown for significant relationships between males and females of the same age or between different ages within one sex. NanoString gene expression data were analyzed using nSolver software (NanoString Technologies; Seattle, WA; www.nanostring.com) and Ingenuity Pathway Analysis (Qiagen; Hilden, Germany). nSolver utilized R3.1.1 (R Foundation for Statistical Computing; Vienna, Austria; www.r-project.org) and XQuartz (www.xquartz.org) to run software for Mac. Significance for NanoString data were determined using p < .05 with false discovery rate of 25%. Fold change on figures is displayed for measurements greater than 1.2 or less than −1.2, with a p value cutoff of .05. Multipanel figures were prepared in Adobe Illustrator CC 2017 (Adobe Systems; San Jose, CA; http://www.adobe.com/products/illustrator.html).
RESULTS
Qualitative Histology
Inhalation of NA caused airway epithelial cytotoxicity at all airway levels examined, in all ages and in both sexes. Airway epithelial cytotoxicity was evident both as Club cell swelling and by the formation of cytoplasmic vacuoles within damaged Club cells (Figure 1). This toxicity was specific for airway epithelial Club cells, and other cell types within the airway and alveolar epithelium were not affected. In female juvenile and adult mice, the swollen Club cells were more abundant in proximal airways than in distal airways, distributed in clusters. Of all airway levels and groups, the proximal airways of juvenile female mice contained the greatest abundance of swollen and vacuolated Club cells, and the degree of swelling was the most severe. The change in Club cell morphology, which corresponded with increasing concentrations of NA, is shown in Figure 2 for juvenile female proximal airways and terminal bronchioles. Vacuolated cells were present in all airway levels beginning at 5 ppm, with increased vacuolization in the proximal airways at 10 ppm.
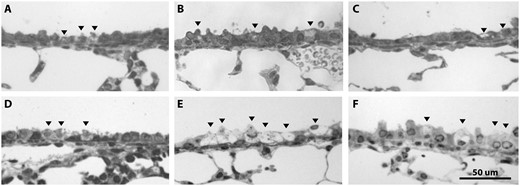
Proximal airway epithelial damage (swelling and vacuolization) was evident at all ages following 10-ppm NA exposure, but was most severe for the juvenile female group. A, Neonatal male, B, juvenile male, C, adult male, D, neonatal female, E, juvenile female, and F, adult female. These representative images show sex and age differences in cellular vacuolization and swelling for the proximal airways following 10-ppm NA exposure (n = 5). Black arrowheads show damaged Club cells.
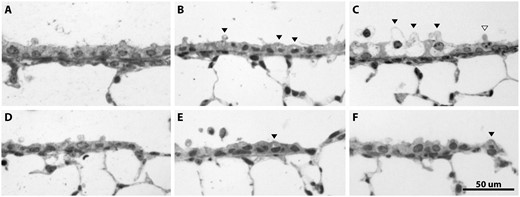
The extent and severity of NA damage was greater in the proximal airways than in the terminal bronchioles (distal airways). A, Naive proximal airway, B, proximal airway at 5 ppm, C, proximal airway at 10 ppm, D, naive terminal bronchiole, E, terminal bronchiole at 5 ppm, and F, terminal bronchiole at 10 ppm. These representative images show the pattern of dose-dependent cellular damage following NA inhalation for juvenile female mice. Cytoplasmic vacuoles were present in all airway levels beginning at 5 ppm, with increased vacuolization in the proximal airways at 10 ppm. Many Club cells in the juvenile female proximal airways were swollen. Black arrowheads show damaged Club cells; white arrowhead shows undamaged Club cell for size reference at 10 ppm.
Quantitative Stereology
Quantification of epithelial damage through stereology point-intercept counting supported our qualitative observations that the juvenile female proximal airway was most severely damaged by NA inhalation, and that damage from inhalation was primarily to proximal conducting airways within each lung lobe. Epithelial damage is expressed as Vs, mass of epithelium containing vacuolated cells per length of basal lamina (μm3/μm2) in Figure 3. All exposed tissues had a significantly higher mass of vacuolated conducting airway epithelium than controls. Mass of vacuolated epithelium in the controls ranged from 0.00 to 0.13 μm3/μm2. The effects of age and sex on mass of vacuolated proximal airway epithelium (Vs) were examined using a 2-way ANOVA (Figure 3A). There was not an interaction between sex and age F(2, 24)= 1.6, p = .21, though the main effect of age was significant (F(2, 24)= 3.5, p = .047). The mass of vacuolated epithelium in the proximal airway of juvenile female (3.2 ± 1.2 μm3/μm2) was approximately 4.6-fold greater than in the neonatal female (0.69 ± 0.25 μm3/μm2, p = .017). The mass of vacuolated terminal bronchiole airway epithelium (Figure 3B) was not affected by age (F(2, 24)= 0.49, p = .62) or sex (F(1, 24)= 0.27, p = .61), or by a combination of these 2 factors (F(2, 24)= 0.61, p = .55).
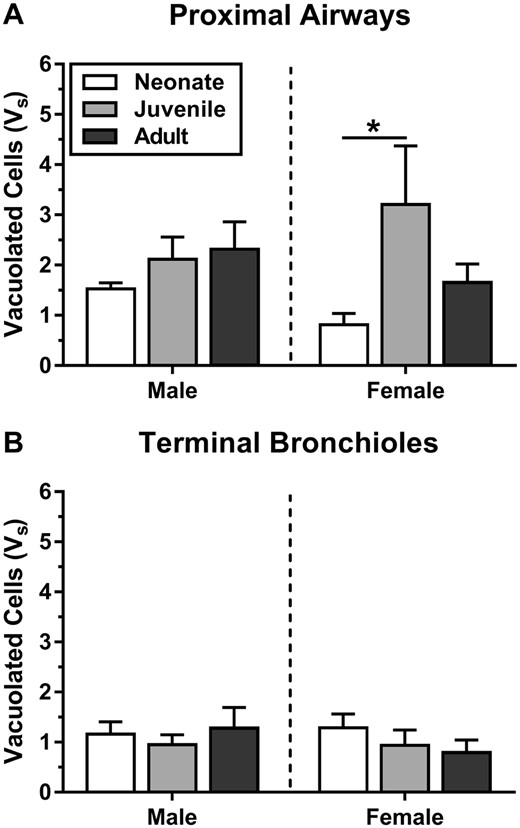
At 10 ppm, juvenile females had high levels of vacuolated epithelium in the proximal airways, as measured by morphometric approaches. Epithelial damage (Vs) is defined as volume of epithelium containing vacuolated cells, normalized to basal lamina surface area (μm3/μm2). Mass of vacuolated epithelium in the controls ranged from 0.00 to 0.13 μm3/μm2. These measurements confirmed that proximal airways (A) have a greater volume of epithelial damage per basal lamina than distal airways (terminal bronchioles) (B) at 10 ppm. Statistics (n = 5): 2-way ANOVA (age, sex) with Tukey’s post hoc test (*p < .05).
Lung and Plasma NA
When measured at the end of a 4-h whole body inhalation exposure, the highest level of unmetabolized NA in lung tissue (Figure 4A) was in the male adult (11 ± 2.9 ng NA/g lung tissue), which was approximately 1.8- to 5.5-fold higher than other ages and sexes (Figure 4). Among other groups, the levels of parent NA in lung tissue were statistically similar (Figure 4A). However, age and sex both independently affected levels of NA in lung tissue, with no interaction between age and sex (F(2, 30)= 1.3, p = .29). Age accounted for approximately 26% of the variance (F(2, 30)= 6.6, p = .0041) and sex accounted for approximately 9.1% of the variance (F(1, 30)= 4.6, p = .040).
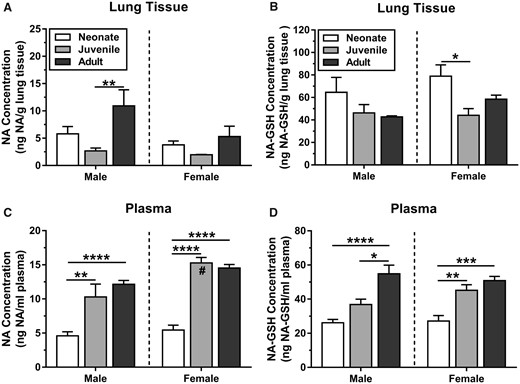
Levels of (A, C) unmetabolized and (B, D) GSH-conjugated NA in plasma and lung tissue. Levels of unmetabolized NA were low in juvenile lung tissue (ng/g) and high in juvenile plasma (ng/ml). Neonatal mice had high levels of NA-GSH (ng/g) in lung tissue, but this group had the lowest levels of NA-GSH in plasma (ng/ml). Tissue collected 0–15 min after 10 ppm × 4 h exposure. NA concentration in juvenile female plasma was significantly higher than in juvenile males and female neonatal mice. Statistics (n = 6–8): 2-way ANOVA (age, sex) with Tukey’s post hoc test (*p < .05, **p < .01, ***p < .001, ****p < .0001; #, significantly greater than juvenile male, p = .0065).
NA concentration in plasma (Figure 4C) was highest in adult and juvenile mice (10–15 pg NA/μL plasma) and lowest in neonatal mice (4.6–5.4 pg NA/μL plasma). Juveniles had 2.2-fold (male, p = .0020) to 2.8-fold (female, p < .0001) higher levels of NA in plasma than neonates. The only significant sex difference between animals of the same age was between juvenile females and juvenile males, where juvenile females have 1.5-fold higher NA concentration in plasma (Figure 4C, p = .0065). Age was the primary driver of differences in plasma NA levels, accounting for about 64% of the variation (F(2, 35)= 52, p < .0001); however the effect of sex was also significant and accounts for 8% of the variation (F(1, 35)= 13, p = .0010). There was no interaction between sex and age (F(2, 35)= 15, p = .086).
Lung and Plasma NA-GSH
Neonatal females had 1.8-fold higher levels of NA-GSH in lung tissue than juvenile females (p = .042), while all other groups were statistically similar (Figure 4B). Neonatal male mice had an average of 64 ± 13 ng NA-GSH/g lung tissue, while juveniles and adults had 43–46 ng NA-GSH/g lung tissue. Neonatal female mice had an average of 79 ± 10 ng NA-GSH/g lung tissue, while juveniles and adults had 44–58 ng NA-GSH/g lung tissue (Figure 4B). Approximately, 26% of the variance in the levels of NA-GSH in lung can be explained by age alone (F(2, 31)=6.1, p = .0060), while sex had no effect (F(1, 31)= 2.0, p = .17). There was no interaction between the main effects of age and sex (F(2, 31)=0.80, p = .46).
Plasma levels of NA-GSH were low (relative to adults) for both male (26 ± 2.0 pg NA-GSH/μL plasma) and female (27 ± 3.2 pg NA-GSH/μL plasma) neonatal mice (Figure 4D). Plasma NA-GSH levels increased significantly with age, and age independently accounted for 60% of the total variance (F(2, 37)=32, p < .0001). Adult male mice had 1.5-fold higher plasma NA-GSH than juveniles (p = .011), and 2.0-fold higher than neonates (p < .0001). Adult female mice did not have significantly higher levels of NA-GSH than juveniles (p = .81), but both juveniles (p = .0017) and adults (p = .0002) had higher levels than neonates (Figure 4D).
Conducting Airway Specific Gene Expression
We used microdissected tissue to isolate the injury target region, the conducting airways, and specifically measured gene expression at this site. Gene expression specifically in the conducting airways of naive, unexposed mice is presented as a ratio relative to adults of the same sex (Table 1 and Figure 5). Table 1 lists the CYP- and GSH- related genes that were changed in neonate and juvenile animals compared with adults of each respective sex. There are substantial changes in gene expression with age in both sexes underscoring the postnatal development of these genes. In Figure 5, the degree of gene enrichment (fold over adult of same sex) was greater for neonates than for juveniles for all 10 disease and disorder functions of interest (Figure 5A: cancer; cell cycle; cell death and survival; cell morphology; cellular development; cellular function and maintenance; cellular growth and proliferation; DNA replication, recombination, repair; respiratory disease, tumor morphology). The ranking order for gene enrichment (fold over adult of same sex) across all groups followed the pattern: male neonate > female neonate > male juvenile > female juvenile. Fold changes (increase = red, decrease = green) are displayed for genes associated with lung tumors (Figure 5B), DNA damage (Figure 5C), and repair of DNA (Figure 5D) pathways. These data are also presented graphically in Figures 5E and 5F (cutoff p = .05, |fold-change|≥1.2). The categories for gene enrichment (Figure 5A) and pathway analysis (Figs. 5B–F) are defined by the Ingenuity Pathway Analysis (IPA) software, based on biological interactions and functional annotations from primary literature, and public and third-party databases. Gene enrichment analysis allows the identification of gene networks (ie, cancer, cellular development) that were differentially expressed with age or NA exposure.
Significantly Changed CYP- and GSH-Related Genes in Neonate and Juvenile Versus Adult Airways
| Fold Change Relative to Adult of Respective Sex | |||||
|---|---|---|---|---|---|
| Gene | Gene Name | Female Neonate | Female Juvenile | Male Neonate | Male Juvenile |
| Cyp19a1 | Cytochrome P450, family 19, subfamily a, polypeptide 1 | −5.39 | −5.01 | ||
| Cyp2f2 | Cytochrome P450, family 2, subfamily f, polypeptide 2 | −8.11 | −8.01 | ||
| Gclc | Glutamate-cysteine ligase, catalytic subunit | −2.85 | −2.77 | ||
| Gclm | Glutamate-cysteine ligase, modifier subunit | −1.48 | −1.52 | ||
| Gpx1 | Glutathione peroxidase 1 | −1.52 | −1.27 | ||
| Gpx3 | Glutathione peroxidase 3 | −9.41 | −6.47 | ||
| Gpx4 | Glutathione peroxidase 4 | −2.37 | −1.29 | −2.00 | |
| Gpx5 | Glutathione peroxidase 5 | −2.70 | −1.51 | ||
| Gpx6 | Glutathione peroxidase 6 | −9.70 | −6.69 | ||
| Gpx7 | Glutathione peroxidase 7 | 1.77 | 1.93 | 1.46 | |
| Gsr | Glutathione reductase | −1.62 | −1.91 | −1.39 | |
| Gss | Glutathione synthetase | −1.90 | −1.87 | ||
| Gsta3 | Glutathione S-transferase, alpha 3 | −7.57 | 1.56 | −7.75 | |
| Gsta4 | Glutathione S-transferase, alpha 4 | −2.83 | −3.36 | ||
| Gstk1 | Glutathione S-transferase kappa 1 | −2.06 | −1.87 | ||
| Gstm2 | Glutathione S-transferase, mu 2 | −3.08 | −2.59 | ||
| Gstm3 | Glutathione S-transferase, mu 3 | −2.06 | 1.57 | −4.17 | −1.86 |
| Gstm4 | Glutathione S-transferase, mu 4 | −2.35 | −2.40 | ||
| Gstm5 | Glutathione S-transferase, mu 5 | 1.26 | 1.31 | 1.20 | |
| Gsto2 | Glutathione S-transferase omega 2 | −2.00 | −1.57 | ||
| Gstp1 | Glutathione S-transferase, pi 1 | −2.24 | −1.22 | −2.29 | −1.49 |
| Gstt1 | Glutathione S-transferase, theta 1 | −1.95 | −1.70 | −1.62 | −2.13 |
| Gstt2 | Glutathione S-transferase, theta 2 | −1.74 | −1.70 | ||
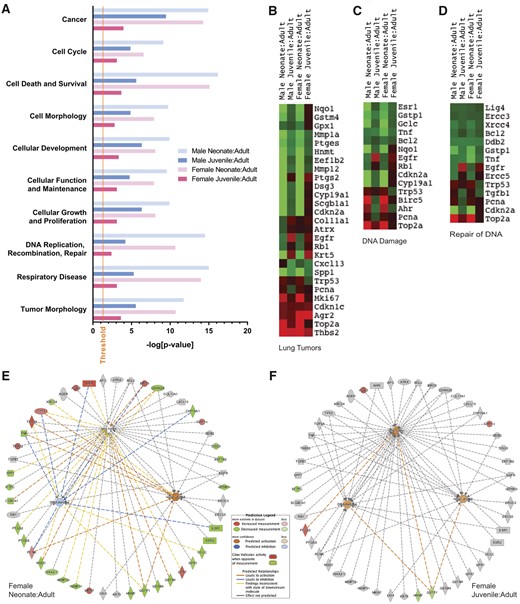
Gene expression in unexposed young mice relative to adults of the same sex. A, Gene enrichment for selected relevant disease and disorder functions with significance as determined by IPA software using Fisher’s exact test. Threshold for significance is set at –log (0.05). B–D, Heatmaps for groups of genes associated with B, lung tumors, C, DNA damage, or D, repair of DNA. E–F, Genes associated with lung tumors or DNA damage/repair with IPA prediction of activation (orange) and inhibition (blue), and with observed increases (red) or decreases (green) in young female animals relative to female adults. Gene expression is lower in neonates than adults for most genes of interest. Gene expression is similar between juveniles and adults for most genes of interest; however three genes (Agr2, Cdkn1c, Ptgs2) have increased measurement and three (Sftpc, Hnmt, Gstp1) have decreased measurement.
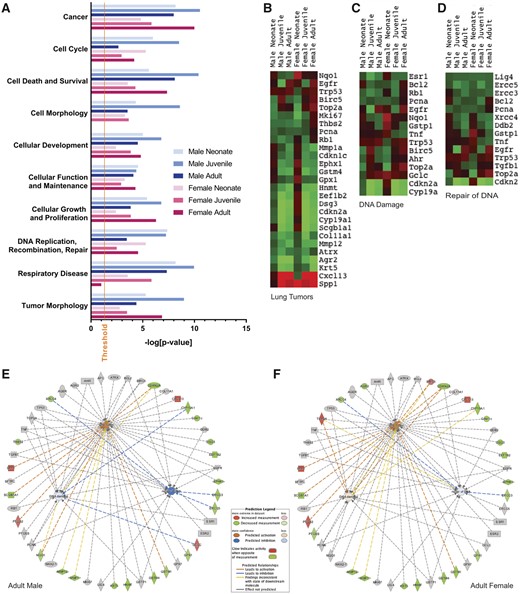
Gene expression in 10-ppm NA-exposed mice relative to unexposed, age-matched animals. A, Gene enrichment for selected relevant disease and disorder functions with significance as determined by IPA software using Fisher’s exact test. Threshold for significance is set at –log (0.05). B–D, Heatmaps for groups of genes associated with B, lung tumors, C, DNA damage, or D, repair of DNA. E–F, Genes associated with lung tumors or DNA damage/repair with IPA prediction of activation (orange) and inhibition (blue), and with observed increases (red) or decreases (green). Lung tumors are predicted to be inhibited in both sexes, with predicted activation of DNA damage pathways in females only. Birc5 and Top2a are activated with exposure in (F) adult females, but not (E) adult males. Ptges, Agr2 is decreased with exposure in adult females only. Gclc is activated with exposure in male adults only. Krt14, Nqo1, Thbs2 are decreased with exposure in male adults only.
All significant age-related gene expression changes with an effect size greater than or equal to 1.2-fold are reported in Supplementary Table 3 for samples from naive (control) animals. With a fold-change cutoff of 1.2, the number of genes with modified expression level from adult for each age group was: 68 (neonate male), 24 (juvenile male), 66 (neonate female), and 17 (juvenile female). Many of these genes were related to antioxidant and glutathione processes, and their expression was lower in younger animals (Table 1). This is consistent with previous observations of Phase II and Cyp expression during rodent lung development (Chan et al., 2013; Fanucchi et al., 2000,, 1997b). Genes that were low in neonates relative to adults (5-fold or greater) include: Cyp2f2, Gsta3, Gpx6, Gpx3, Spp1, Cyp19a1, and Dsg3 (Cdkn2a, Scgb1a1 5× in females only; Ptgs2 5× in males only). The greatest fold change relative to adult was seen for Inmt, which was markedly lower in neonates (57.2-fold in males, 70.0-fold in females). Although little-to-no information is available about the role of these genes in lung development, the elevated Inmt expression observed in this study is consistent with a study in rabbits that showed Inmt protein expression and enzyme activity increases after birth (Lin et al., 1974).
Genes that were expressed at higher levels in neonates or juveniles than in adults include Actb (housekeeping), Ahr, Birc5, Cdkn1c, Gpx7, Gstm5, Mki67, Pcna, Thbs2, Top2a, Trp53, Wifi1 (bold: 2-fold or higher in both sexes). Notably, age-related changes in gene expression were not always linear. There are a number of genes for which expression in the juvenile airway was higher than in the neonate and adult. For juvenile females—who may be predisposed to NA toxicity based on the morphological data—these genes included Agr2, Cdkn1c, Ephx2, Fabp4, Gadd45g, Gsta3, Gstm3, Gstm5, Mgst3, Pgk1, Ptgs2. For juvenile males, these genes included Agr2, Egfr, Pgk1.
Gene expression data are presented in Table 2 and Figure 6 as a ratio of exposed (10 ppm NA) to unexposed. For cancer and tumor morphology, gene enrichment (fold over unexposed) followed the pattern: juvenile male > adult female > neonate male > adult male > juvenile female > neonate female (Figure 6A). There is currently no data about lung tumor development in young animals following NA exposure; however, it has been established that lung tumors form following chronic NA inhalation in the lungs of female mice, but not males (Abdo et al., 1992; National Toxicology Program, 1992). In our dataset, lung tumors (an IPA identified gene pathway) were predicted to be “activated” in adult airways, in both sexes (Figs. 6E and 6F). DNA damage (IPA identified pathway) was slightly increased with NA exposure in females, but slightly decreased in males. DNA repair (IPA identified pathway) was strongly increased with NA in males, but weakly decreased in females (Figs. 6E and 6F). The individual genes driving these pathway differences were as follows. Birc5 (1.58-fold, p = .017) and Top2a (1.87-fold, p = .004) was increased with exposure in (Figure 6F) adult females, but not (Figure 6E) adult males. Ptges (1.34-fold, p = .046), Agr2 (2.99-fold, p = .027) was decreased with exposure in adult females only. Gclc (1.58-fold, p = .024) was increased with exposure in male adults only. Krt14 (1.81-fold, p = .024), Nqo1 (1.30-fold, p = .0009), and Thbs2 (1.47-fold, p = .023) were decreased with exposure in male adults only.
Significantly Changed CYP- and GSH-Related Genes NA Exposed Versus Unexposed at Each Age
| Fold Change Exposed Versus Unexposed at each age | |||||||
|---|---|---|---|---|---|---|---|
| Gene | Gene Name | Male Neonate | Male Juvenile | MaleAdult | FemaleNeonate | FemaleJuvenile | FemaleAdult |
| Cyp19a1 | Cytochrome P450, family 19, subfamily a, polypeptide 1 | −3.16 | −2.42 | −4.55 | −2.59 | ||
| Cyp2f2 | Cytochrome P450, family 2, subfamily f, polypeptide 2 | −7.32 | −4.79 | −9.54 | −4.95 | ||
| Gclc | Glutamate-cysteine ligase, catalytic subunit | 1.58 | 1.46 | ||||
| Gclm | Glutamate-cysteine ligase, modifier subunit | ||||||
| Gpx1 | Glutathione peroxidase 1 | −1.33 | −1.32 | ||||
| Gpx3 | Glutathione peroxidase 3 | ||||||
| Gpx4 | Glutathione peroxidase 4 | −2.03 | −1.77 | ||||
| Gpx5 | Glutathione peroxidase 5 | ||||||
| Gpx6 | Glutathione peroxidase 6 | −2.45 | −1.89 | −6.5 | −2.95 | ||
| Gpx7 | Glutathione peroxidase 7 | ||||||
| Gsr | Glutathione reductase | ||||||
| Gss | Glutathione synthetase | −1.63 | −1.53 | ||||
| Gsta3 | Glutathione S-transferase, alpha 3 | −2.82 | −2.32 | −4.07 | −1.66 | ||
| Gsta4 | Glutathione S-transferase, alpha 4 | −2.31 | −2.33 | −2.46 | −1.88 | ||
| Gstk1 | Glutathione S-transferase kappa 1 | −1.87 | −2.32 | −2.43 | −2.02 | ||
| Gstm2 | Glutathione S-transferase, mu 2 | 1.34 | −1.45 | −1.65 | −1.8 | ||
| Gstm3 | Glutathione S-transferase, mu 3 | −1.74 | −1.98 | ||||
| Gstm4 | Glutathione S-transferase, mu 4 | −1.93 | −2.05 | −2.3 | −1.83 | ||
| Gstm5 | Glutathione S-transferase, mu 5 | −1.59 | −1.94 | −1.42 | −1.45 | ||
| Gsto2 | Glutathione S-transferase omega 2 | ||||||
| Gstp1 | Glutathione S-transferase, pi 1 | ||||||
| Gstt1 | Glutathione S-transferase, theta 1 | −2.2 | −2.11 | ||||
| Gstt2 | Glutathione S-transferase, theta 2 | 1.29 | |||||
Following NA exposure, we observed significant gene expression changes in the juvenile female that are not observed in males or females of other ages or in males. Col11a1 (2.6-fold, p = .033) and Lig4 (1.33-fold, p = .02) were significantly downregulated in only the juvenile female. Sprr1a (small proline rich protein 1A) was highly upregulated with exposure in the juvenile female (30.6-fold, p < .0001), and to a lesser degree in the adult male (8.75-fold, p = .003) and female (6.37-fold, p < .0001). The only gene significantly increased with exposure in juveniles and adults of both sexes was Cxcl13 (3.14- to 3.96-fold).
A number of genes are expressed at lower levels in exposed airways than naive airways. In juvenile and adult groups, these genes included Cyp2f2 (4.79- to 9.54-fold), Scgb1a1 (2.27- to 4.26-fold), and many glutathione synthesis and metabolism genes (Gpx6, Gsta3, Mgst1, Eef1b2, Gsta4, Mgst2, Gstk1, Hnmt, Gstm4). All significant exposure-induced gene expression changes with an effect size greater than or equal to 1.2-fold are reported in Supplementary Table 4 and the CYP and GSH-related gene subsets are also listed in Table 2. Enlarged versions of Figures 5E and F and 6E and F are included as Supplementary Figures 1–4.
DISCUSSION
Our data highlight the importance of route of exposure and airway location in toxicity of chemicals in the developing lung. Contrary to previous studies of i.p. injected NA that found the youngest animals (7 days) to be the most susceptible (Fanucchi et al., 1997a), we found that older juvenile (3 weeks) animals exposed to NA vapor were more sensitive than neonates, with the female juveniles being the most susceptible. Furthermore, NA inhalation in juvenile animals resulted in damage to conducting airway Club cells that was greater in proximal than in distal airways (Figure 3). The opposite has been shown in neonatal and adult animals (distal > proximal) following i.p. NA injection (Fanucchi et al., 1997a; West et al., 2001). We also found that NA tissue burden and metabolism differed by age, but not as much by sex (Figure 4). Baseline developmental patterns of conducting airway gene expression in naive mice are consistent with the notion that female juvenile mice are more predisposed to DNA damage and lung tumors than adult or neonatal mice of either sex.
Following NA inhalation, epithelial damage was observed in both proximal and distal airways of all mice studied (Figure 3). The extent of injury in the proximal airway epithelium was either similar to (7 days) or more severe (3 weeks and adult) than in the terminal bronchiolar epithelium. This contrasts with data from the only other NA postnatal development study, which used i.p. NA injection; that study found relatively little damage in the proximal airways of 7 or 14 days male mice, but severe damage in the terminal bronchiolar epithelium (Fanucchi et al., 1997a). Injury in the larger (proximal) airways observed in the present study for adult mice is consistent with the inhalation route of exposure and known injury target sites in adult male mice by either NA inhalation or i.p. injection (West et al., 2001). We have confirmed that Club cells are the target of NA toxicity regardless of route of exposure (or sex) in the postnatal period. However, the target region within the conducting airway tree varies by route of exposure, likely reflecting local concentration of the toxicant. Taken together, this underscores the concept that the route of exposure can heavily influence the location of cytotoxicity.
Age differences in sensitivity to NA-induced airway epithelial toxicity corresponded with the gene expression data showing decreases in two Club cell markers, Cyp2f2 (highly expressed in Club cells) and Scgb1a1 (Club cell secretory protein), in exposed juvenile and adult airways relative to naive airways. The greatest exposure-related decrease in Cyp2f2 and Scgb1a1 expression was in juvenile females (Supplementary Table 4), a finding consistent with the greatest loss of Club cells in this group. Thus, the histopathology data and the gene expression data both support the conclusion that female mice are at least as susceptible as males to NA vapor-induced airway toxicity, and that juvenile female mice are the most susceptible, at or below the current OSHA standard for human exposure to NA, 10 ppm. It should be noted, however, that it is difficult to directly relate these findings to susceptibility in humans, because rodents, due to their obligate nose breathing and the first-pass clearance by the nasal mucosa, likely have a lower delivered dose to the lung than in humans. Further, there are cell biology and metabolism differences between mice and humans that could affect susceptibility, some of which could be studied using human lung cells incubated with NA in vitro.
In addition to Club cell cytotoxicity, we identified a number of toxicity-related genes with significant expression changes following NA exposure. Among these, a few are of particular note for their pattern of expression in the juvenile female mice. Sprr1a (small proline rich protein 1A) is highly upregulated by NA exposure in the juvenile female (30.6-fold). Amplified Sprr1a expression in cultured airway epithelium is known to be associated with squamous metaplasia (An et al., 1993; Tesfaigzi et al., 1996) and lung squamous cell carcinoma (Hawthorn et al., 2006). Col11a1 (collagen, type XI, alpha 1) and Lig4 (ligase IV, DNA, ATP-dependent) were significantly downregulated in only the juvenile female. The implication of this latter finding is unclear, but the decrease in Col11a1 may lead to a deficit in wound repair following acute NA injury. On the other hand, increases in Col11a1 expression is known to be associated with nonsmall cell lung cancer (Navab et al., 2011; Shen et al., 2016) and adenocarcinoma (Wang et al., 2002). In fact, Col11a1 is used as a diagnostic marker for nonsmall cell lung cancer in human patients (Shen et al., 2016). For Lig4, which is involved in double-strand DNA break repair through nonhomologous end-joining (Sengupta and Harris, 2005), a decreased expression may lead to greater probability of mutagenesis. Recently, it has been shown that both NA and its 1,2-napthoquinone metabolite are capable of adducting DNA in adult male and female mouse and primate lung tissue (Buchholz et al., 2019; Carratt et al., 2019). Further studies to follow the outcome of an inhalation exposure in juvenile females over time would be needed to understand the effect of this expression pattern on long-term lung health.
Within the mouse terminal bronchiolar airways, the abundance of Club cells shifts slightly during postnatal development; Club cells in the terminal bronchiole, the most distal conducting airways, increase in numbers by approximately 1.5-fold between 7 days of age and adulthood, when Club cells comprise >75% of the terminal bronchiolar epithelium (Plopper and Hyde, 1992a). However, although the number changes are not large in terms of percent of the epithelial population, there is a substantial postnatal maturation of enzyme systems within Club cells. Furthermore, it is important to underscore that, although enriched in Club cells, the microdissected conducting airways function as an epithelial-mesenchymal trophic unit (Evans et al., 1999), and contain other cell types including smooth muscle cells, fibroblasts, and ciliated cells, all of which contribute to the overall expression pattern measured in the dissected airways. So, while the airway microdissection method significantly enriches for airway epithelial cells in the RNA sample (especially compared with whole lung isolates), it is not specific to a single cell type. Also, because we dissected the whole airway tree and did not subdivide it by target regions, the toxic responses may be further diluted. Future studies could use the injury site information we have developed here for each age to conduct a more targeted analysis.
Pathway analysis, based on expression changes in all genes examined, indicates that, for both males (Figure 6E) and females (Figure 6F), lung tumor pathways were “activated” by NA exposure. DNA damage was slightly increased with NA exposure in females, but slightly decreased in males. DNA repair was strongly increased with NA in males, but weakly decreased in females (Figure 6). Notably, NA exposure causes the death and exfoliation of Club cells; therefore, the overall differences in airway gene expression were modified by enrichment of non-Club cell “survivor” populations, which may have different baseline expressions than Club cells. Regardless, these data reveal not only the potential for NA to induce lung carcinogenesis, but also sex differences in multiple genes that are up- or downregulated by NA exposure. The significance of the sexually dimorphic gene expression responses to NA exposure for the reported female selectivity of lung carcinogenesis following chronic NA exposure remains to be determined as animals in these younger aged exposure groups have not had long-term follow-up studies.
NA toxicity is dependent on bioactivation (Buckpitt et al., 1992,, 1995; Chichester et al., 1991; Devereux et al., 1989; Li et al., 2011), with the initial step being CYP-mediated NA epoxygenation, which can occur in both the lung and the liver (Buckpitt and Warren, 1983; Buckpitt et al., 1992). Thus, the age- and sex-specific differences in NA lung toxicity may be due to differences in rates of NA bioactivation. The primary reactive metabolite of NA, NA oxide, readily forms glutathione conjugates, which can be used as an indirect measure of the amounts of NA oxide produced in vivo. Interestingly, age-related differences were found in NA and NA-GSH levels in plasma and lung tissue of NA-exposed mice, although a sex difference was not observed. The reason for the age-related difference in NA and NA-GSH levels remains to be identified, but it may involve age-dependent changes in both NA delivery and disposition. Importantly, the NA and NA-GSH data do not explain the unique susceptibility of the juvenile female to NA toxicity, given that neither plasma nor lung levels of NA or NA-GSH were uniquely elevated in this group, compared with other groups. Nonetheless, our data do not exclude the possibility that further metabolites of NA oxide, such as NA quinones, which are also believed to be cytotoxic (Chichester et al., 1994), are preferentially produced in the juvenile female, and are thus responsible for the age- and sex-specific enhancement in NA toxicity. Further studies of in vivo formation of downstream NA metabolites are warrantied.
The formation of NA-GSH is a detoxification mechanism for NA. The ability of the lung to continue to conjugate NA oxide to GSH, thereby removing NA oxide from the lung, is influenced by the availability of GSH in the lung tissue and indirectly by the activity of GSH-synthesizing enzymes in surviving airway epithelial cells. Consequently, the hypersensitivity of juvenile female mice to NA toxicity might also be due to an age- and sex-specific deficit in the ability to synthesize GSH in the lung. In adult, male NIH Swiss mice, GSH depletion is an early event that affects all airway generations, with maximal GSH depletion occurring at 2–4 h after the start of a 15-ppm inhalation exposure (Phimister et al., 2004). Synthesis of new GSH following adult ex vivo NA exposure occurs over 6 h, with high efficiency in the parenchyma and the minor daughter airways (Duan et al., 1996). It has been suggested that low levels of NA may be sufficient to deplete GSH in target cell populations of neonatal animals (Fanucchi et al., 2000) and that cells are unable to upregulate GSH synthesis sufficiently in response at very young ages (Chan et al., 2013). However, the neonatal pups in our study had the highest levels of NA-GSH in lung tissue and the least severe cytotoxicity. This suggests that the neonatal mouse lung has sufficiently large GSH reservoirs to protect against NA inhalation exposure; but it remains to be determined whether GSH synthesis is limiting in NA-exposed juvenile female mice.
The differing sensitivities of the neonatal lung to i.p. and inhaled NA are also intriguing. It is possible that the relatively high susceptibility of the neonatal lung, compared with adult lung, to NA toxicity in the previous i.p. study (Fanucchi et al., 1997a) was driven by the formation of greater amounts of reactive NA metabolites in the liver during first-pass metabolism, or by insufficient liver detoxification of NA oxide via GSH conjugation in the neonates. It has been suggested previously that reactive NA metabolites that are produced in vivo in the liver can circulate to the lung (Buckpitt and Warren, 1983; Kanekal et al., 1991), and hepatic CYP contribution to lung toxicity induced by inhaled NA has been demonstrated recently (Kovalchuk et al., 2017). However, the hepatic contribution to lung toxicity would be less prominent with inhalation NA exposure than with i.p. NA administration, given the lower amounts of NA reaching the liver following inhalation than following i.p. injection. Future studies could examine this in more detail by determining the levels of various NA metabolites in the two different NA exposure routes.
Conclusions
The proximal airways of juvenile female C57BL/6 mice were uniquely hypersensitive to inhaled NA; cytotoxicity in the juvenile female proximal airways was between 1.4- and 4.6-fold greater than other exposed groups. The mechanism underlying this age and sex difference in susceptibility is unclear, but it appears to be unrelated to variations in the primary NA bioactivation step in the lung or the conjugation of GSH with NA oxide, though the NA tissue burden and metabolism differed by age. NA inhalation exposure induces the expression of several genes or pathways related to lung tumor development, but with minor differences between males and females. Gene expression data in naive mice were consistent with the concept that female juvenile mice are more predisposed to DNA damage and lung tumors than the other groups. Finally, NA inhalation induces acute cytotoxicity in young mice at NA vapor levels that are below the current national exposure limits set by the OSHA and the National Institute for Occupational Safety and Health (10 ppm), which further highlights the special susceptibility of the developing lung to NA exposure-related toxicity.
SUPPLEMENTARY DATA
Supplementary data are available at Toxicological Sciences online.
DECLARATION OF CONFLICTING INTERESTS
The authors declared no potential conflicts of interest with respect to the research, authorship, and publication of this article.
ACKNOWLEDGMENTS
We would like to thank Dr Michele La Merrill as well as all participants in Laura Van Winkle’s Air Pollution Journal Club for their valuable feedback on this manuscript. Histologic sectioning was assisted by Jonathan Jennings-Navarro, Kelly Keum, Arianne Medrano, Jeffrey Brown, Chelsea Tasani, and Randall Tran. Imaging for stereology was assisted by Alisha Seabert and Kelly Keum. Microdissection of lung tissues was assisted by Patti Edwards and Alisha Seabert. RNA preparation was completed in part by Chelsea Leigh Tasani. The NanoString gene expression assay processing was carried out by the DNA Technologies and Expression Analysis Cores at the UC Davis Genome Center by Cheryl Tan (Nanostring) and Vanessa Rashbrook (UC Davis Genome Center Core). We are extremely grateful to Cheryl Tan for providing additional assistance with the Nanostring analysis, and to Angela Mendenhall (Nanostring) for providing methods validation support.
FUNDING
During the period this research was conducted, Sarah Carratt was supported by a Robert Emrie Smith Memorial Research Fellowship and a NIEHS T32 Fellowship T32 ES007059. Research was funded by NIEHS Grants R01 ES020867 and R01 ES020867S1. Additional support was provided by UC Davis Cellular and Molecular Imaging Core and UC Davis Environmental Health Sciences Core Center (P30 ES023513). The DNA Technologies and Expression Analysis Core at the UC Davis Genome Center is supported by NIH Shared Instrumentation Grant S10 OD010786.

Comments