


Abstract
The gaseous olefin ethylene (ET) is metabolized in mammals to the carcinogenic epoxide ethylene oxide (EO). Although ET is the largest volume organic chemical worldwide, the EO burden in ET-exposed humans is still uncertain, and only limited data are available on the EO burden in ET-exposed rodents. Therefore, EO was quantified in blood of mice, rats, or 4 volunteers that were exposed once to constant atmospheric ET concentrations of between 1 and 10 000 ppm (rodents) or 5 and 50 ppm (humans). Both the compounds were determined by gas chromatography. At ET concentrations of between 1 and 10 000 ppm, areas under the concentration-time curves of EO in blood (µmol × h/l) ranged from 0.039 to 3.62 in mice and from 0.086 to 11.6 in rats. At ET concentrations ≤ 30 ppm, EO concentrations in blood were 8.7-fold higher in rats and 3.9-fold higher in mice than that in the volunteer with the highest EO burdens. Based on measured EO concentrations, levels of EO adducts to hemoglobin and lymphocyte DNA were calculated for diverse ET concentrations and compared with published adduct levels. For given ET exposure concentrations, there were good agreements between calculated and measured levels of adducts to hemoglobin in rats and humans and to DNA in rats and mice. Reported hemoglobin adduct levels in mice were higher than calculated ones. Furthermore, information is given on species-specific background adduct levels. In summary, the study provides most relevant data for an improved assessment of the human health risk from exposure to ET.
The gaseous olefin ethylene (ET, CAS No.: 74-85-1), a basic building block for the chemical industry, is the largest volume organic chemical worldwide (American Chemistry Council’s Olefin Panel). It is also used for controlled fruit ripening by utilizing its properties as natural ripening hormone in plants (Frontline Services Australia, 2013). ET is found ubiquitously in the environment. Main environmental sources are vegetation and combustion of organic material as well as production and use of ET (IARC, 1994a). In the air of rural areas, its concentrations are generally below 15 µg/m3 (about 13 ppb). In urban air, ET concentrations vary from 4 to 805 µg/m3 (Alberta Environment, 2003). ET concentrations in the ambient air surrounding a large ET-producing facility in Canada were monitored between September 1999 and December 2001 (Alberta’s Ethylene Crop Research Project, 2002). They were generally below 100 ppb but sometimes up to 300 ppb. ET may also be found at workplaces. For instance, in a large Canadian ET production facility, general workplace exposures to ET were recorded to be below 15 ppm (NOVA Chemicals, 2012). In mice (Artati, 2010; Lawrence and Cohen, 1985), rats (Shen et al., 1989), and humans (Filser et al., 1992; Shen et al., 1989), small amounts of ET are produced endogenously. Several endogenous ET sources have been discussed (summarized in Csanády et al., 2000). If inhaled, the major part of ET is exhaled unchanged by the mammalian organism (Filser, 1992). A smaller part is metabolically converted to ethylene oxide (EO, CAS No.: 75-21-8), as has been demonstrated directly in vivo in rats (Fennell et al., 2004; Filser and Bolt, 1984; Maples and Dahl, 1993) and in vitro in liver microsomes of rats (Li et al., 2011a; Schmiedel et al., 1983), mice, and humans (Li et al., 2011a). In these species when exposed to ET, the formation of EO-characteristic hydroxyethyl adducts to hemoglobin and/or DNA was shown (mice: Ehrenberg et al., 1977; Segerbäck, 1983; Walker et al., 2000; Wu et al., 1999; rats: Eide et al., 1995; Rusyn et al., 2005; Walker et al., 2000; Wu et al., 1999; humans: Filser et al., 1992; Kautiainen and Törnqvist, 1991; Törnqvist et al., 1989). EO is a direct protein- and DNA-alkylating agent, is mutagenic in prokaryotic and eukaryotic—including mammalian—cells, and carcinogenic in mice and rats (reviewed in IARC, 1994b, 2008, 2012). In these monographs, IARC evaluated EO as carcinogenic to humans, based on “sufficient evidence in experimental animals for the carcinogenicity of ethylene oxide” and on the strength of mechanistic evidence.
Although ET is metabolized to EO, ET was neither mutagenic in Salmonella typhimurium (Victorin and Ståhlberg, 1988) nor mutagenic/genotoxic in rodents (Vergnes and Pritts, 1994; Walker et al., 2000). In one long-term carcinogenicity study in rats exposed up to 3000 ppm ET, no chronic toxic or carcinogenic effects were detected (Hamm et al., 1984). This result had been expected and was explained based on hemoglobin and DNA adducts, on some toxicokinetic studies, and on mutagenicity studies conducted in ET- and EO-exposed animals (Bolt and Filser, 1984; Osterman-Golkar and Ehrenberg, 1982; Walker et al., 2000). The 3 working groups concluded that the EO burden from exposures to ET was too low to produce a significant carcinogenic effect in a standard long-term animal study even at high ET exposure concentrations. In ET-exposed humans, the EO burden is still uncertain since no measured EO concentrations have been published. IARC (1994a) concluded that “the available data in humans did not allow the Working Group to evaluate the carcinogenicity of ethylene to humans.” Furthermore, only limited data are available on the EO burden in ET-exposed rats (Fennell et al., 2004; Filser and Bolt, 1984; Maples and Dahl, 1993). No measured EO data have been published in ET-exposed mice. In order to provide a reliable basis for cancer risk assessment of ET, it was the goal of the present work to determine the EO concentrations in blood of mice, rats, and volunteers exposed to various constant ET concentrations ranging from 1 up to 10 000 ppm in male B6C3F1 mice and male Fischer 344/N rats and from 5 up to 50 ppm in humans.
MATERIALS AND METHODS
Chemicals
Synthetic air 5.5 (a mixture of pure oxygen [20%] and pure nitrogen [80%]) helium 5.0, hydrogen 5.0, oxygen 4.5, nitrogen 5.0, ET 3.5, and EO 3.0 were obtained from Linde, Unterschleißheim, Germany. Diethyl maleate (≥ 96%) and 13C2-EO (99 atom% 13C) were purchased from Sigma-Aldrich, Taufkirchen, Germany. Soda lime “Drägersorb 800” was from Drägerwerk, Lübeck, Germany; Ketamine 10% from Medistar, Ascheberg, Germany; Xylazine 2% from CP Pharma, Burgdorf, Germany; and Heparin-Natrium-25000-ratiopharm from Ratiopharm, Ulm, Germany.
Animals
Male Fischer 344/N rats (body weight: 230–290g) and male B6C3F1 mice (body weight: 23–30g) were purchased from Charles River Wiga Deutschland, Sulzfeld, Germany. All experimental procedures with animals were performed in conformity with the Guide for the Care and Use of Laboratory Animals (National Research Council, 1996). For at least 5 days before use, 2 rats or 5 mice each were housed in the Institute of Molecular Toxicology and Pharmacology in a Macrolon type III cage placed in an IVC top flow system (Tecniplast, Buguggiate, Italy). This system provided the animals with filtered room air. A constant 12-h light/dark cycle was maintained in the chamber room. Animals had free access to standard chow (Nr. 1324 from Altromin, Lage, Germany) and tap water.
Humans
Four male, healthy, nonsmoking volunteers (A, B, C, and D), all professional toxicologists, participated in the ET exposure study. The study protocol was reviewed and approved by the Ethics Committee of the Medical Faculty of the Technische Universität München. Respiratory parameters of the volunteers were established by determining breathing frequencies and tidal volumes using a spirometer (“Spirotest Junior”; Jaeger, Würzburg, Germany). Pulmonary ventilation was calculated as the product of breathing frequency and tidal volume. These parameters together with body weights and ages of the volunteers are given in Table 1.
Physiological Parameters of the Volunteers
| Volunteer | Age (Years) | Body Weight (kg) | Breathing Frequency (1/min) | Tidal Volume (l) | Pulmonary Ventilation (l/min) |
|---|---|---|---|---|---|
| A | 62 | 88 | 11.93±1.15 | 0.68±0.12 | 8.00±0.77 |
| B | 49 | 80 | 12.29±1.98 | 0.67±0.08 | 8.19±1.51 |
| C | 61 | 75 | 15.65±1.27 | 0.73±0.04 | 11.14±1.04 |
| D | 42 | 81 | 15.01±0.93 | 0.48±0.07 | 7.17±0.65 |
| All volunteers | 53.8±9.98a | 81.0±5.35a | 13.7±2.78b | 0.64±0.17b | 8.63±2.09b |
Note. All volunteers were males. All individual breathing parameters represent means ± SDs of 7 determinations by spirometer measurement performed immediately after the end of an exposure. Each determination included about 13 breaths.
aMeans ± SDs of the individual data.
bMeans of the individual data, SDs obtained by error propagation.
Studies in Rodents
Animals were exposed to ET in closed all-glass chambers (for a more detailed explanation of the exposure system, see Filser, 1992). With respect to inhaled ET, the exposure system was “open” because the ET exposure concentrations were maintained quasi-constant in spite of the ET consumption by metabolism. In some experiments (“Experiments with EO Measurement in Exhaled Air”), steady-state EO concentrations in blood were calculated from plateau concentrations of exhaled EO in the air of the closed chamber. At plateau, the concentration in chamber air of an exhaled, metabolically formed gas is in thermodynamic equilibrium with the concentration in blood (see Filser et al., 2007). In most cases (“Experiments with EO Measurement in Blood”), EO was determined directly from the blood of the exposed animals. Principally, closed-chamber exposures result in higher blood concentrations than that occur in open systems, where no reinhalation takes place. However, for an internally produced, exhaled gas, the difference between venous blood concentrations at steady state in a closed and in an open system is less than 10%, provided that the blood-to-air partition coefficient is higher than 50 as had been investigated by physiological toxicokinetic modeling (Filser et al., 2007).
Experiments With EO Measurement in Exhaled Air
Five mice or 2 rats were exposed together for 6h in 2.8-l chambers (mice) or 6.6-l chambers (rats). For trapping exhaled CO2, each chamber contained about 30g of soda lime. The loss of atmospheric CO2 was automatically compensated by pure oxygen. This process was enabled by an apparatus consisting of an all-glass T-pipe, the middle part was connected via a silicone tube to the pressure-reducing valve of an oxygen cylinder, and the 2 arms went via water traps either to the exposure chamber or to room air. Because the water trap which was directly connected to the chamber contained a slightly higher level of water than the one that was open to room air, the oxygen flow went to the room air until the original air pressure in the chamber was somewhat reduced because of the trapping of exhaled CO2 by soda lime. At this moment, oxygen bubbled into the chamber atmosphere instead of the room air, thus restoring the original partial pressure of oxygen. The system is described in detail in Filser (1992). Target ET concentrations in air were 0, 1, 3, 10, or 30 ppm in mice and 0, 1, or 3 ppm in rats. In the exposure studies with mice, actual ET concentrations (ppm), given as means ± standard deviations (SDs) with numbers of measurements in brackets, were 1.0±0.09 (19), 1.24±0.09 (16), 3.02±0.21 (25), 3.18±0.10 (16), 10.1±0.65 (25), 10.7±0.40 (15), 30.0±2.06 (21), 30.2±1.26 (20), or 30.2±1.95 (20). In the studies with rats, they were 1.04±0.04 ppm (33) or 2.99±0.07 ppm (33). ET was determined every 10–20min by collecting air samples from the chamber via a Teflon-coated silicone rubber septum using disposable syringes (Braun, Melsungen, Germany). The samples were immediately injected into a gas chromatograph (GC) equipped with a flame ionization detector (FID, see GC/FID method A) and analyzed for ET. If required, ET was collected from a storage desiccator that contained a preset ET concentration and injected into the exposure chamber in order to maintain the desired ET concentration.
Metabolically produced, exhaled EO was also monitored during the exposure period. Air samples of 8ml (1 and 3 ppm ET) or 2ml (10 and 30 ppm ET) were collected at selected time points from the atmosphere using EO-free disposable Icogamma syringes (Novico SpA, Ascoli Piceno, Italy). Immediately thereafter, samples were analyzed for EO by means of a GC equipped with a mass-selective detector (MSD, see GC/MSD method). EO concentrations in blood (µmol/l) at steady state were calculated by multiplying the atmospheric EO concentrations at plateau (ppm) with the blood-to-air partition coefficient of EO (61, Csanády et al., 2000) and by dividing the result by 25.13 (the molar volume [l] of an ideal gas at 25°C and 740 torr).
Experiments with EO Measurement in Blood
A system consisting of a large 63-l glass sphere was used according to Lee et al. (2005) for exposing animals to quasi-constant concentrations of ET in the atmosphere. The sphere contained 30g of soda lime and a circular, foldable floor plate of solvent-inert polyvinylidene fluoride with a diameter of 40cm. It was equipped with an 8-cm-long neck (inner diameter: 15cm) that was closed by a round all-glass lid with 4 ports of which one was connected to the above-described automatic oxygen supply, and the 3 others could be closed by Teflon-coated silicon rubber septa. Animals were exposed either whole body inside the glass sphere (up to 6 animals together, each sacrificed immediately before the time point of its blood collection) or nose only (single animals) outside the glass sphere. Here, the atmosphere in the sphere was recirculated via 2 of the ports at a continuous flow by means of a peristaltic pump and silicon tubing through a patented (Filser and Kreuzer, 1994; Kreuzer, 1992) all-glass flow-through nose-exposure chamber of 290ml (mouse) or 750ml (rat). ET was repeatedly injected into the glass sphere for compensating its loss due to metabolism or was collected from it and the nose-exposure chamber via a septum in the glass lid of the sphere and in the nose-exposure chamber, respectively. Inside the glass sphere, mice or rats were exposed for up to 6h to ET target concentrations (ppm) of 30, 100 (mice only), 130 (rats only), 300, 1000, and 10 000. Measured ET concentrations (ppm), given as means ± SDs with numbers of measurements in brackets, were 32.6±2.6 (251), 102.3±4.7 (194), 306.2±16.3 (100), 1003±44.0 (196), or 10 359±746 (251) in mice and 31.3±2.8 (256), 132.1±8.8 (127), 307.1±20.3 (378), 1023±73.5 (258), or 10 051±1071 (346) in rats. The exposure procedure outside the glass sphere facilitated the measurement of EO in blood at rather narrow time windows. Here, animals were exposed for up to 45min to ET target concentrations of 100 (mice only), 300, 1000, or 10 000 ppm. Measured ET concentrations (ppm), given as means ± SDs with numbers of measurements in brackets, were 101.7±4.3 (129), 282.0±12.5 (136), 1088±80 (141), or 10 385±504 (73) in mice and 302.6±18.1 (14), 984±71 (80), or 9824±180 (10) in rats.
Exposures to a given ET concentration were repeated up to 3 times for each time point of EO measurement. By means of GC/FID method A, ET concentrations were measured at intervals of 5 and 20min in the atmosphere of the glass sphere and in the nose-exposure chamber, respectively.
At a preselected time point, an animal was taken out from the exposure system followed by immediate cervical dislocation (mouse) or by opening the thorax (rat). Rats had been anesthetized 30min before sacrifice according to Lee et al. (2005) by treatment with a mixture containing 0.8ml Ketamine 10% and 1ml Xylazine 2% per kg body weight. Within 1min after the end of an ET exposure, blood samples of about 0.3ml (mice) or about 3ml (rats) were collected from the inferior vena cava by means of EO-free disposable syringes that had been rinsed with Heparin-Natrium-25000-ratiopharm. The syringes contained 10 µl (mice) or 20 µl (rats) of diethyl maleate in order to deplete glutathione in blood. In addition, blood samples were collected from 20 nonexposed control animals of each of both species. During blood sampling, the internal standard 13C2-EO (mouse: 0.7ml of 9 ppm; rat: 1ml of 240 ppm, quantified by GC/FID method B) was injected into a preweighed headspace vial of 13ml that had been closed by a Teflon-coated rubber septum. After injection of the blood sample, the headspace vial was weighed again and incubated for 15min at 37°C in a shaking water bath. Thereafter, 2-ml air sample was removed from the headspace using a gastight glass syringe and analyzed for EO and 13C2-EO by means of the GC/MSD method.
Studies in Volunteers
Four volunteers were exposed to ET, volunteers A, B, and C to ET target concentrations of 5, 20, and 50 ppm, respectively, and volunteer D to 5 and 20 ppm (means ± SDs of measured ET concentrations [ppm] can be seen in Table 3). ET exposures lasted exactly 4h. The volunteers were initially exposed to the low, then to the medium, and finally to the high ET concentration. The shortest time interval between exposures was 2 days. Exposures of the 4 volunteers were conducted using the open exposure system described in detail in Filser et al. (2000, 2008). Briefly, a stream of an ET-air mixture flowed through a polytetrafluoroethene tube at a constant flow rate from an ET storage container into a chemical exhaust hood. The mixture was inhaled via a 2-valve breathing mask that was connected to the tube by a T-pipe. Immediately in front of the inhalation valve, the concentration of inhaled ET was repeatedly measured by collecting air samples via a septum. At selected time points, exhaled breaths were collected in gasbags that had been mounted directly behind the exhalation valve.
One minute after starting the exposures and subsequently every 10–15min, samples of inhaled air were collected and immediately analyzed for ET. Every 30min, 2 exhaled breaths were collected in a gasbag of 2.5 l equipped with a silicone rubber septum (Plastigas from Linde). Concentrations of ET in exhaled pulmonary air were determined in all gasbags, those of EO only in those gasbags that were used every hour. These bags contained 3g of CaSO4 in order to reduce humidity when determining EO by GC/MSD. Immediately after collecting an air sample for the analysis of exhaled ET, the internal standard 13C2-EO was injected into the gasbag: 4ml of 1, 4, and 10 ppm of 13C2-EO, prepared and quantified in desiccators (determination by GC/FID method B), were injected at ET-exposure concentrations of 5, 20, and 50 ppm, respectively. The air in the gasbags used for EO determination was dried at room temperature for 1 day before an air sample of 10 or 20ml was withdrawn and analyzed for EO. Prior to each ET exposure of a volunteer, a one-point calibration was prepared in a gasbag that contained mixed-exhaled air of this volunteer and an EO concentration of about 2, 8, or 20 ppb, depending on the exposure concentration of ET in the experiment to be conducted. The exact concentrations of the amounts of 13C2-EO or EO injected in a gasbag were calculated after determining the air volume in the gasbag by measuring the displacement of water in a container using a graduated cylinder.
Before starting an exposure and every hour thereafter until the end of the exposure period, a venous blood sample of 10ml was collected from the forearm via an indwelling catheter by means of an EO-free disposable syringe which had been rinsed with Heparin-Natrium-25000-ratiopharm. The blood was instantaneously injected in a diethyl maleate (20 µl)–containing, weighed 50-ml headspace vial that had been closed by a septum. Immediately thereafter, 20ml of air was removed through the septum of the vial using a gastight glass syringe. At exposures to 5, 20, and 50 ppm ET, 1ml of 1, 4, and 10 ppm, respectively, of the internal standard 13C2-EO (prepared and quantified in desiccators; determination by GC/FID method B) was injected into the vial, immediately before injecting the blood sample. Subsequently, the blood-containing vial was weighed again and incubated for 15min at 37°C in a shaking water bath. Then, a stainless steel cannula closed with a cone was inserted via the septum into the blood layer. The cone was removed, and 40ml of the gas in the vial were collected using a gastight glass syringe equipped with a second cannula, thereby bubbling room air entering via the first cannula through the blood sample. The gas sample was injected through a septum into an empty gas-sampling 0.6-l Tedlar bag (Alltech, Worms, Germany). The bag was frozen for 20min at −80°C in order to diminish humidity which would disturb the GC/MSD method for EO measurement. Thereafter, a gas sample of up to 20ml was collected from the Tedlar bag using a gastight glass syringe and analyzed for EO and 13C2-EO.
Concentrations of ET in inhaled and exhaled air were measured by the GC/FID method A, and concentrations of EO and 13C2-EO were determined by the GC/MSD method.
Gas Chromatography
GC/FID method A.
Atmospheric ET concentrations were determined using a GC (GC-8A; Shimadzu, Duisburg, Germany) equipped with a FID. Air samples of 4ml were collected by means of a disposable syringe equipped with a stainless steel needle. Of each sample, 1.5ml was injected onto the column via a gas sample loop at room temperature. Separations were done isothermally at 130°C on a stainless steel column (3.5 m × 2mm ID) packed with Tenax TA (60–80 mesh; Chrompack, Frankfurt, Germany). Nitrogen was used as carrier gas with a pressure of 1.5kg/cm2. The detector was kept at 200°C and was supplied with hydrogen (0.6kg/cm2) and synthetic air (0.6kg/cm2). The retention time of ET was 2.5min. Areas under the peaks were determined using the integrator C-R6A Chromatopac from Shimadzu. For quantification, one-point calibrations with ET were conducted in the concentration range of the corresponding experiment. ET concentrations were at least 2 orders of magnitude above the detection limit of 0.07 ppm.
GC/FID method B.
This method was used for the determination of atmospheric EO and 13C2-EO in storage and calibration desiccators. GC system and detector conditions were the same as in the GC/FID method A. Gas samples of 500 µl were taken by means of a gastight glass syringe (number 1750; Hamilton, Bonaduz, Switzerland) and injected into the heated injector (200°C). Separations were done isothermally (110°C) on a stainless steel column (2.5 m × 2mm ID) packed with Tenax TA (60–80 mesh). Nitrogen was used as carrier gas with a pressure of 3.0kg/cm2. The retention time of EO was 3.0min. For quantification, areas under the peaks or peak heights were determined, areas by means of the integrator C-R6A Chromatopac and peak heights manually. Equal EO and 13C2-EO concentrations gave the same areas under the peaks or peak heights. Concentrations of EO and 13C2-EO were at least 5 times above the detection limit of 0.2 ppm. Before conducting an ET-exposure experiment, a one-point calibration was performed for EO in the range of the expected concentration.
GC/MSD method.
Metabolically formed EO and its internal standard 13C2-EO were determined according to a GC/MSD method developed for the measurement of exhaled propylene oxide (Filser et al., 2008). In most cases, a GC 6890 was used. It was equipped with a MSD 5973N (both from Agilent, Waldbronn, Germany) and a thermal desorption cold trap injector (CP-4010 with the trap CPSil 5 CB, 30cm × 0.53mm; Chrompack). Only for the determination of EO in exhaled air of rats, an older GC 5890 equipped with a MSD 5970 (both from Agilent) was used. The gas sample was slowly injected (within several minutes) into the injector system containing a precooled trap (−150°C; helium flow through the trap: 20ml/min). Thereafter, the trap was heated to 200°C within a few seconds and maintained at this temperature for 5min. Separation of the gas mixture was done on a capillary column (PoraPlot U, 25 m length, 0.32mm ID, 10 µm film, with particle trap 2.5 m, from Chrompack) using helium as carrier gas with a system pressure of 80 kPa. The temperature program of the column oven was started in parallel with the heating process of the trap. The initial temperature of 70°C was held for 1min. Then, it increased with a rate of 8°C/min to 140°C and remained constant for 1min. Thereafter, it increased again to 170°C with a rate of 20°C/min and remained constant for 10min followed by a final decrease to 70°C. The temperature of the transfer line was kept at 280°C. The MSD temperatures of the ion source and the quadrupole were 250°C and 150°C, respectively. Two ionization modes were used for the MSD. In rats, exhaled EO was quantified in the electron ionization mode (70eV) by “selected ion monitoring” (SIM) recording the mass fragments m/z 29. In all other cases, EO and 13C2-EO were quantified in the positive chemical ionization mode with methane as reactant gas. The M-H+ ions m/z 45 and 47 (SIM) were recorded for EO and 13C2-EO, respectively. The retention time of EO and its internal standard varied around 6min, depending on the humidity of the gas samples. Heights and areas of the peaks were determined manually using the software MSD ChemStation D.03.00.611 from Agilent. Calibration curves constructed with EO and with the ratio of EO/13C2-EO, respectively, were linear in the concentration ranges investigated. Equal EO and 13C2-EO concentrations gave the identical areas under the peaks and peak heights. In air samples, limits of detection of EO, defined as 3 times the background noise, were 0.45 ppb in mice, 4 ppb in rats (older GC/MSD system), and 0.8 ppb in humans. The limits of detection of EO in blood samples were around 80 nmol/l in rodents and 3–5 nmol/l in humans.
Kinetic Modeling of Hemoglobin- and DNA-Adducts
Levels of the hydroxyethyl adducts of metabolically formed EO to the N-terminal valine of hemoglobin (N-(2-hydroxyethyl)valine; HEV) and to DNA guanine (N7-(2-hydroxyethyl)guanine; HEG) were modeled according to Csanády et al. (2000) on the basis of EO blood concentrations using the program Berkeley Madonna X (Mach-O), version 8.3.22 (www.Berkeleymadonna.com). Required species-specific lifetimes of hemoglobin (mouse: 960h; rat: 1440h; human: 3024h) and rate constants—l/(h × g hemoglobin) and l/(h × g DNA)—of the formation of HEV (mouse: 0.32×10⁻⁴; rat: 0.46×10⁻⁴; human: 0.45×10⁻⁴) and HEG (all species: 0.94×10⁻⁴) were taken from Table 3 in Csanády et al. (2000). The rate constants of the chemical reactions of EO with hemoglobin of the 3 species and with calf thymus DNA leading to HEV and HEG had been determined at 37°C and pH 7.4 (hemoglobin) or 7.2 (DNA) in vitro by Segerbäck (1990) and (1983), respectively. The depurination rate constant for rodent HEG was assigned a value of 0.011/h which corresponds to a half-life of 2.63 days. It is within the range of the values determined by Walker et al. (1992) in most of the tissues of male B6C3F1 mice (1.0–2.3 days) and Fischer 344 rats (2.9–4.8 days) after exposures to EO (mice: 100 ppm; rats: 300 ppm). For humans, we did not find a published HEG-depurination rate constant. Therefore, we used the value of the spontaneous (chemical) depurination rate (ln2/90h = 0.0077/h) that had been determined in vitro in calf thymus DNA (Segerbäck, 1983). Generally, a value derived from in vivo experiments is of higher relevance for in vivo exposures than that determined in vitro because it includes the glycosylase-mediated depurination in addition to the spontaneous one. The use of the chemical depurination rate constant results in a “worst-case” prediction because it yields larger predicted HEG-adduct levels than are obtained when using an in vivo–derived higher rate constant. In order to test the validity of model calculations, HEV levels were computed for continuous exposures to different, constant blood concentrations of EO for time spans that covered the species-specific lifetimes of hemoglobin. Two procedures were applied. Either the differential equations describing the formation rates and the time-dependent changes of the HEV levels were solved numerically using the program Berkeley Madonna X or an explicit function (equation 4 in Filser et al., 1992) was used. Because both the methods yielded exactly the same HEV levels for the end of the hemoglobin lifetime, model-calculated adduct levels were considered reliable.
Estimation of the Half-life of EO in Blood
The concentration-time courses of EO measured in blood of mice or rats at target exposure concentrations of 30 ppm ET were used to estimate the species-specific half-lives of EO. The time points at which the fitted accumulation phases reached half of the fitted plateau concentrations were taken as half-lives.
Statistics
Linear regression analysis and standard errors of the means of slopes (SEMs), arithmetic means and SDs, as well as one-way ANOVA followed by Bonferroni’s post test for multiple comparisons were calculated using Prism 5 for Mac OSX (GraphPad Software, San Diego, California). A statistically significant difference was defined as p ≤ .05.
RESULTS
Studies in Rodents
Measured concentration-time courses of EO in blood and in exhaled closed-chamber air of ET-exposed mice and rats are presented in Figures 1A, 1B, 2A, and 2B. Up to an ET exposure concentration of 30 ppm, EO concentrations increase rather continuously until reaching plateaus after about 2h of exposure. Half-lives (t1/2) of EO, estimated from the concentration-time courses of EO in blood at 30 ppm ET, were 8.9min in mice and 15min in rats. Both values agree with those of 9min in mice (Csanády et al., 2000; Ehrenberg et al., 1974) and those of 10–19min in rats (Brown et al., 1996; Csanády et al., 2000; Osterman-Golkar et al., 1983). From the t1/2 values, elimination rate constants (ke) of 4.7 and 2.8/h were calculated for mice and rats, respectively (ke [1/h] = ln2×60/t1/2 [min]). At higher exposure concentrations, initial EO peaks are seen that are narrow in mice and broad in rats. Then, EO concentrations in mice decline very rapidly to plateaus. In rats, the declines of the EO concentrations are much slower. At identical ET exposure concentrations, EO concentrations are higher in rats than that in mice. In both species, no background EO above the detection limit was seen at 0 ppm ET.
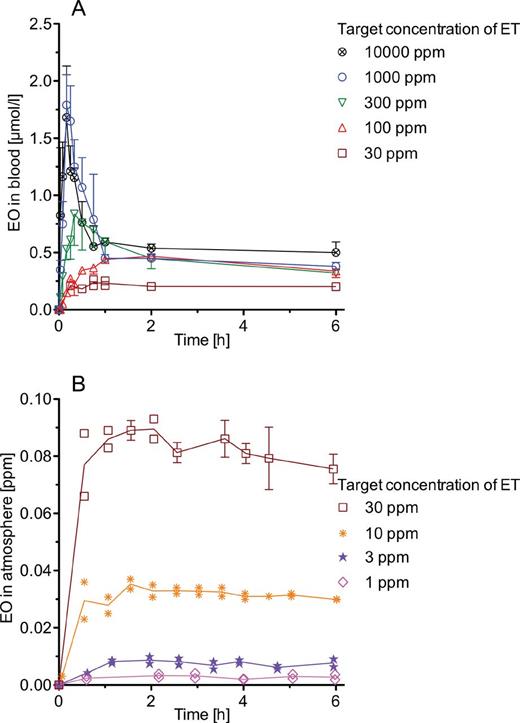
EO in mice exposed to constant concentrations of ET at target concentrations between 1 and 10 000 ppm. A, Time courses of EO in blood at the end of exposures lasting up to 6h. Each data point for which an error bar (+ or – SD) is given represents a mean value obtained in 3 animals. Each other data point was obtained with 1 animal. Lines connect means and individual data points, respectively. B, Time courses of EO in the air of closed chambers (2.8 l) each were containing 5 animals during one 6-h exposure. Each data point for which an error bar (± SD) is given represents a mean value obtained in 3 exposures to the same target concentration. Each other data point was measured during 1 experiment at a given target concentration. There were 3 exposures to 30 ppm ET and 2 exposures to 10, 3, or 1 ppm ET. Lines connect the mean values. In the nonexposed control group, EO concentrations were below the limit of detection. Abbreviations: EO, ethylene oxide; ET, ethylene.
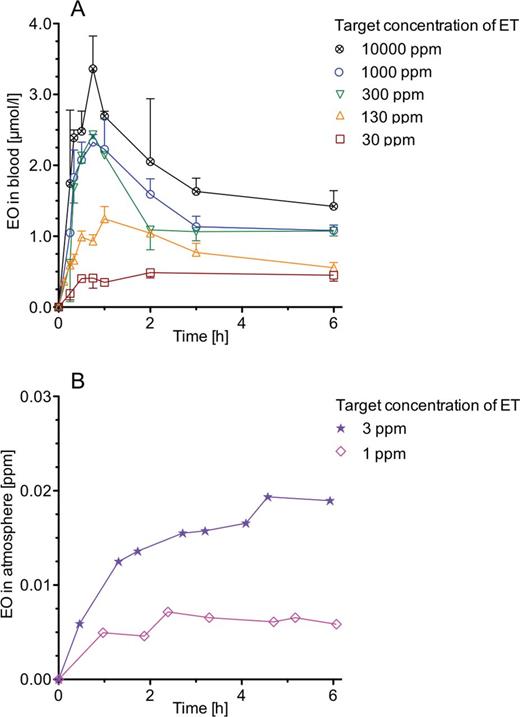
EO in rats exposed to constant concentrations of ET at target concentrations between 1 and 10 000 ppm. A, Time courses of EO in blood at the end of exposures lasting up to 6h. Each data point for which an error bar (+ or – SD) is given represents a mean value obtained in 3 animals. Each of the few other data points was obtained with 1 animal. Lines connect means and individual data points, respectively. B, Time courses of EO in the air of closed chambers (6.6 l) during 6-h exposures to 3 or 1 ppm ET. Each chamber contained 2 animals. Lines connect the data points that show measured EO concentrations. In the nonexposed control group, EO concentrations were below the limit of detection. Abbreviations: EO, ethylene oxide; ET, ethylene.
Table 2 gives steady-state concentrations of EO in blood of mice and rats, which were calculated from the EO exhalation curves presented in Figures 1B and 2B. In addition, EO plateau concentrations are presented that were measured directly in blood at an ET exposure concentration of 30 ppm (Figs. 1A and 2A). As shown in mice for the ET concentration of 30 ppm, EO determinations from exhaled air or from blood yield almost identical results. Up to 30 ppm, the dependence of the EO concentration from the ET exposure concentration is linear in both species.
Average Concentrations of EO in Blood of Mice and Rats in the Time Frame Between 2 and 6h After Starting Exposures to Constant Concentrations of Atmospheric ET Between 1 and 30 ppm
| EO in Blood (µmol/l), Mean ± SD; Number of Measurements | ||
|---|---|---|
| ET in Air (ppm) | Mouse | Rat |
| 1 | 0.0069±0.0021a; 10 | 0.0156±0.0012a; 5 |
| 3 | 0.0185±0.0035a; 12 | 0.0418±0.0044a; 5 |
| 10 | 0.0773±0.0040a; 15 | Not done |
| 30 | 0.198±0.0243a; 17 | Not done |
| 30 | 0.203±0.0263b; 6 | 0.469±0.0742b; 6 |
Note. aCalculated from the EO concentrations measured in air [ppm] (see Figs. 1B and 2B) by multiplication with the blood-to-air partition coefficient (61; Csanády et al., 2000) and by division with 25.13 l (the molar volume of an ideal gas at 25°C and 740 torr; for explanation of the procedure, see Filser et al., 2008).
Mean values of the areas under the EO concentration-time curves in blood of mice and rats resulting from the 6-h exposures to ET were calculated using the trapezoidal rule. To these values, the ratios of the last measured concentrations to the strain-specific values of ke were added in order to obtain the areas under the EO concentration-time curves in blood from t = 0 to time infinity (AUC). Figure 3 depicts these AUCs in dependence of the ET concentrations. In rats, the AUCs are larger than that in mice. At ET concentrations below 30 ppm, the AUCs differ by approximately a factor of 2 between both species. With increasing concentrations of ET, the difference increases up to 3-fold at 10 000 ppm ET. In mice, nearly 70% of the maximum AUC value is reached at 100 ppm ET; in rats, however, this percentage is reached only at 1000 ppm ET.
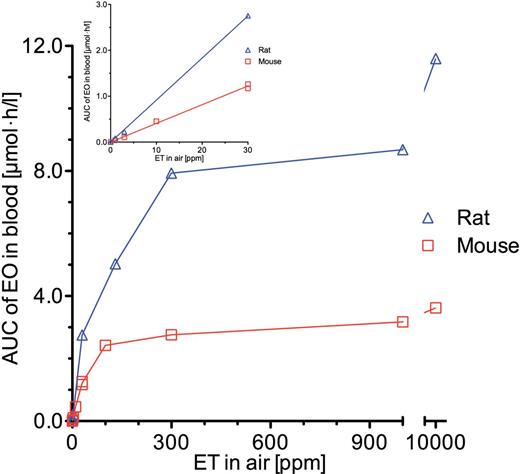
AUCs (mean values) under the concentration-time curves of EO in blood of mice or rats exposed for 6h to constant concentrations of ET at target concentrations between 1 and 10 000 ppm. The inset shows the AUCs at low ET concentrations of up to 30 ppm. The lines in the larger graph are connections of the data points. The lines in the inset represent linear regressions through the origin. The slopes ± SEMs (µmol EO × h/l blood per ppm ET) were 0.0408±0.000838 (mice) and 0.0916±0.000974 (rats). Abbreviations: AUC, areas under the EO concentration-time curves in blood from t = 0 to ∞; EO, ethylene oxide; ET, ethylene.
Studies in Humans
Concentrations of ET in inhaled and exhaled pulmonary air as well as EO concentrations in exhaled air and in venous blood measured in the ET exposures of the volunteers are given in Figure 4. Means ± SDs of these concentrations are presented in Table 3. Also shown in this table are EO concentrations in venous blood that were calculated from EO concentrations in exhaled air. There were no statistically significant differences neither between corresponding ET concentrations in inhaled and exhaled air, nor between corresponding calculated and measured EO concentrations in blood. Nevertheless, because ET in the exhaled air was always somewhat lower than that in inhaled air, the differences between these ET concentrations were used to estimate the pulmonary retention of ET, the product of the ratio of the difference between the ET concentrations in inhaled and exhaled air to the ET concentration in inhaled air with 100. It was 6.29±1.47% (mean ± SD; n = 11). Measured and calculated EO concentrations in blood were used to construct Figure 5, which shows the concentrations of metabolically formed EO in the blood of the volunteers at pseudo steady state (after 2h of exposure to ET) in dependence of the ET exposure concentration. The dashed lines represent the best fits to the volunteer-specific data and the solid line the best fit to the data of all volunteers. All fits were obtained by linear regression analyses through the origin. The slopes (nmol EO/l blood per ppm ET in air) were 1.164 in volunteer A and 1.754 in volunteer D. The slopes obtained in volunteers B and C were not statistically significantly different from those calculated for volunteers D and A, respectively, but those of volunteers A and C differed significantly from those of volunteers B and D. The slope calculated by means of the data of all volunteers together was 1.431. All of the slopes were significantly different from zero (p < .0001). The linear relationship between the EO concentration in blood and the ET concentration in air agrees with earlier findings showing that the rate of ET metabolism follows first-order kinetics up to an ET exposure concentration of at least 50 ppm (Csanády et al., 2000; Filser et al., 1992; Shen et al., 1989).
Exposures of 4 Volunteers to ET for 4 h: Average Concentrations of ET in Inhaled and Exhaled Pulmonary Air and Average Concentrations of EO in Exhaled Pulmonary Air and in Venous Blood Within the Time Frame of Between 2 and 4h After Starting the Exposures
| Volunteer | ET in Inhaled Air, Mean ± SDa (n) (ppm) | ET in Exhaled Air, Mean ± SDa (n) (ppm) | EO in Exhaled Air, Mean ± SD (n) (ppb) | EO in Venous Blood, Mean ± SD (n) (nmol/l) | |
|---|---|---|---|---|---|
| Calculatedb,c | Measuredc | ||||
| A | 5.41±0.342 (41) | 5.16±0.255 (8) | 2.76±0.404 (3) | 10.0±1.47 (3) | 6.82±0.818 (3) |
| 19.0±1.78 (33) | 18.0±1.33 (8) | 6.76±1.58 (3) | 24.6±5.75 (3) | 23.6±0.288 (3) | |
| 51.3±5.38 (33) | 48.4±2.31 (8) | 16.1±2.75 (3) | 58.6±10.1 (3) | 57.9±3.44 (3) | |
| B | 5.05±0.321 (41) | 4.68±0.096 (8) | 2.32±0.316 (3) | 8.45±1.15 (3) | 6.87±0.536 (3) |
| 19.6±1.48 (31) | 18.2±1.27 (8) | 7.70±1.11 (3) | 28.1±4.04 (3) | 35.9±7.29 (3) | |
| 50.7±4.48 (28) | 48.0±3.01 (8) | 26.6±2.24 (3) | 96.8±8.16 (3) | 81.1±2.86 (3) | |
| C | 4.71±0.251 (18) | 4.36±0.220 (8) | 1.37±0.176 (3) | 4.99±0.641 (3) | 6.53±0.599 (3) |
| 19.2±1.50 (28) | 18.0±0.940 (7) | 7.42±0.471 (3) | 27.1±1.71 (3) | 32.7±0.919 (3) | |
| 49.6±3.08 (31) | 47.7±2.05 (8) | 16.0±2.59 (3) | 58.3±9.43 (3) | 70.9±12.2 (3) | |
| D | 5.24±0.311 (29) | 4.85±0.256 (8) | 1.71±0.020 (3) | 6.23±0.073 (3) | 6.90±0.743 (3) |
| 20.5±2.31 (25) | 18.6±1.07 (8) | 9.00±1.18 (3) | 32.7±4.30 (3) | 42.0±9.60 (3) | |
Note. n, Number of data points.
aCorresponding ET concentrations in inhaled and exhaled air do not differ statistically significantly (p ≤ .05; ANOVA, Bonferroni’s post test).
bThe product of EO in exhaled pulmonary air (ppb) × 3/2 (for obtaining the alveolar concentration) × 61 (the blood/air coefficient of EO; Csanády et al., 2000)/25.13 l/mol (the molar volume of an ideal gas at 25°C and 740 torr; for explanation of the procedure see Filser et al., 2008).
cCorresponding calculated and measured EO blood concentrations do not differ statistically significantly (p ≤ .05; ANOVA, Bonferroni’s post test).
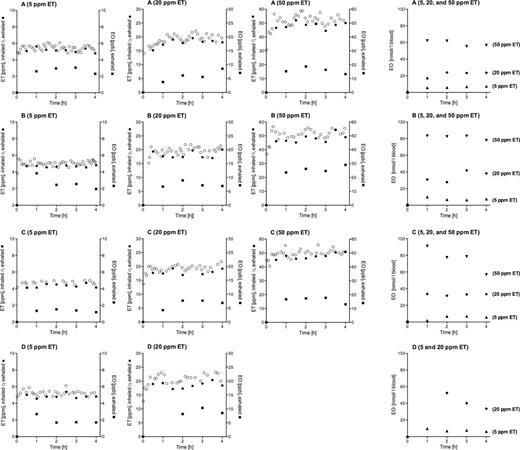
Concentration-time courses of ET in inhaled (○) and exhaled (●) air and of EO in exhaled air (■) as well as in blood (▲ at 5, ♦ at 20, and ▼at 50 ppm ET) during exposures of volunteers A, B, and C to target concentrations of 5, 20, and 50 ppm ET and of volunteer D to target concentrations of 5 and 20 ppm ET. Abbreviations: EO, ethylene oxide; ET, ethylene.
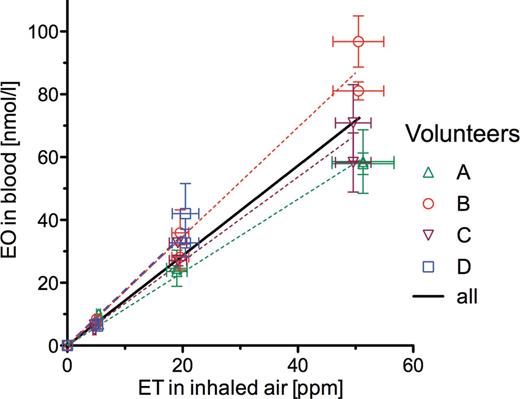
Concentrations of EO in blood of the 4 volunteers at pseudo steady state during single exposures to constant atmospheric concentrations of ET ranging from 5 to 50 ppm. Symbols, individual values from volunteers A, B, C, and D; bars, SDs of ET and EO concentrations; dashed lines, linear regressions through the origin constructed for each individual; solid line, linear regression through the origin using all measured data. Slopes ± SEM (nmol EO/l blood per ppm ET) were: 1.164±0.00249 (A), 1.736±0.00182 (B), 1.341±0.00169 (C), 1.754±0.00988 (D), and 1.431±0.00161 (all together). Abbreviations: EO, ethylene oxide; ET, ethylene.
DISCUSSION
Rodents
EO in blood during exposure to ET.
Measurements of EO in blood of ET-exposed mice have not been published so far. The EO concentrations in blood of ET-exposed rats, however, can be compared with data published by Maples and Dahl (1993) and Fennell et al. (2004) in ET-exposed male Fischer 344 rats. The former authors exposed the animals for 1h to 5 or 600 ppm ET, the latter ones for 6h to 300, 600, or 1000 ppm. Both groups detected metabolically formed EO in blood. At the exposure to 5 ppm ET, Maples and Dahl (1993) showed a linear increase of the EO concentration to a plateau value of between 0.05 and 0.1 µg/g blood which is equal to approximately 1–2 µmol/l (µg/g × 1000/44 = µmol/l). At 600 ppm ET, the EO concentration in blood increased rapidly to a mean maximum value of 3 µg/g (68 µmol/l), which was reached after 7min. Four minutes later, the concentration had dropped to a rather constant value of about 0.5 µg/g (11 µmol/l). Fennell et al. (2004) obtained distinctly different results: at 300 ppm ET, a broad maximum of about 0.08 µg EO/ml blood (1.8 µmol/l) was reached after 2h. Thereafter, the EO concentration decreased continuously to 0.06 µg/ml (1.4 µmol/l). At 600 ppm, EO increased to a peak (0.13 µg/ml = 3.0 µmol/l) at 60min, then decreased rapidly to 0.08 µg/ml at 120min, and thereafter continuously to 0.06 µg/ml at 360min. At 1000 ppm, no peak was detected. Instead, EO increased continuously to 0.104 µg/ml (2.4 µmol/l) at 60min. Thereafter, it decreased slowly to 0.1 µg/ml (2.3 µmol/l) at 360min. The Fennell et al. (2004) data are similar to the present ones with the exception that the peak and the following decrease of the EO concentration was not seen at 1000 ppm. In the present work, EO peaked in blood even at 10 000 ppm ET (Fig. 2). This finding agrees with an earlier observation of an EO peak in the atmosphere of a closed chamber that contained male Sprague Dawley rats exposed to ET concentrations > 1000 ppm (Filser and Bolt, 1984). The final atmospheric plateau concentration of 0.3 ppm EO corresponds to an EO blood concentration of 0.3×61/25.13 = 0.73 µmol/l, which is close to the value of 1.1 µmol/l obtained here at 1000 ppm ET. The cause for the large difference between the data published by Maples and Dahl (1993) and those obtained by the other authors is unclear. Fennell et al. (2004) tried to explain it by assuming analytical problems in the work of Maples and Dahl.
The time courses of EO in ET-exposed mice and rats can be understood on the basis of the findings of Fennell et al. (2004), Maples and Dahl (1993), and Li et al. (2011a). At high ET concentrations, the initial ET metabolism to EO is rather fast. Li et al. (2011a) calculated on the basis of measurements in liver microsomes maximum rates (Vmax) of the ET metabolism (µmol/h/kg body weight) of 42.9 in mice and 28.9 in rats. The same authors explained why earlier published, much smaller Vmax values are incorrect. As a consequence of the fast ET metabolism, the concentration of its metabolite EO increases rapidly until a peak that results from the continuous decrease of the EO formation. This is because of the ET-induced suicide inactivation of the ET-metabolizing cytochrome P-450 (CYP) species (Maples and Dahl, 1993), which was later shown to be predominantly CYP2E1 (Fennell et al., 2004; Li et al., 2011a). The final time courses of the EO concentrations depend on both the rates of CYP2E1 inactivation and its resynthesis until a constant EO concentration is reached at which both rates are equal. At low ET concentrations, the natural turnover rate of CYP2E1 is high as compared with its inactivation rate. As a consequence, the EO concentrations increase continuously until a plateau is reached.
At a first glance, it is surprising that the EO concentrations were smaller in ET-exposed mice than that in rats. With other small olefins, just the opposite was found. In vivo burdens by metabolically formed epoxides or their hemoglobin adduct levels were higher in mice than that in rats (eg, butadiene: Csanády et al., 2011, Filser et al., 2007, van Sittert et al., 2000b; isoprene: Tareke et al., 1998; styrene: Filser et al., 2002, Osterman-Golkar et al., 1995; 4-vinylcyclohexene: Smith et al., 1990). These observations may at least partly result from the findings that the activity of hepatic microsomal epoxide hydrolase is lower in the mouse than in all other mammalian species investigated (Glatt and Oesch, 1987). The enzyme plays a crucial role in the metabolism of xenobiotic-derived epoxides (reviewed in Decker et al., 2009). It may associate with the epoxidizing cytochromes (Etter et al., 1991; Ishii et al., 2005; Li et al., 2011b; Taura et al., 2000) leading to an immediate, CYP-activated endoplasmic hydrolysis. Only the nonhydrolyzed part of the metabolically formed epoxide is available for further metabolic elimination via glutathione conjugation mediated by glutathione-S-transferase(s) in the cytosol. In the case of EO, epoxide hydrolase activity was very small, if at all existent, in subcellular fractions of lung and liver cells of mice and rats. However, hepatic cytosolic activity of glutathione-S-transferase(s) to EO was 5 times higher in the male mouse than in the rat (Brown et al., 1996; Li et al., 2011a). This difference is reflected by the comparatively lower EO concentrations in ET-exposed mice as compared with rats.
EO adducts to hemoglobin and DNA resulting from exposure to ET.
In order to test whether the EO burdens obtained in single ET-exposed rodents are also reliable for repeated exposures, predicted levels of adducts to hemoglobin and DNA in ET-exposed mice and rats resulting from metabolically formed EO are compared with published ones. Adducts were calculated on the basis of the EO concentrations in blood that were obtained by dividing the AUCs of EO given in Figure 3 by the time of exposure to ET (6h). Table 4 shows calculated and measured HEV and HEG levels in ET-exposed mice and rats. Calculated values vary from corresponding ones presented in Csanády et al. (2000) because they rely on measured EO blood concentrations, whereas in the earlier work EO concentrations resulting from ET exposure had been estimated by means of a toxicokinetic model. Calculated and measured data agree rather well in hemoglobin and DNA of rats and excellently in DNA of mice, thus demonstrating that repeated ET exposures did not lead to relevant changes in the EO blood burden compared with single exposures. However, the HEV levels calculated for mice are several times lower than the reported ones. Csanády et al. (2000) made a similar observation when modeling hemoglobin adducts of EO in mice that had been exposed repeatedly to atmospheric EO concentrations of between 3 and 100 ppm EO. Only after increasing the rate constant of HEV formation by a factor of 2.6, an adequate description of the HEV levels was obtained. The authors discussed the difficulties in determining the rate constant of HEV formation that result in an incorrect value. However, in the present case, a 2.6-fold increase in this rate constant from 0.32×10⁻⁴ to 0.83×10⁻⁴ l/(h x g hemoglobin) would not be very helpful, because different factors of 2.3, 3, and 4.7 would be required for a suitable prediction of the HEV levels reported at 40, 1000, and 3000 ppm ET, respectively. For that reason, we abstain from a revision of the reported HEV formation rate constant. The measured HEV levels in the mouse increase by about 60% from 1000 ppm ET to 3000 ppm ET (Table 4), whereas the predicted HEV levels and also the AUCs increase only by about 3%. The difference cannot result from a drastic change in the EO burden as a consequence of the repeated exposures in the study of Walker et al. (2000) because no such effect is seen in the HEG levels. There might be some measurement errors in both the HEV formation rate constant and the HEV levels.
Adduct Levels of HEV in Hemoglobin and HEG in DNA of Mice or Rats at the End of the Last Exposure to ET and Thereafter (HEG Levels Only)
| Hb Adducts (nmol HEV/g Hb) | DNA Adducts (nmol HEG/g DNA)a | |||
|---|---|---|---|---|
| Exposure to ET | Calculatedb | Measured | Calculatedb | Measured |
| Mice | ||||
| 40 ppm, 6h/day, 5 days/week, 4 weeks | 0.61 | 1.4c | 0.46 | 0.56c |
| 1000 ppm, 6h/day, 5 days/week, 4 weeks | 1.4 | 4.2c | 1.1 | 1.1c |
| 3000 ppm, 6h/day, 5 days/week, 4 weeks | 1.4 | 6.6c | 1.1 | 1.3c |
| 3000 ppm, 6h/day, 5 days | — | — | 0.92 | 1.2d |
| Rats | ||||
| 40 ppm, 6h/day, 1 day | 0.14 | 0.83e | — | — |
| 40 ppm, 6h/day, 3 days | 0.40 | 0.41e | — | — |
| 40 ppm, 6h/day, 5 days/week, 4 weeks | 2.2 | 1.7c, 1.6e | 0.99 | 0.63c |
| 1000 ppm, 6h/day, 5 days/week, 4 weeks | 6.3 | 7.1c | 2.9 | 2.3c |
| 3000 ppm, 6h/day, 1 day | 0.43 | 0.70e | — | — |
| 3000 ppm, 6h/day, 3 days | 1.3 | 1.6e | — | — |
| 3000 ppm, 6h/day, 5 days/week, 4 weeks | 6.8 | 7.3c, 7.9e | 3.1 | 2.9c |
| 3000 ppm, 6h/day, 5 days | — | — | 2.6 | 2.2d |
| 300 ppm, 12h/day, 3 days | 2.1 | 2.7f | 3.2 | 2.1f, 2.3g |
| 300 ppm, 12h/day, 3 days, 18h after end of exposure | — | — | 2.6 | 1.7g |
| 300 ppm, 12h/day, 3 days, 115h after end of exposure | — | — | 1.7 | 1.1g |
| 300 ppm, 12h/day, 3 days, 20 days after end of exposure | — | — | 0.02 | 0.0g |
Note.aAdduct levels given in pmol/µmol of guanine and in adducts/107 nucleotides were redimensioned by multiplication with 0.66 and 0.32, respectively.
bCalculations are based on the AUCs of EO in blood of ET-exposed mice or rats given in Figure 3 and on the rate constants given in the Materials and Methods section. Backgrounds were not taken into consideration. HEG levels were calculated for lymphocyte DNA.
cWalker et al. (2000; DNA adducts are means of the levels measured in liver, spleen, brain, and lung).
dWu et al. (1999; Means of DNA adducts measured in liver, spleen, brain, and lung).
fEide et al. (1995; DNA adducts are means of the levels measured in lymphocytes and liver).
gZhao et al. (1997; 20 days after exposure, the difference between adduct level after exposure and background was zero).
Background levels of HEV and HEG.
For the sum of endogenous and environmental ET of 15 ppb, Csanády et al. (2000) predicted by means of a physiological toxicokinetic model background HEV levels (nmol/g hemoglobin) and HEG levels (nmol/g DNA) of 0.005 and 0.003 in mice and of 0.01 and 0.004 in rats, respectively. Measured background HEV and HEG levels are higher. HEV levels correspond roughly to those calculated here for an average environmental ET concentration of 100 ppb (Table 5). The table shows that published background HEV levels in mice and rats remained rather constant during the publication history, starting in 1993. In the earlier reports, the disproportions between the levels of HEV and HEG were drastic, which suggests either a methodological problem or an unknown source (not EO) of the HEG background level. Only the HEG background levels detected in more recent publications are less in imbalance with most of the reported HEV background levels as can be concluded from a comparison with the levels calculated for an environmental ET concentration of 100 ppb. Furthermore, it is obvious that the measured background levels are too high to result solely from endogenous ET.
Background Adduct Levels of HEV in Hemoglobin (Hb) and HEG in DNA of Mice and Rats
| Hb Adducts | DNA Adducts | |
|---|---|---|
| References | (nmol HEV/g Hb) | (nmol HEG/g DNA)a |
| Mice | ||
| Walker et al. (1993) | 0.058 | 2–5b |
| Kautiainen et al. (1991) | 0.0083c; 0.0087c | — |
| Kautiainen et al. (1993) | 0.022 | — |
| Wu et al. (1999) | — | 0.18d |
| Walker et al. (2000) | 0.1 | 0.18d |
| Present work (0.1 ppm continuously) | 0.010e | 0.006e |
| Rats | ||
| Föst et al. (1989) | — | 5.6f |
| Walker et al. (1993) | 0.042 | 2–5b |
| Eide et al. (1995) | 0.025 | 0.74g |
| Zhao et al. (1997) | — | 0.28h |
| Wu et al. (1999) | — | 0.15d |
| Walker et al. (2000) | 0.05 | 0.15d |
| van Sittert et al. (2000a) | 0.045 | 0.083i |
| Rusyn et al. (2005) | 0.44 | — |
| Marsden et al. (2007) | — | 0.036j |
| Marsden et al. (2009) | — | 0.076k |
| Present work (0.1 ppm continuously) | 0.048e | 0.012e |
Note.aAdduct levels given in pmol/µmol of guanine, in adducts per 107, per 108 or per 1010 nucleotides were redimensioned by multiplication with 0.66, 0.32, 0.032, and 0.00032, respectively.
bGiven for liver, lung, brain, testes, spleen.
cTwo values obtained using different diets (not significantly different).
dMeans of DNA adducts measured in liver, spleen, brain, and lung.
eCalculations are based on the AUCs of EO in blood of ET-exposed mice or rats given in Figure 3 and on the rate constants given in the Materials and Methods section.
fLymphocytes.
gMean of DNA adducts measured in liver and lymphocytes.
hMean of DNA adducts measured in liver and lymphocytes.
iDNA adducts were measured in liver.
jMean of DNA adducts measured in liver, heart, and colon.
kMean of DNA adducts measured in liver and spleen.
Humans
The slopes of the curves showing EO in blood (nmol/l) versus ET in air (ppm) differed by a factor of 1.51 between volunteers A and D. In humans, EO is metabolized by both epoxide hydrolase and the glutathione-S-transferase species T1 (Li et al., 2011a). The latter enzyme exhibits polymorphism. Fennell et al. (2000) showed in a study on 32 cigarette smokers that HEV levels resulting from ET and/or EO in the smoke were on average 1.61 times higher in glutathione-S-transferase T1 noncarriers (GSTT1*0) than in those individuals carrying the fully active enzyme. In other words, the statistically significant difference in the slopes between volunteers A and C and volunteers B and D may result from the polymorphism of the glutathione-S-transferase T1.
No measured EO concentrations in ET-exposed humans have been published that could be used for a comparison with the present data. There are only estimations that are based on some ET inhalation and exhalation data (Filser et al., 1992; Shen et al., 1989), on measured EO concentrations in alveolar air and blood of EO-exposed workers (Brugnone et al., 1985; 1986), and on measured HEV levels (Filser et al., 1992; Kautiainen and Törnqvist, 1991; Törnqvist et al., 1989). Using a 2-compartment pharmacokinetic model, Filser et al. (1992) predicted an EO concentration of 0.1 nmol/l (not including the endogenous EO burden) for an exposure to 15 ppb of atmospheric ET. This value is 4.7 times higher than that calculated for the same exposure concentration when using the average slope of EO in blood (1.431 nmol EO/l blood/ppm ET) obtained from all EO data of the 4 volunteers (solid regression line in Figure 5). By means of a physiological toxicokinetic model, Csanády et al. (2000) predicted an AUC of EO in blood of about 1200 nmol × h/l for an 8-h exposure of humans to 45 ppm ET. The newer model was superior to the older one because the predicted AUC was only 2.3 times larger than the actual AUC of 515 nmol × h/l (45×1.431×8), which is obtained using the average slope of EO in blood. For endogenous ET, Filser et al. (1992) and Csanády et al. (2000) predicted EO concentrations in blood of 0.17 and 0.04 nmol/l, respectively. Such low concentrations could not be determined in the present work (limit of detection: 3–5 nmol/l). Törnqvist et al. (1989) and Kautiainen and Törnqvist (1991) estimated ET exposure concentrations from rough data of ET in inhaled air and measured HEV levels. By means of the average slope of EO in blood, steady-state levels of HEV were calculated for various conditions of exposure to ET (Table 6). They are compared with the few measured HEV levels for which ET exposure concentrations had been estimated, with HEV levels predicted for given ET concentrations by means of a physiological toxicokinetic model, and with the only HEV level that was measured together with the ET exposure concentration in 4 workers (Granath et al., 1996). The estimated ET concentrations were too low because they result in lower calculated adduct levels. For a given ET exposure scenario, all estimates gave HEV levels or EO blood concentrations that are too high. The model predictions (Csanády et al., 2000) are rather close to the calculated HEV levels. The only reported level that agrees with the calculation is the one that was obtained from measurement of both ET and HEV levels. Therefore, these data represent the strongest support of the present calculations that are based on measured EO concentrations in blood. Table 6 also shows that published HEV background levels agree with HEV levels calculated for an assumed environmental atmospheric ET concentration of 0.1 ppm. In contrast, measured background HEG levels are far too high. They cannot result from EO because they are in disproportion with the HEV background. It seems there might be a similar problem as discussed above for background levels in animals.
Steady State Increments of Adduct Levels of HEV in Hemoglobin (Hb) and HEG in DNA of Humans Exposed to ET
| Hb Adducts (nmol HEV/g Hb) | DNA Adducts (nmol HEG/g DNA)a | |||
|---|---|---|---|---|
| Exposure to ET | Calculatedb | Reported | Calculatedb | Reported |
| 0.3 ppm, 8h/day, 5 days/week, weekly | 0.009 | 0.023c; 0.015d | — | — |
| 1 ppm, 8h/day, 5 days/week, weekly | 0.03 | 0.1e; 0.05d | — | — |
| 3.6 ppm, 8h/day, 5 days/week, weekly | 0.1 | 0.085f | — | — |
| 0.015 ppm, continuously | 0.002 | 0.006g; 0.003d | — | — |
| 0.1 ppm, continuously | 0.01 | — | 0.002 | — |
| No known exposure, background | — | 0.006–0.06h; 0.017i | — | 0.07–2.1j |
Note. aAdduct levels given in pmol/µmol of guanine, in adducts/107 nucleotides, or in adducts/108 nucleotides were redimensioned by multiplication with 0.66, 0.32, and 0.032, respectively.
bCalculations were done using the rate constants given in the Materials and Methods section and the slope of the solid regression line given in Figure 5. Backgrounds were not taken into consideration. HEG levels were calculated for lymphocyte DNA.
cTörnqvist et al. (1989; uncertainty range of the ET exposure 0.1–1 ppm, assumption that 3% of inhaled ET would be converted to EO).
dCsanády et al. (2000; predicted using a physiologically based toxicokinetic model).
eKautiainen and Törnqvist (1991; calculation based on Törnqvist et al., 1989, but assumption that 5% of inhaled ET would be converted to EO).
fGranath et al. (1996; measured HEV levels and measured average ET exposure concentrations in 4 nonsmoking workers; background values subtracted).
gFilser et al. (1992; modeled, based on measured adduct levels).
hMeasured in nonsmokers, reviewed in Csanády et al., 2000.
iSchettgen et al. (2002; measured in 24 nonsmokers; median).
jLowest measured background levels in white blood cells (2.1, Bolt et al., 1997; 0.07, Zhao et al., 1998; 0.6, Wu et al., 1999; 0.1, Zhao et al., 1999; 0.2, Zhao and Hemminki, 2002; 0.5 [from hospital workers exposed to EO], Kao and Giese, 2005).
The pulmonary retention of ET at steady state is a measure for the ET metabolism. In the present work, a value of about 6% was obtained. It lies within the range of earlier estimates on the metabolic conversion of inhaled ET to that portion of EO that is bioavailable (between 1% and 10%; Csanády et al., 2000; Filser et al., 1992; Kautiainen and Törnqvist, 1991; Törnqvist et al., 1989). From the here-detected EO blood concentrations, it is not possible to define the correct value of the pulmonary retention. ET is metabolized by CYP2E1 and EO by epoxide hydrolase in human liver microsomes (Li et al., 2011a). Although the activity of the latter enzyme was rather low (1.13 µl/min/mg protein), bioavailable EO may represent only a part of metabolized ET because of the above-discussed immediate CYP-mediated endoplasmic hydrolysis by epoxide hydrolase.
Interspecies Comparison of the ET-Induced EO Burden and Implications for the Evaluation of the Human Health Risk From ET
At equal ET exposure concentrations of up to 30 ppm, EO concentrations in blood are 8.7-fold higher in rats and 3.9-fold higher in mice than in the human (volunteer D) with the highest EO burden (calculation: rodent-specific slopes [see legend to Fig. 3] divided by the exposure time [6 h] multiplied by 103 divided by the slope of volunteer D given in the legend to Fig. 5; example mouse: 0.0408/6×103/1.754 = 3.877). Up to 50 ppm, the factors diminish to 6.1 (rats) and 3.0 (mice). The species-specific concentrations of EO in blood are rather well reflected by the HEG levels but to a lesser extent by the HEV levels, mainly because of the species-specific hemoglobin lifetimes that are longer in humans than that in rodents. As a result, calculated adduct levels for continuous exposures to 0.1 ppm are equal in mice and humans (see Tables 5 and 6). The animal-to-human differences in the ET-induced EO burdens and HEV levels are relatively small compared with the burdens by epoxides or their hemoglobin adduct levels of other small olefins such as propylene (Filser et al., 2008), butadiene (Osterman-Golkar and Bond, 1996; van Sittert et al., 2000b), or styrene (Filser et al., 2002; Osterman-Golkar et al., 1995). For an average volunteer (this study), the ET-induced EO concentrations in blood are calculated to be 36-fold higher than those of propylene oxide at equal conditions of exposure to both olefins (computed from the present data and those given in Filser et al., 2008). A factor of about 20 had been estimated earlier using data on the exposure to propylene and propylene oxide that had been considered by the authors as “somewhat uncertain” (Kautiainen and Törnqvist, 1991). The relatively high burdens of the ET-induced epoxide in comparison with those from other olefins may result from the relatively low affinity of the epoxide hydrolase to EO.
The use of chemical-specific adjustment factors (CSAFs) is recommended when evaluating the human risk of cancer from animal carcinogenicity studies (WHO, 2005). The CSAFs for the toxicokinetic uncertainties between species and between human individuals are usually 100.6 and 100.5, respectively. In the present work, the burden of EO, the ultimate toxic species of ET, has been elaborated at various ET exposure concentrations in rodents and humans. Using this knowledge, a considerable reduction of the toxicokinetic CSAF values will be justified when assessing the human risk from animal studies.
FUNDING
Olefins Panel of the American Chemistry Council (animal studies); Cefic Lower Olefins Sector Group, Cefic Propylene Oxide and Glycols Sector Group, and Cefic Ethylene Oxide and Derivatives Sector Group (human studies).
REFERENCES

Comments