


Abstract
Recent evidence has challenged the default assumption that all DNA-reactive alkylating agents exhibit a linear dose-response. Emerging evidence suggests that the model alkylating agents methyl- and ethylmethanesulfonate and methylnitrosourea (MNU) and ethylnitrosourea observe a nonlinear dose-response with a no observed genotoxic effect level (NOGEL). Follow-up mechanistic studies are essential to understand the mechanism of cellular tolerance and biological relevance of such NOGELs. MNU is one of the most mutagenic simple alkylators. Therefore, understanding the mechanism of mutation induction, following low-dose MNU treatment, sets precedence for weaker mutagenic alkylating agents. Here, we tested MNU at 10-fold lower concentrations than a previous study and report a NOGEL of 0.0075 µg/ml (72.8nM) in human lymphoblastoid cells, quantified through the hypoxanthine (guanine) phosphoribosyltransferase assay (OECD 476). Mechanistic studies reveal that the NOGEL is dependent upon repair of O6-methylguanine (O6MeG) by the suicide enzyme O6MeG-DNA methyltransferase (MGMT). Inactivation of MGMT sensitizes cells to MNU-induced mutagenesis and shifts the NOGEL to the left on the dose axis.
To reduce the potential risk of human cancer and heritable genetic defects, consumer products and environmental pollutants are tested for their genotoxic potential. The default assumption is that all doses of direct-acting genotoxins cause appreciable genotoxicity and “no safe level” exists. However, recent in vitro and in vivo experimental evidence, using model alkylating agents, contradicts this assumption of linearity in the low-dose region (Doak et al, 2007). Low levels of two commonly used alkyl alkanesulfonates (methyl- and ethylmethanesulfonate; MMS and EMS) show clear no observed genotoxic effect levels (NOGELs) for gene mutation and chromosome damage in vitro and in vivo (Doak et al., 2007; Gocke and Müller, 2009; Gollapudi et al., 2013). Furthermore, recent nonlinear dose-responses with NOGELs have been observed for two potent mutagens, methylnitrosourea (MNU) and ethylnitrosourea (Bryce et al., 2010; Dobo et al., 2011; Lynch et al., 2011; Pottenger et al., 2009).
There is considerable impetus to define the underlying mechanism of cellular tolerance responsible for each NOGEL. A number of cytoprotective mechanisms have been postulated (Doak et al., 2007; Speit et al., 2000). It has been shown that adducts accumulate at nonmutagenic doses of MMS (Swenberg et al., 2008), thereby implicating the role of postadduct DNA repair mechanisms in protection against mutations at low doses. Subsequently, Zaïr et al. (2011) showed a role for N-methylpurine-DNA glycosylase (MPG, alias AAG) in the repair of EMS-induced adducts at the clastogenic NOGEL and below. However, MPG was not linked to the mutagenic NOGEL in the same study. It seems likely that the mechanism of cytoprotection is mechanism of action specific. Such mechanistic studies are essential for determining the mutagenic and carcinogenic potency of alkylating agents. This is of particular importance for MNU as it sets precedence for weaker mutagens.
The reaction of alkylating agents with DNA is well defined (Beranek, 1990). Consequences of alkylating agent exposure are exerted through premutagenic adducts. The mutagenic potential of simple alkylating agents depends upon the adducts’ half-life, efficiency of repair, and propensity to miscode during DNA replication (Jenkins et al., 2005). The structure of O6-methylguanine (O6MeG) resembles adenine and has significant miscoding potential during replication (Beranek et al., 1983). It is recognized that O6MeG is the most mutagenic methyl adduct (Beranek, 1990). MNU is highly electrophilic (low s value of 0.42) and methylates sites of low nucleophilicity, e.g., O6-guanine. MNU produces O6MeG to a greater extent than agents (e.g., MMS) with s values approaching 1, which is likely to account for the difference in mutagenic potential between these agents (Doak et al., 2007).
The biological relevance of O6MeG in carcinogenicity, cytotoxicity, and mutagenicity was first noted by Loveless (1969), who observed the predominance of GC → AT transitions following exposure of bacteriophages to MNU. Furthermore, O6MeG has been implicated in the MNU-induced transformation of ras proto-oncogenes (Jacoby et al., 1992; Mariyama et al., 1989; Newcomb et al., 1995; Sukumar, 1989) and in cancer initiation (Becker et al., 1996; Bos, 1989). O6MeG is efficiently repaired by O6MeG-DNA methyltransferase (MGMT) in a suicide reaction that inactivates MGMT (Kaina et al., 2007). The methyl adduct is irreversibly transferred to a cysteine residue in the active site of the protein. The reaction is stoichiometric, where the number of adducts that can be repaired is equal to the number of active intracellular MGMT molecules. Consequently, the cell has limited capacity to repair O6MeG, and MGMT can be depleted (reviewed by Pegg and Byers (1992)). Depletion of MGMT leaves the cell sensitive to alkylation damage (Hirose et al., 2003), and the rate of MGMT regeneration maybe cell-type specific, depending upon basal expression kinetics. Regeneration occurred faster in mitogen stimulated T cells (Gerson, 1988), suggesting that cell division is important (Sklar et al., 1981). It is well established that in rats, MGMT has an expression induction system in response to alkylation- and x-ray–induced damage (Fritz et al., 1991; Grombacher et al., 1996) possibly involving the transcription factors p53, AP-1, and SP1 (Grombacher et al., 1998; Harris et al., 1996; Rafferty et al., 1996). Very little evidence shows the same induction system in humans (Doak et al., 2008) despite upregulation by corticosteroids, phorbol-12-myristate-13-acetate (TPA), and other protein kinase C activators in HeLa S3 cells (Boldogh et al., 1998; Grombacher et al., 1996). Suffice to say, uncertainty exists about the transcriptional regulation and protein turnover of MGMT within human cells.
The aim of this study was to identify the biological mechanism of mutagenesis by low-dose MNU exposure at the hypoxanthine (guanine) phosphoribosyltransferase (H(G)PRT) locus in a human cell line. This is in order to substantiate the existence of NOGELs for point mutation induction by direct-acting alkylating agents.
MATERIALS AND METHODS
Reagents.
MNU, HAT supplement (2×10⁻⁴M hypoxanthine, 8×10⁻⁷M aminopterin, and 3.5×10⁻⁵M thymidine), HT supplement (2×10⁻⁴M hypoxanthine and 3.5×10⁻⁵M thymidine), 6-thioguanine, and O6-benzylguanine were purchased from Sigma-Aldrich (Gillingham, UK). All powdered reagents were reconstituted according to manufacturer’s instructions. To prevent leaching of plastics under solvents, stocks were diluted in glass vials (Sigma). The exact purity of MNU is not known. Manufacturers state up to 87%. The concentrations shown here are nominal, and this purity should be taken into account should this study be compared to one using MNU of 100% purity.
Cell culture.
AHH-1 (TK+/−) cells were purchased from American Type Culture Collection (Middlesex, UK) and cultured under conditions specified by Doak et al. (2007).
Hypoxanthine phosphoribosyltransferase assay.
The hypoxanthine phosphoribosyltransferase (HPRT) assay was performed as detailed in the study by Doak et al. (2007) and following MGMT inactivation. Each replicate was treated with a new stock of MNU. Twenty-four-hour treatment with the dose range of MNU utilized here caused a maximum of 40±5% (mean ± SD) toxicity as adjudged by plating efficiency (PE) (Fig. 1). This is within the acceptable range for testing, as dictated in the OECD guideline 486 (OECD, 1997). A two-tailed t-test compared PE of each dose with PE of solvent control. It was noted that the mutant frequency (MF) of the solvent control (dimethyl sulfoxide [DMSO]) is indistinguishable from that of the untreated control, with MF being 1.4×10⁻⁵ ± 1.8×10⁻⁶ (mean ± SD) and 1.4×10⁻⁵ ± 3.2×10⁻⁶, respectively. A one-way ANOVA revealed that they were not significantly different (p = 0.952) and were combined to increase statistical power.
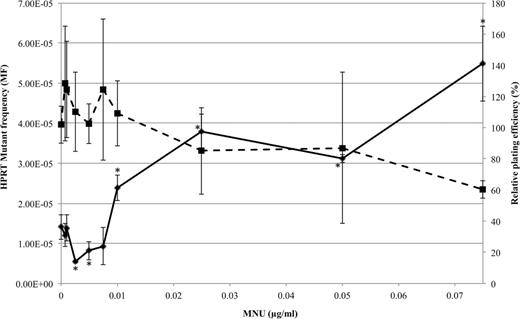
Nonlinear dose-response of MNU in AHH-1 cells quantified through the HPRT assay (solid line). RPE was used to assess toxicity (dotted line). *p < 0.05 using two-sided Dunnett’s test with square root transformed data based on Bartlett’s test for heterogeneity of variance (p > 0.05) and Kolmogorov-Smirnov test for normality (p > 0.05).
Inactivation of MGMT.
AHH-1 cells were treated with 10µM O6BG and incubated at 37ºC, 5% CO2 for 1h before MNU treatment.
Cytotoxicity assessment using relative population doubling.
Toxicity and cytostasis of MNU ± O6BG was determined by relative population doubling (RPD) as detailed by Zaïr et al. (2011).
Endpoint PCR amplification of HPRT cDNA.
Total RNA was extracted using RNeasy kit (Qiagen, Sussex, UK), under manufacturer’s instructions, from enumerated single cell clones (Johnson, 2012). Residual genomic DNA was removed through DNase I digestion (Qiagen). The quality, purity, and quantity of RNA were assessed through spectrophotometry. Two micrograms of RNA was used for cDNA synthesis using oligo (dT) primers of the RETROscript cDNA synthesis kit (Applied Biosystems, Warrington, UK). HPRT cDNA was targeted using overlapping primers to reduce amplicon length and improve efficacy of PCR. Primers were designed using Beacon designer software (Premier Biosoft). These were as follows: forward, 5′-GAACCTCTCGGCTTTCCC-3′ and reverse, 5′-TGCCAGTGTCAATTATATCTTCC-3′, which targeted 52 to 588bp of the HPRT sequence and a second pair to amplify from position 524 to 1238bp. These were forward 5′-GATGATCTCTCAACTTTAACTGG-3′ and reverse 5′-CTTACTTTTCTAACACACGGTGG-3′. Separate reactions were established for each primer pair according to instructions supplied with GoTaq flexi DNA polymerase (Promega, Southampton, UK) supplemented with 0.2µM primer, 1.5U GoTaq polymerase, and 2 µl completed cDNA reaction mixture. Thermocycling was performed on an icycler thermal cycler (Bio-Rad, Hemel Hempstead, UK) over 40 cycles with 52.6ºC annealing temperature. PCR success was clarified through silver stain visualisation on 6% polyacrylamide gel electrophoresis. PCR products were purified using PCR purification kit (Qiagen) under manufacturer’s instructions. Sequencing was performed at Genome Enterprise Limited (Norwich, UK) and analyzed using Mutation Surveyor version 3.0 (Softgenetics, State College, PA). Mutations were confirmed through repeated PCR and sequencing.
Construction of mutation spectra.
Mutation spectra were constructed using iMARS software (Morgan and Lewis, 2006).
Quantitative real-time MGMT gene expression analysis.
Real-time PCR quantitation of MGMT transcripts was performed using TaqMan probes as detailed in the study by Zaïr et al. (2011).
Statistical analysis.
Error bars on figures are SD around the mean. Dose-response modeling was performed according to Gocke and Wall (2009), Johnson et al. (2009), and Gollapudi et al. (2013). Statistical analysis was performed using SPSS version 20. Pairwise comparisons of each mutation spectrum were made using χ2 tests and the Adams-Skopek test (Adams and Skopek, 1987) through HYPERG software (Cariello et al., 1994). Principle component analysis (PCA) of mutation spectra was performed using R version 9.2. Coding available on request. Real-time data analysis as per Doak et al. (2008).
RESULTS
A dose-response for MNU mutagenicity was obtained using the HPRT assay in AHH-1 cells. MNU was tested at 10-fold lower concentrations than previously tested by Doak et al. (2007). Resulting HPRT mutants were sequenced and mutation spectra constructed at critical doses of the dose-response to comment upon mutagenic mechanisms at different MNU concentrations. The hypothesized role of MGMT in DNA tolerance to low doses was tested by use of O6-benzylguanine–induced MGMT inactivation and the HPRT assay repeated.
Mutagenic Dose-Response for MNU in Lymphoblastoid Cells
The frequencies of HPRT mutants and relative plating efficiency (RPE) were plotted against increasing concentrations of MNU (Fig. 1).
The dose-response for HPRT mutants in this study resembled that of a nonmonotonic curve (Fig. 1), where the lowest doses have the opposite effect to higher doses (Davis and Svendsgaard, 1990). Dunnett’s post hoc analysis was performed on the raw data to compare all treatment MFs with control (DMSO and untreated). It was found that the NOGEL was 0.0075 µg/ml (72.8nM, p = 0.99), and the lowest observed genotoxic effect level (LOGEL) was 0.01 µg/ml (97nM, p = 0.001) for point mutation induction. Furthermore, two-sided Dunnett’s analysis revealed that the MF at 0.0025 and 0.005 µg/ml was significantly lower than the control level (p < 0.05), following square root transformation based on Bartlett’s test for heterogeneity of variance (p > 0.05), and Kolmogorov-Smirnov normality test (p > 0.05). Curve estimations upon doses up to the NOGEL (0–0.0075 µg/ml) revealed that the dose-response fitted a quadratic model (p = 0.01) with a negative relationship substantiating the reduction in MF and appearance of a J-shaped dose-response. The gradient of the slope was −0.00075 (to 5d.p) with 95% confidence limits of −0.00133 to −0.00017. Therefore, we can conclude that the response did not fit a hockey stick nor a linear model, and there was a definitive reduction in MF, over several doses, compared with the negative control. Additionally, there were significantly fewer HPRT mutant colonies (data not shown) at 0.0025 µg/ml than at the control (p = 0.01), which ruled out potential influences of increased PE on MF calculation.
Sequence Analysis Revealed Significant Differences in Mutation Induction Over the Nonlinear Dose-Response
Sequence analysis was performed on 40 HPRT mutant colonies for each treatment. These were solvent (DMSO) control (0 µg/ml MNU) and 0.00075 µg/ml and 0.025 µg/ml MNU representing below NOGEL and above LOGEL doses, respectively. The spectrum of mutations at the HPRT locus following treatment with increasing doses is shown in Figure 2. As expected, the vast majority of mutations occurred in the protein-coding region of the mRNA from position 167 to 824bp. The mutation spectrum at 0.00075 µg/ml MNU was different to that of the solvent control. Eighteen of the forty mutants of the solvent control and 4 of the 40 mutants following treatment with 0.025 µg/ml MNU contained a possible duplication of 33 nt at 490–533bp. These were excluded from statistical analysis to focus on point mutations, the major mutagenic mechanism of MNU. This was not found in mutants following treatment with 0.00075 µg/ml MNU. A GC → TA transversion at 747 was also specific to MNU treatment, regardless of concentration. Many of the GC → AT transitions were only present following treatment with 0.025 µg/ml MNU. Each spectrum was significantly different (p = 0.000), adjudged by the Adams-Skopek test. Additionally, a χ2 test was performed on raw data, and each spectrum was significantly different: 0 versus 0.00075 (p = 2.3×10−61), 0 versus 0.025 (p = 4.7×10−65), and 0.00075 versus 0.025 (p = 1.0×10−154). MNU-specific hot spots were defined as mutations occurring at > 5% of the total mutations for each spectrum. At 0.00075 µg/ml, one hot spot (shown in Table 1) occurred at 747; 5′TGA → TCA. This was also found at 0.025 µg/ml with additional hot spots at 551; 5′AGA → AAA, 555; 5′TGT → TAT and 556; 5′GTC → GAC. The vast majority of GC → AT mutations (76%) observed at 0.025 µg/ml MNU occurred at guanines preceded by a purine (5′Pu-G-N), which was to be expected (Zhang and Jenssen, 1991). PCA on mutation spectra further substantiated differences in mutation induction at increasing concentrations of MNU. The data were explained by two components, PCA1 (correlation factor = 0.9) and PCA2 (correlation factor = 0.1). PCA1 distinguished MNU treated from control spectra, and the second component separated the two MNU treatment groups. Most notably, of the mutations unique to 0.025 µg/ml, the vast majority were GC → AT transitions, which accounted for the differences between treatments.


Frequency of all base substitutions found along the nontranscribed strand of HPRT sequence at increasing concentrations of MNU.
Proportions of Substitutions at the HPRT Locus Observed at Increasing Concentrations of MNU
| * | ||||
| * | * | |||
| Percentage of total mutations (%) | ||||
| Substitution type | 0 µg/ml MNU | 0.00075 µg/ml MNU | 0.025 µg/ml MNU | |
| GC → AT | 15.0 | 12.5 | 45.9 | |
| AT → CG | 29.0 | 7.8 | 5.1 | |
| AT → GC | 9.3 | 7.8 | 8.9 | |
| GC → TA | 9.3 | 7.8 | 3.0 | |
| AT → TA | 22.4 | 14.1 | 16.2 | |
| CG → GC | 15.0 | 50.0 | 20.7 | |
| Total number of mutations found | 112 | 64 | 135 | |
Notes. The values in bold represent the most predominant substitution at each concentration. n = 22 for 0 µg/ml, n = 40 for 0.00075 µg/ml, and n = 36 for 0.025 µg/ml (see text for details).
*p ≤ 1×10˗60.
Proportions of GC → AT Transitions Are Elevated at Doses Above the LOGEL
In the solvent control, a total of 112 base substitutions were found in 40 mutants. The most prominent spontaneous substitutions were AT → CG transversions, constituting 29.0% of the spontaneous mutation spectra. Following treatment with 0.00075 µg/ml, CG → GC transversions were most abundant, constituting 32 of 64 (50%) substitutions observed. The spectrum changed upon treatment with 0.025 µg/ml MNU, where GC → AT transitions were the predominant alterations, as expected from MNU exposure, forming 45.9% of the mutation spectrum. Of all the mutations, the increase in GC → AT transitions most closely reflected the increase in MF (Fig. 3). The change in proportion of GC → AT transitions was accompanied by a change in the number of mutants found to harbor a GC → AT transition, from 52.5% (21/40) mutants in the control spectrum to 17.5% (7/40) mutants at 0.00075 µg/ml to 72.5% (29/40) mutants at 0.025 µg/ml. Therefore, results were not biased by a single mutant containing many GC → AT transitions.
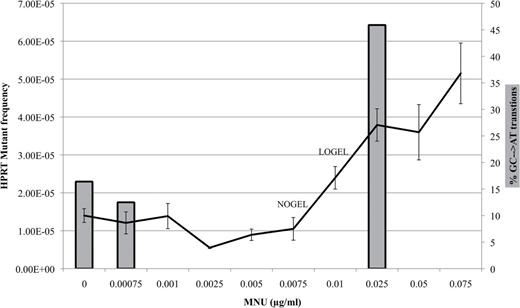
The proportion of GC → AT changes (bars) increases in concordance with the increase in HPRT MF (line) observed in Figure 1.
MGMT Inactivation Changes the Shape of the Dose-Response
O6-benzylguanine (O6BG) was used to specifically inhibit MGMT activity in AHH-1 cells. A dose-response for MNU mutagenesis was obtained in MGMT-inactivated AHH-1 cells (Fig. 4B). There was a drastic change in the shape of the dose-response (Fig. 4). There was a 10-fold reduction in the LOGEL from 0.01 µg/ml MNU (p = 0.015) in MGMT-active cells to 0.001 µg/ml (p = 0.04) in MGMT-inactivated cells. Solvent control MF values between MGMT-active and -inactive cells were not significantly different, and so a valid comparison between the two experiments can be made (lowest p = 0.475 using a one-way ANOVA).


Linear regression outputs comparing linear to quadratic dose-responses for MNU-induced mutant frequencies in MGMT-active (A) and MGMT-inactive AHH-1 cells (B) at the NOGEL (0.0075 µg/ml) and below. The MGMT-active dose-response was quadratic below the NOGEL (p < 0.05) and displayed a negative gradient for the linear regression (p < 0.05) at −0.0007±0.0006 (A). The MGMT-inactive dose-response was linear (p = 0.15) and had a clearly positive gradient (p < 0.05) (B). Linear model (solid line), observed data (open circles), and quadratic model (dashed line).
The quadratic model better fitted the data (p = 0.01) in AHH-1 cells without MGMT inactivation (Fig. 4A). In contrast, following MGMT inactivation, the linear model better explains the data (p = 0.04) (Fig. 4B). Short-term cytotoxicity/cytostasis studies showed that MNU treatment following MGMT inactivation was not toxic at the doses used (data not shown). In addition, 0.0075 µg/ml MNU (NOGEL in MGMT-active AHH-1 cells) caused a 3.5-fold higher MF. This was accompanied by a 68.5% increase in GC → AT transitions and a 66% increase in the number of mutants harboring a GC → AT transition.
Increase in MF in MGMT-Inactive Cells Occurs Only Below the LOGEL
The MF ratio between AHH-1 cells differing in MGMT proficiency was calculated by dividing the MF in presence of O6BG (MGMT inactive) by the MF in absence of O6BG (MGMT active) at each dose (Fig. 5).
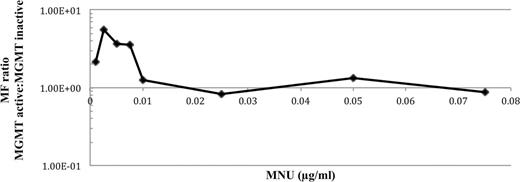
The fold change in MF in MGMT-active and -inactive AHH-1 cells plotted on a log-linear axis.
The MF in MGMT-inactivated cells was, at most, fivefold higher than in MGMT-active cells. However, the difference in MNU potency, as a function of MGMT activity, was only observed at doses below the LOGEL (0.01 µg/ml MNU in MGMT-active AHH-1 cells). There was very little difference in MF at the LOGEL and higher doses of MNU. Additionally, because the MF of solvent controls did not differ significantly to the untreated control, the MF in presence and absence of O6BG was compared at each dose using a two-tailed t-test. Significance was only seen at doses below the LOGEL.
Validation of O6BG-Mediated MGMT Inactivation
Attempts to validate the reduction in MGMT activity in AHH-1 cells following O6BG treatment were made but were unsuccessful. AHH-1 cells have comparatively lower MGMT levels than other cell lines available in our laboratory (Supplementary Data). In AHH-1 cells, MGMT transcripts can be detected at a very low level, and so it seems likely that the protein is beneath the level of detection of activity and protein assays. The limit of detection of the assay is 0.63fmol/mg protein (Bobola et al., 2007; Kaina et al., 1991). It is possible that MGMT exists at a level below 0.63fmol/mg protein in AHH-1 cells, and lack of assay sensitivity prevents detection. However, the cellular presence and effect of O6BG were made clear by the potentiation of high-dose MNU toxicity over 48h. The toxic dose 50 (TD50) of MNU in MGMT-active AHH-1 cells, as measured by RPD, was 2 µg/ml, following O6BG administration; the RPD was reduced twofold.
DISCUSSION
The aim of this study was to establish the biological relevance of low doses of MNU to substantiate the growing acceptance of “low-dose tolerance” to monofunctional alkylating agents.
A NOGEL for MNU mutagenesis was identified at 0.0075 µg/ml (72.8nM) MNU and a LOGEL of 0.01 µg/ml (97nM) in AHH-1 cells. This is in support of recent evidence that pertains tolerance to low-dose MNU in a number of in vitro and in vivo models (Bryce et al., 2010; Lynch et al., 2011; Pottenger et al., 2009). The alkyl nitrosoureas, in which MNU is classified, are more mutagenic than alkyl alkanesulfonates due to the higher proportion of mutagenic adducts induced. Suter et al. (1980) found that MNU was 20-fold more mutagenic than MMS in V79 cells. Therefore, one would expect a MNU LOGEL to exist at a 20-fold lower concentration than a LOGEL for MMS. Pottenger et al. (2009) found the LOGEL of MNU to be only 2.5-fold lower than the LOGEL for MMS in L1578Y mouse lymphoma cells. In our study, the LOGEL for MNU is 117-fold lower than that of MMS (1.25 µg/ml, 11.35µM) identified in the same experimental system (Doak et al., 2007). These drastic differences in mutagenic potency between cell types and alkylating agents can be explained by increased sensitivity to O6MeG in AHH-1 cells compared with V79 and L1578Y rodent cells, potentially reflecting differential DNA repair capacities or could be an artifact of the differences in MNU purity between the studies.
This study is the first to report an apparent reduction in MF at 0.0025 and 0.005 µg/ml MNU compared with the solvent control, which is suggestive of a nonmonotonic dose-response. The reduction cannot be attributed to toxicity, cytostasis, or an artifact of the calculation. Therefore, it is possible that there is a biological mechanism responsible for the reduction in MF. Conolly and Lutz (2004) postulate a number of prerequisites that would allow a theoretical mechanism to account for the reduction in MF. Assuming these are satisfied, we hypothesize that 0.0025 µg/ml and 0.005 µg/ml caused modification of DNA repair capacities or detoxification mechanisms that removed or prevented damage from MNU and from endogenously generated genotoxins (e.g., from mitochondrial processes). Potential upregulation of DNA repair has not been fully investigated in this study. However, due to the well-defined protective role of MGMT against MNU mutagenesis, we quantified MGMT mRNA through quantitative real-time PCR. MGMT expression was unmodified in response to MNU exposure (Supplementary Data). This was unexpected given the increase in MGMT expression 4h following MMS exposure (Doak et al., 2008). However, we cannot rule out the possibility of a posttranslational modification that may lead to upregulation of MGMT molecules in human cells.
This is a novel study to report on the mechanism of MNU mutagenesis at low doses, particularly below the NOGEL. The changes in DNA sequence at the HPRT locus was compared between the negative control and treatment groups. Each of the possible base substitutions was observed. For the majority of substitutions observed, the mutagenic mechanism responsible is unknown, potentially involving well-characterized changes in base chemistry, errors in replication, and possibly other adducts of the MNU spectra. Of interest to the study are the differences between the spectra. In particular, the differences between solvent control and 0.00075 µg/ml MNU (below NOGEL) highlight the cellular presence and effect of MNU at a dose below the NOGEL (0.00075 µg/ml). Crucially, this evidence indicates a postadduct cytoprotective mechanism, i.e., DNA repair to account for the lack of increase in MF. Of interest is the absence of sequence alteration in the region 490–523bp following treatment with 0.00075 µg/ml MNU, which is present in the solvent control and at higher MNU doses. This substantiates the argument of a nonmonotonic dose-response if low dose of MNU upregulates cytoprotection, which would prevent endogenous damage from causing mutations. However, this study cannot confirm this. The question whether MNU is a hazard because of the change in mutagenic profile below the statistical NOGEL still exists (Professor Bhaskar Gollapudi, personal communication).
Although this is the first study to show a mutation spectra dose-response for direct-acting genotoxins, it has previously been reported for phenobarbitol, a nongenotoxic carcinogen (Shane et al., 2000). Changes in the mutation spectrum at a nontumorigenic dose of phenobarbitol were attributed to oxidative stress through the induction of cytochrome P450 following exposure. Below the NOGEL, GC → TA transversions predominate (Table 1) and are noted in previous studies albeit to a lesser extent (Van Zeeland et al., 2008), possibly owing to dilution by more prominent mutations following treatment with higher doses. The adduct responsible is not known at present, suffice to say that if O6MeG adducts are tolerable through repair, then other adducts are dominant at low doses. The statistically significant increase in MF at 0.025 µg/ml was accompanied by a drastic increase in the proportion of GC → AT transitions, which accounted for the differences between the treated spectra following PCA. O6MeG has a well-defined fixation mechanism into GC → AT transitions (Beranek et al., 1983; Loveless, 1969). We have previously shown that this adduct and mutation are produced at high levels following treatment with MNU (Jenkins et al., 2005). Another miscoding lesion, O4-methylthymine (O4MeT), is repaired less efficiently than O6MeG but is formed at much smaller quantities, i.e., 0.1–0.7% of total alkylation events (Beranek, 1990). O4MeT miscodes during replication causing TA → CG transitions (Klein et al., 1994). Palombo et al. (1992) found 20 GC → AT transitions and 1 TA → CG transitions at the human gpt gene following MNU exposure, attributable to O6MeG and O4MeT. O6MeG causes the majority of MNU-induced point mutations (Sledziewska-Gójska and Torzewska, 1997). Therefore, it is reasonable to conclude that the observed dose-response and NOGEL are dependent upon the biological effect of O6MeG.
Inactivation of MGMT by O6BG administration (a well-documented and specific method of MGMT “knockout” (Pegg et al., 1993; Ueno et al., 2006)) sensitizes cells to the adverse effects of O6-guanine methylation (Dolan et al., 1991; Fritz and Kaina, 1992; Kaina et al., 1991; Tsuzuki et al., 1996). Validation of inactivation is difficult in AHH-1 cells because it is likely that MGMT exits at a level, which is below detection. In our study, such sensitization is evidenced by the following:
10-fold decrease in LOGEL in MGMT-inactive cells
Significant change in the dose-response following MGMT inactivation (Fig. 4).
These effects cannot be attributed to O6BG itself because it was not mutagenic nor did it cause increased toxicity or cytostasis following administration, consistent with published literature (Wedge and Newlands, 1996). Additionally, O6BG has no known pleiotropic effects within cells but has a well-defined reaction mechanism with MGMT (Kaina et al., 2010; Pegg et al., 1993; Ueno et al., 2006; Xu-Welliver and Pegg, 2002). Therefore, MNU potentiation can only be attributable to the specific O6BG-mediated inactivation of MGMT, and the resultant increased persistence and subsequent replication of O6MeG following MNU treatment. A caveat is the interreplicate variation made visible in Figure 4B. This may reflect the heterogeneity in efficiency of inhibition by O6BG across a cell population. MGMT inactivation resulted in a change in the dose-response from a NMDR, U-shaped pattern to a linear relationship at the doses tested. This strongly implicates MGMT in the nonlinear mutation induction curve for MNU. At higher MNU concentrations (exceeding 0.01 µg/ml MNU, i.e., LOGEL), O6BG did not potentiate MNU mutagenicity. This has been observed in MGMT-deficient cells, e.g., HeLa MR (Chen et al., 1993). It is possible that supra-LOGEL doses of MNU cause MGMT loss through increased demand for repair of O6MeG. This would explain the lack of effect of O6BG at higher doses (Fig. 5). This provides evidence to suggest that the NOGEL is dependent upon cellular MGMT levels. The increase in MF and GC → AT transitions is attributable to the loss of MGMT at doses > NOGEL.
CONCLUSIONS
With recent evidence of low-dose nonlinear genotoxicity by alkylating agents, there is considerable impetus to determine the mechanism of low-dose mutation induction. We have identified a NOGEL for point mutation induction in AHH-1 cells treated with MNU that is dependent upon postadduct DNA repair. We report the involvement of MGMT in the repair of O6MeG adducts at the NOGEL and below.
FUNDING
Engineering and Physical Sciences Research Council (EF/F014341/1 to A.D.T.).
ACKNOWLEDGMENTS
The authors would like to thank Margaret Clatworthy for her expert help throughout the project. This work was also supported by travel and transfer of knowledge bursaries from the United Kingdom Environmental Mutagen Society.
REFERENCES

Comments