


Abstract
Hand hygiene behavior is crucial to counter the spread of infectious diseases. However, its adoption during the early stages of the Coronavirus disease (COVID-19) pandemic showed temporal fluctuations associated with the trajectory of the pandemic (e.g. new COVID-19 infections). Such associations can confound conclusions about the effectiveness of interventions aimed at promoting hand hygiene during a pandemic. In this study, we performed a secondary analysis of a dataset from the optimization phase of Soapp, an app to promote hand hygiene during the COVID-19 pandemic. We used a longitudinal study design to test whether the associations between the pandemic trajectory and hand hygiene behavior were still present one year after the outbreak (primary outcome) and whether they impacted conclusions about the effectiveness of Soapp (secondary outcome). Participants (N = 216) were randomized to different versions of Soapp and used an electronic diary to self-report their hand hygiene behavior multiple times during the study. We considered the following indicators of the COVID-19 pandemic from the country of Switzerland in the period between March and August 2021: total cases/deaths, increases in recent new cases/deaths, new cases/deaths, and number of administered doses of vaccine. Data were analyzed using a multilevel approach. Results suggested that there were no significant associations between hand hygiene and the indicators of the pandemic trajectory. However, models including total cases/deaths impacted the conclusions about Soapp’s effectiveness. Implications from this study are that the development and evaluation of hand hygiene interventions during a pandemic context should account for the trajectory indicators to maximize their effectiveness and control for confounding effects.
Lay Summary
Hand hygiene is an effective behavior for decreasing the transmission of infectious diseases, including Coronavirus disease (COVID-19). During the early stages of the COVID-19 pandemic, hand hygiene was in part related to how the pandemic evolved over time (pandemic trajectory), e.g., how many people were affected or the number of deaths. We argue that such associations can confound conclusions about the effectiveness of interventions aimed at promoting hand hygiene during a pandemic. To test this hypothesis, we estimated how indicators of the pandemic trajectory influenced the evaluation of a smartphone app developed to promote hand hygiene during COVID-19. Our analysis included 216 participants who used the app for 34 days between March and August 2021 and reported their hand hygiene behavior using an electronic diary. Information on the pandemic trajectory were extracted from the World Health Organization database. Results confirmed that hand hygiene behavior increased with the use of the app when accounting for most pandemic trajectory indicators. However, this effect disappeared when accounting specifically for the total number of cases and deaths since the beginning of the pandemic. These results underline the importance of considering the pandemic trajectory when evaluating the efficacy of behavior change interventions carried out during an ongoing pandemic.
Practice: When developing a behavior change intervention targeting hand hygiene during a pandemic, behavioral experts should adjust the content and dose of the intervention depending on the changes in the pandemic trajectory.
Policy: When evaluating public health campaigns targeting the adoption of protective behaviors during a pandemic, it is key to control for the pandemic trajectory. Conversely, the effect of the campaign can be conflated with the effects of the pandemic trajectory.
Research: Behavior change research conducted during a pandemic context should consider the risk of conflating the effect of a specific behavior change intervention with the effects of the pandemic trajectory. Adjusting for the pandemic trajectory is a valuable approach when evaluating behavior change interventions as it ensures to provide better estimates of the true intervention effect.
Introduction
Hand hygiene behavior plays an important role for decreasing the transmission of Coronavirus disease (COVID-19) [1]. It has therefore been included in governmental and public health guidelines worldwide [2]. In spite of that, adherence to hand hygiene behavior was characterized by temporal variations during the COVID-19 pandemic. For instance, previous research reported an increase in the frequency of hand hygiene during the first few weeks of the pandemic in March 2020 [3] followed by a significant decline between March and May 2020 [4]. Identifying the determinants of such temporal variations is key to inform the development of effective behavior change interventions targeting hygiene during pandemic contexts [5–7]. Amongst other factors, the trajectory of the COVID-19 pandemic has been shown to be related to changes in adherence to hand hygiene behavior [8].
The pandemic trajectory is an umbrella term that encompasses a series of indicators describing the temporal evolution of the pandemic in a specific geographical area. Such indicators are commonly used by governmental and public health institutes to communicate day-to-day changes in the pandemic to the population. Examples of such indicators are the cumulative number of infection cases or the delta change in recent deaths due to COVID-19. A study conducted during the early stages of the pandemic in the period between March and July 2020 [8] showed that the increase in cumulative numbers of COVID-19 cases and deaths was negatively related to adherence to hand hygiene behavior while the 2-week delta change in COVID-19 cases and deaths was positively associated with behavioral adherence. The authors explained the results in light of the Terror Management Health Model [9], which suggests that the salience of mortality moves individuals to behave in a way that minimizes the relevant health-related threats. For instance, a raise in the delta change of the COVID-19 cases would increase the salience of the pandemic threat, resulting in an increased adherence to hand hygiene behavior while the information on cumulative cases/deaths is less prominent and more distal in time. Conversely, according to the risk compensation hypothesis [10], the feeling of safety generated by protective factors such as the uptake of a vaccine would be compensated with the disengagement from protective behaviors. In line with this latter hypothesis, the uptake of an effective vaccine, which became available towards the end of 2020 [11], may have played a role in diminishing the adoption of hand hygiene behavior.
The fact that hand hygiene behavior could be influenced by factors like the pandemic trajectory and the vaccine uptake has relevant implications for the development and evaluation of behavior change interventions. First, intervention strategies should transition from a static to an adaptive approach that accounts for time-varying exogenous variables. Specifically, the type and amount of intervention content can be adjusted according to the temporal dynamics of the pandemic trajectory. For instance, one could potentially identify the pandemic phases during which individuals are more susceptible to disengaging from hand hygiene and would derive greater benefit from additional or alternative forms of support [12]. Second, the effects of behavior change interventions targeting hand hygiene may be difficult to distinguish from some of the effects of the trajectory of the COVID-19 pandemic. For instance, an intervention conducted during a pandemic peak might lead to different results compared to the same intervention conducted when the peak is over. This has implications for interpreting the validity of conclusions drawn from hand hygiene intervention trials conducted during the pandemic.
Despite the significance of the implications, research on this topic is still limited. Further evidence is needed to extend the validity of previous findings from Szczuka et al. [8] to other phases of the COVID-19 pandemic and to different study designs (e.g. interventional). In particular, empirical support regarding whether the overmentioned effects were stable over the course of the pandemic or transient is missing. Indeed, the indicators of the pandemic trajectory continuously fluctuated since its outbreak (see Fig. 1) and previous results unveiled just a snapshot of it. Additionally, a significant limitation of prior research [8] lies in their use of a cross-sectional study design despite the aim to explore the relationship between time-varying variables (specifically, indicators of the pandemic trajectory) and hand hygiene. Even though testing the association was made possible due to the continuous recruitment that occurred over time, the study design does not account for between-person differences and is susceptible to the ecological fallacy [13, 14]. Finally, the potential impact of the pandemic trajectory on the evaluation of the effectiveness of hand hygiene interventions has not been studied.
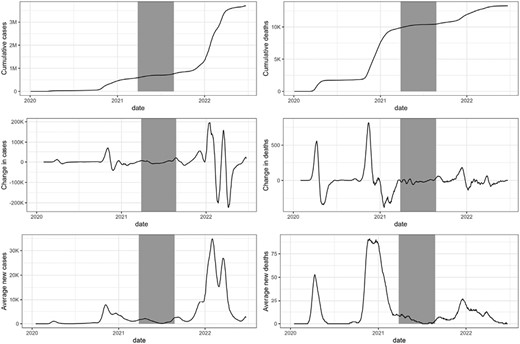
Visualization of the indicators of the trajectory of the COVID-19 pandemic used in the current study. Each chart refers to a different indicator of the trajectory of the COVID-19 pandemic in Switzerland. The black line shows how the indicator changed over time. The time series was interrupted at the end of year 2021. The gray rectangle corresponds to the current study period. Data source: https://covid19.who.int/data
The aim of this study is to test previous findings [8] and further explore the temporal association between indicators of the pandemic trajectory and hand hygiene and their impact of the effectiveness of behavior change interventions. Drawing upon previous research [8, 10], we tested the hypotheses that hand hygiene was: negatively associated with cumulative total cases of (H1a) and deaths from (H1b) COVID-19; positively related to new recent cases of (H2a) and deaths from (H2b) COVID-19; positively related with increases in recent cases of (H3a) and deaths from (H3b) COVID-19. Additionally, we tested the hypothesis that the uptake (i.e. cumulative number of administered doses) of a vaccine against COVID-19 was associated with a reduction in hand hygiene behavior (H4). Finally, we tested the assumption that the change in hand hygiene associated with the use of an app-based intervention, as found in Baretta et al. [15], was conflated with the change due to the indicators of the pandemic trajectory (H5).
Methods
Study design
We performed a secondary analysis of data from the optimization phase of Soapp, an app-based intervention conducted in Switzerland to promote hand hygiene during the COVID-19 pandemic [15, 16]. The study design was a double-blind parallel randomized trial with nine intervention groups (each receiving a different version of the app) [16]. Results from the optimization trial showed an overall increase in hand hygiene but there were no differences in hand hygiene between the intervention groups [15]. Therefore, the present paper does not distinguish the intervention groups. Each version of the app included an identical educational module which explained how to perform correct hand hygiene. During the study, participants reported the frequency of correct hand hygiene at key times on an electronic diary on day 2 (pre intervention), 8, 16, 24 (intervention period), and 32 (post intervention) (see Fig. 1 in the Supplementary Appendix A). Each diary included five 1-minute questionnaires to be filled out at different times of day. The optimization trial was conducted between 27th March and 25th August 2021. The trial is registered at ClinicalTrials.gov (NCT04830761).
Population and participants
The study population were healthy adults interested in using an app to improve hand hygiene behavior. Inclusion criteria were: (i) being at least 18 years old, (ii) owning a smartphone with mobile access to the internet, and (iii) being proficient in the German language. Participants were recruited in Switzerland through social media advertisements, mailing lists, and leaflets. After completing the screening survey, eligible participants were invited to sign the informed consent, download the app, register and use it. Out of the 232 randomized participants, 16 never filled out any of the hand hygiene diaries and were excluded from the current analysis, leading to a final sample of 216 participants (see CONSORT flow diagram in Supplementary Appendix A).
Measures
Hand hygiene behavior at key times
Hand hygiene was assessed via an electronic diary embedded in Soapp. On diary days, participants indicated five times per day whether each of 13 key situations to perform hand hygiene defined by the Swiss Federal Office of Public Health occurred (see Supplementary Appendix A). For each situation that occurred, participants reported how often they correctly washed or disinfected their hands in that specific situation using a 5-point Likert scale ranging from never (1) to always (5). The outcome was operationalized as the daily mean of the reported frequency of correct hand hygiene.
Indicators of the pandemic trajectory
Data about COVID-19 cases and deaths in Switzerland were downloaded from the WHO Coronavirus (COVID-19) Dashboard (https://covid19.who.int/data). The dataset provided daily raw values for number of (i) new cases, (ii) new deaths, (iii) cumulative cases, and (iv) cumulative deaths. We calculated three pairs of pandemic indicators following the same operationalization proposed in [8]:
- Total cumulative COVID-19 cases and deaths: the cumulative number of cases (deaths) that occurred between the beginning of the pandemic and the diary day;
- Recent new COVID-19 cases and deaths: the average number of new cases (deaths) in the 14 days prior to the diary day.
- Recent change in COVID-19 cases and deaths: difference between the number of new COVID-19 cases (deaths) for the period of 28–15 days before the diary day and the number of newer cases (deaths) for the period of 14–0 days before diary day. Positive scores indicate an increase in new cases (deaths).
Administered doses of vaccine
Total number of COVID-19 vaccine doses administered in Switzerland prior to the diary day. Data were downloaded from the website of Swiss Federal Office of Public Health.
Sociodemographic
Age, gender and living alone were collected as sociodemographic measures right after participants downloaded the app.
Statistical analysis
Data were analyzed using a multilevel (MLM) approach with the package lme4 [17] from the statistical software R (Version 4.1.2). The data and R code are available on OSF at https://osf.io/zgk7h/. As a first step, a null model with participant as random intercept and hand hygiene as dependent variable was performed to calculate the intraclass correlation (ICC) and quantify the variance in the outcome explained by individual differences. Secondly, we performed seven parallel MLMs, one for each predictor, as specified in hypotheses H1–H4. Each model was specified as follows:
- Fixed effects. The fixed effects included in the models were: (i) the hypothesized COVID-19 related predictor (i.e. the target indicator of the pandemic trajectory or the administered doses of vaccine), (ii) the use of Soapp, operationalized as the number of progressive days since the beginning of the intervention, and (iii) age, gender and living alone as covariates based on previous evidence [8]. Non-nominal predictors were standardized around their grand-mean while nominal predictors (i.e. gender, living alone) were recoded as dummy variables.
- Random effects. Models referring to hypotheses H1a, H1b, H2a, and H4 included both a random intercept (participant identifier) and random slope (hypothesized predictor). Models referring to hypotheses H2b, H3a, and H3b included the random intercept only. The need for including the random slope was based on the chi-square test between (i) the model with both random slope and random intercept and (ii) the model with random intercept only. Information on model specification and selection is described in Supplementary Appendix B.
Results
Participants (N = 216) were mostly female (74%) and leaving alone (66%); their mean age was 40 years old (SD = 16). Out of the five diary days, 93 (43%) participants filled all of them out, 29 (13%) participants filled out four diaries, 26 (12%) participants completed three diaries, 25 (12%) participants completed two diaries, and 43 (20%) participants filled in one diary only. Overall, 190 (88%) participants completed the first diary day (mean = 4.01, SD = 0.82), 153 (71%) filled out the second diary day (mean = 4.07, SD = 0.89), 146 (68%) completed the third diary day (mean = 4.19, SD = 0.75), 128 (59%) filled in the fourth diary day (mean = 4.19, SD = 0.83), and 135 (63%) the last diary day (mean = 4.18, SD = 0.90).
The intraclass correlation coefficient (ICC = 0.61) indicated that around 60% of the variance in hand hygiene was explained by between-person variance. Contrary to hypotheses H1–H4, multilevel analyses suggested no association between any of the six indicators of the pandemic trajectory or vaccine uptake and hand hygiene (Table 1). Regarding the conflation effect (H5), we found mixed evidence. The increase in hand hygiene associated with the use of Soapp was consistently significant in the models that included the new recent COVID-19 cases (β = 0.08, 95% CI = [0.03, 0.13]), new recent COVID-19 deaths (β = 0.07, 95% CI = [0.02, 0.12]), recent change in COVID-19 cases (β = 0.05, 95% CI = [0.01, 0.09]), recent change in COVID-19 deaths (β = 0.06, 95% CI = [0.02, 0.10]), and vaccine uptake (β = 0.08, 95% CI = [0.02, 0.13]). However, in line with H5, the association between the use of Soapp and hand hygiene was no longer significant in the two models including the total cumulative COVID-19 cases and deaths. Noteworthy, the covariate age was significantly associated with hand hygiene behavior in the models including total cumulative COVID-19 cases (β = 0.15, 95% CI = [0.03, 0.26]) and deaths (β = 0.14, 95% CI = [0.03, 0.26]), and recent change in COVID-19 cases (β = 0.11, 95% CI = [0.00, 0.22]). Further results regarding random effects and correlation of fixed effects are included in Supplementary Appendix B.
Multilevel models for the six indicators of the COVID-19 pandemic trajectory and administered doses of vaccine
| Model1a | Model1b | Model2a | Model2b* | Model3a* | Model3b* | Model4 | |
|---|---|---|---|---|---|---|---|
| Total cumulative cases | Total cumulative deaths | Recent new cases | Recent new deaths | Recent change in cases | Recent change in deaths | Cumulative doses vaccine | |
| Fixed effects | |||||||
| (Intercept) | |||||||
| Est. (SE) | 4.00 (0.10) | 4.01 (0.10) | 4.02 (0.10) | 4.01 (0.11) | 4.00 (0.11) | 4.00 (0.11) | 4.03 (0.10) |
| 95% CI | [3.79, 4.20] | [3.80, 4.21] | [3.82, 4.23] | [3.80, 4.21] | [3.79, 4.20] | [3.79, 4.21] | [3.82, 4.23] |
| Predictor | |||||||
| Est. (SE) | 0.08 (0.05) | 0.07 (0.05) | 0.05 (0.05) | 0.02 (0.05) | −0.05 (0.03) | 0.00 (0.02) | −0.03 (0.06) |
| 95% CI | [−0.02, 0.18] | [−0.04, 0.17] | [−0.05, 0.14] | [−0.07, 0.11] | [−0.10, 0.01] | [−0.04, 0.04] | [−0.15, 0.09] |
| Soapp use | |||||||
| Est. (SE) | 0.02 (0.03) | 0.03 (0.03) | 0.08 (0.02) | 0.07 (0.03) | 0.05 (0.02) | 0.06 (0.02) | 0.08 (0.03) |
| 95% CI | [−0.03, 0.07] | [−0.02, 0.08] | [0.03, 0.13] | [0.02, 0.12] | [0.01, 0.09] | [0.02, 0.10] | [0.02, 0.13] |
| Age | |||||||
| Est. (SE) | 0.15 (0.06) | 0.14 (0.06) | 0.07 (0.06) | 0.09 (0.06) | 0.11 (0.06) | 0.10 (0.06) | 0.09 (0.06) |
| 95% CI | [0.03, 0.26] | [0.02, 0.25] | [−0.04, 0.19] | [−0.02, 0.21] | [0.00, 0.22] | [−0.01, 0.21] | [−0.03, 0.21] |
| Gender (female) | |||||||
| Est. (SE) | 0.09 (0.11) | 0.09 (0.11) | 0.07 (0.11) | 0.08 (0.11) | 0.09 (0.11) | 0.09 (0.11) | 0.07 (0.11) |
| 95% CI | [−0.12, 0.31] | [−0.12, 0.30] | [−0.14, 0.28] | [−0.13, 0.30] | [−0.12, 0.31] | [−0.13, 0.30] | [−0.14, 0.28] |
| Living with somebody else | |||||||
| Est. (SE) | 0.19 (0.11) | 0.19 (0.11) | 0.19 (0.11) | 0.17 (0.12) | 0.17 (0.12) | 0.17 (0.12) | 0.17 (0.11) |
| 95% CI | [−0.03, 0.41] | [−0.03, 0.42] | [−0.03, 0.41] | [−0.06, 0.40] | [−0.06, 0.41] | [−0.06, 0.41] | [−0.05, 0.40] |
| Goodness of fit | |||||||
| R2 marginal | 0.057 | 0.054 | 0.048 | 0.046 | 0.049 | 0.046 | 0.048 |
| R2 conditional | 0.659 | 0.658 | 0.639 | 0.624 | 0.627 | 0.624 | 0.644 |
| Participants (L2) | |||||||
| N | 216 | 216 | 216 | 216 | 216 | 216 | 216 |
| Observations (L1) | |||||||
| N | 752 | 752 | 752 | 752 | 752 | 752 | 752 |
*The model included the random intercept only; values presented in bold are significant at P < .05; R2 Marginal = the part of the variance in the outcome explained by the fixed effects; R2 Conditional = the part of the variance in the outcome explained by the full model.
Discussion
Current results evidenced no association between hand hygiene and total cumulative COVID-19 cases and deaths, and recent 2-week delta change in COVID-19 cases and deaths. These results differed from previous research [8] where the authors found a negative association between hand hygiene and cumulative numbers of COVID-19 cases or deaths, and a positive association between hand hygiene and recent 2-week delta change in COVID-19 cases or deaths respectively. Similar to previous research [8], we did not find a significant association between hand hygiene and recent new COVID-19 cases or deaths. Additionally, we didn’t find any association between hand hygiene and the number of administered doses of vaccine. Finally, in line with the findings from the optimization trial of the Soapp app [15], models including recent COVID-19 cases/deaths, or increases therein, confirmed the significant change in hand hygiene during the use of Soapp. On the contrary, partially affirming the conflation hypothesis, the association between hand hygiene and the use of Soapp was no longer significant when adjusting for the cumulative number of COVID-19 cases or deaths.
A possible reason to the non-significant association between indicators of the COVID-19 pandemic trajectory and hand hygiene behavior could be attributed to the specific temporal context. Indeed, as shown in Fig. 1, the current study was conducted in a period of the pandemic that was characterized by a flat trajectory with only minimal fluctuations in the indicators. Differently, other periods (e.g. at the beginning of the pandemic in March 2020, last three months of 2021) were marked by broader fluctuations and steeper changes in the indicators. The Terror Management Health Model [9] may represent just one possible explanation for the null findings. Specifically, as the indicators flatten out, they became less salient and, ultimately, their effect on hand hygiene behavior was no longer significant. Similarly, the non-significant association between hand hygiene and the number of administered doses of vaccine is in line with previous research showing no or weak associations between the receipt of COVID-19 vaccine doses and the uptake of protective behavior such as physical distancing and mask use [18]. In this regard, it is worth mentioning that our operationalization of vaccine uptake relies on the count of vaccine doses administered in Swiss population and does not consider the participants’ vaccination status. Therefore, our results provide only a partial perspective on the association between vaccine uptake and hand hygiene behavior.
Future Research and Implications
Future research may benefit from careful consideration of indicators of the trajectory of COVID-19 when studying hand hygiene behavior change. This is especially relevant for interventional longitudinal studies with a repeated measures design. Indeed, time-dependent variables that increase steadily (e.g. days since beginning of an intervention, cumulative cases of COVID-19) might share most of their influence on the dependent variable while their unique effect is marginal. Omitting the indicators of the trajectory of COVID-19 from statistical models may lead to wrongly attributing the effectiveness of an intervention, as it may not be discernible from the impact of the trajectory itself. Overall, adjusting for the indicators of the pandemic trajectory is a valuable approach when evaluating behavior change interventions, as it ensures more accurate estimates of the true intervention effect.
Additionally, the current findings matter also for its implication on the development of behavior change interventions targeting hand hygiene during a pandemic. The fact that the association between pandemic trajectory and hand hygiene seems to decline in some periods of the pandemic have some implications for the timely delivery of specific intervention components [12]. For instance, at the beginning of the pandemic, when individuals are more receptive to the information regarding the trajectory, a decline in the number of recent cases or deaths can be interpreted as a signal that the threat of the pandemic is receding, resulting in a decrease in adherence to hand hygiene behavior [8]. In turn, our results suggest that as the pandemic progressed and the trajectory flattened, the indicators became less informative about individuals’ change in hand hygiene behavior and then less apt to detect potential states of vulnerability (i.e. when hand hygiene is not implemented as intended). Overall, a dynamic adjustment of the intervention content based on the pandemic trajectory appears to be a promising strategy for ensuring that the intervention is delivered when needed most.
Limitations
This study has some limitations. First, the assessment of hand hygiene behavior was self-reported via electronic diaries. Even though this approach limits the risk of retrospective bias, social desirability cannot be ruled out. Second, current results are from a specific country and specific period of time after the outbreak; therefore, cautions should be taken when generalizing to other geographical areas or pandemic periods. Third, the limited number of assessment points for each participant didn’t allow to investigate the within-person dynamics regarding the association between hand hygiene and pandemic trajectory. Additionally, the present study was conducted four months after the first dose of vaccine was administered in Switzerland. Hence, the null findings regarding the association between vaccine uptake and hand hygiene cannot be generalized to the initial phase of the vaccine administration process.
Conclusions
This study addressed the call raised by public health experts for a robust understanding of the factors associated with the adoption of preventive behaviors in a pandemic context. Within this scope, we presented an integrated perspective on the potential role of the indicators of the COVID-19 pandemic trajectory on behavior change interventions targeting hand hygiene. First, we provided evidence that the validity of previous findings [8] might be constrained to a specific period of the COVID-19 pandemic. Still, we described how the statistical evidence for the effectiveness of behavior change interventions targeting hand hygiene can be impacted by the inclusion of specific trajectory indicators (i.e. cumulative cases and cumulative deaths).
Authors’ Contributions
DB: Conceptualization, Data Curation, Formal analysis, Writing—Original Draft, Discussion, Writing—Review & Editing; JI: Funding acquisition, conceptualization, Supervision, Discussion, Writing—Review & Editing.
Conflict of interest statement. Dario Baretta and Jennifer Inauen declare that they have no conflicts of interest.
Funding
This study was funded by Ursula-Wirz Stiftung.
Human Rights
All procedures performed in this study involving human participants were conducted in accordance with the ethical standards of the local institutional ethics committee and with the Helsinki Declaration of 1975, as revised in 2000. Ethical approval was obtained from the Ethical Committee (KEK) of the Canton of Bern: ID 2021-00164.
Informed Consent
Informed consent was obtained from all individual participants included in the study.
Study registration: The study was pre-registered at https://clinicaltrials.gov/ct2/show/NCT04830761.
Analytic plan pre-registration: This brief report is the result of secondary data analysis and the analysis plan was not formally pre-registered.
Data Availability
De-identified data from this study are available in a public archive: https://osf.io/zgk7h/. Analytic code availability: Analytic code used to conduct the analyses presented in this study are available in a public archive: https://osf.io/zgk7h/. Materials availability: Some of the materials used to conduct the study are presented in a public archive and are described in the study protocol paper https://bmjopen.bmj.com/content/12/3/e055971.
