


ABSTRACT
Modelling the growth profiles of sheep not only provides information about how body weight changes with age but also distills these serial measures into biologically important parameters which can be used in genetic evaluation programs. The objective of the present study was to evaluate a series of different functions applied to serial body weight measures of lowland sheep and, in doing so, also explore the relationship between the parameters within and across functions. The evaluated functions were Brody, Gompertz, Logistic, negative exponential, Richards and von Bertalanffy. The data set used consisted of 158,463 body weight records (range of 6 to 38 records per animal) from 13,090 female sheep. The functions were fitted to each animal separately. The coefficient of determination (R2) and root mean square error (RMSE) per animal, along with the ease of model convergence, were used to evaluate model fit. The percentage of animals that achieved convergence per function ranged from 82.39% (Richards) to 100.00% (negative exponential and Logistic). The mean R2 value for the Logistic function was the lowest (0.94), while that for the Richards function was the highest (0.98). A weak negative correlation (r = −0.23 to −0.13) was estimated between the A (asymptotic weight) and B (integrated constant related to initial weight) parameters for all the functions except for Richards. The A and K (maturity rate) parameters of all the functions were negatively correlated and ranged from −0.55 (Brody) to −0.41 (Logistic). The values of the A parameter across all the functions were strongly positively correlated. The estimates for the B parameter of Logistic and Richards functions exhibited a very weak correlation (r = −0.04). A weak to strong correlation between the K parameter values across all functions was observed. Results suggested that all the evaluated functions, except the Richards function, can be applied to model the growth of lowland sheep. The Gompertz and von Bertalanffy functions were considered as the best fitting functions to describe the body weight profiles of Irish female lowland sheep based on their fit to the data, the ease of convergence, and the biological sensibility of the estimated function parameters.
Lay Summary
The knowledge of how growth in animals changes over time is not only helpful to scientists to understand the complex nature of growth in different phases of animal life, but also to primary producers to develop bespoke management and breeding decisions to optimize animal performance. The study evaluated six different growth functions for their suitability to model body weight data of lowland sheep and estimate mature weights (parameter A) and maturity rates (parameter K) of animals, as well as the correlation between these parameters. The average mature weight of female lowland sheep estimated by all six functions ranged from 67.42 to 76.10 kg, while the maturity rate ranged between 0.0024 and 0.0135 kg/day per kg mature weight. The A and K parameters were negatively correlated, suggesting that animals with greater maturity rates had smaller mature weights, and due to smaller mature weights, these animals mature early compared to those with greater mature weight. Overall, the results of this study will help understand the growth profile of female lowland sheep.
INTRODUCTION
Lamb meat is one of the main outputs of sheep production systems globally. A key performance metric for achieving profitable production in sheep is achieving optimum slaughter weight early (McGovern et al., 2020). Slower growing lambs have delayed age at slaughter, with generally higher maintenance energy costs while also potentially exposing them to a greater risk of endemic or parasitic diseases (Gascoigne and Lovatt, 2015). Similarly, puberty occurs earlier in female lambs with higher growth rates, as achieving a critical body weight is a key physiological requirement for the onset of the reproductive cycle. Advancing the age at puberty in ewe lambs and ensuring first lambing at one year of age can play a crucial role in increasing the reproductive efficiency of the entire flock (Rosales Nieto et al., 2013). Understanding the growth of animals on individual farms, especially when benchmarked against contemporary farms, can be used to develop bespoke management and breeding advice to individual producers. Growth functions can play an essential role in summarizing longitudinal body weight data into biologically interpretable parameters, which can be used to inform not just herd-specific breeding or management recommendations but can also be used in breeding programs to improve population-level growth rates (Lupi et al., 2015; Do and Miar, 2020; Sharif et al., 2021).
The growth profiles of several domesticated species like sheep (Sharif et al., 2021), goats (Waheed et al., 2011), cattle (Berry et al., 2005), minks (Do and Miar, 2020), pigs (Coyne et al., 2015), turkeys (Arando et al., 2021), chickens (Darmani Kuhi et al., 2003), rabbits (de Sousa et al., 2022) and buffalos (Abbas et al., 2024) have previously been described using nonlinear functions. A whole myriad of different functions have been explored with the advantages and disadvantages of each described previously (Darmani Kuhi et al., 2010; Lupi et al., 2015).
The growth profile of sheep has been modeled using various types of models, spanning from simple linear models to complex nonlinear models (Lambe et al., 2006; Lupi et al., 2015; Hojjati and Ghavi Hossein-Zadeh, 2018; Sharif et al., 2021; Deribe et al., 2023); some of the nonlinear models were of functional forms (Mokhtari et al., 2019) with others based on random regression (McGowan et al., 2023) or random splines (Zamani et al., 2016). Nonlinear models generally fit the data better than linear regression models (Lambe et al., 2006) because body weight changes in a sigmoidal fashion with age (Sharif et al., 2021). There is, nonetheless, a lack of consensus on the most appropriate function to model growth rate in sheep with the most appropriate model likely being population-specific while also depending on the planned end use. An optimal function is characterized by its flexibility (Topal et al., 2004) and ability to accurately model growth. Therefore, the objectives of the present study were to compare the suitability of different mathematical functions to model the growth profiles of Irish female lowland sheep and to investigate the relationship between different model parameters within the same function as well as between functions.
MATERIAL AND METHODS
Ethics Statement
The data for this study were obtained from an existing database of Sheep Ireland (www.sheep.ie). So, the animal ethics committee’s approval was not required for this study.
Data
The data used in this study originated from the Sheep Ireland national database (https://www.sheep.ie). Sheep farmers in Ireland, often, record the body weight of all animals at five critical time points: birth, approximately 40 d of age, approximately 100 d of age, approximately 150 d of age and, if still on the farm, at maturity. In addition to these, many producers record body weights at other ages. The data from only lowland sheep flocks were used in this study. A total of 990,306 body weight records from 228,390 female lowland sheep born between the years 2010 and 2020, inclusive, with a maximum birth rank of 4 (quadruplets) and a maximum rearing rank of 3 (triplets), were available. Only animals in a flock with at least 20 individuals recorded per year were retained, resulting in a reduction in animals and records to 199,576 and 902,285, respectively.
The median and interquartile range (IQR) in weight for each day of age in the dataset were calculated. Individual weights that were heavier than the third, or lighter than the first quartile, by ≥ 2 IQR, were considered outliers and discarded. After this edit, weights that were more than three standard deviations from the mean daily weight were also considered outliers and removed. After discarding outliers, the dataset contained 820,344 body weight records from 175,742 animals. Finally, only female sheep with at least 1 weight record in the first 7 d of life, at least 2 weight records between 8 and 180 d, at least 2 weight records between 181 and 999 d, and at least 1 weight record at or after 1,000 d of life were retained. This resulted in a minimum of 6 records per animal. Body weight records after 1,825 d of age were not considered further. The final dataset consisted of 158,463 body weight records from 13,090 animals. The number of body weight records per animal ranged from 6 to 38. A major part of the final data set (87.35 %) originated from commercial flocks and only 12.65% originated from purebred flocks. The main purebred breeds included in the dataset were Texel (711), Belclare (276), Charollais (250), Suffolk (207), Lleyn (130) and Vendeen (62).
Fitting of Growth Functions and Estimating Parameters
The body weight records of all animals were individually modeled using six different nonlinear functions described in Table 1. The studied functions were the negative exponential with two parameters (A and K), Brody, Gompertz, Logistic, and von Bertalanffy, all with three parameters (A, B and K), and Richards with four parameters (A, B, K and M). The A parameter of all functions represents the asymptotic weight, which is often also referred to as mature weight; it does not, however, represent the heaviest weight achieved by an animal but is, instead, the estimated mean body weight that an animal will achieve, regardless of any temporary environmental effects (Bathaei and Leroy, 1998). The B parameter is defined as the constant of integration associated with birth weight. It represents the fraction of the final asymptotic weight to be gained postnatal and can account for situations where the initial weight and time of origin are not equal to zero. In a case, where both the initial weight and time of origin are not equal to zero, then B = 1 (Bathaei and Leroy, 1998). In the Gompertz function, the B parameter represents the logarithm of the ratio between the A parameter and birth weight. The K parameter represents the rate at which an animal matures and is expressed as kg per day per kg mature weight (Coyne et al., 2015). The M parameter in the Richards model describes the shape of the curve by determining the point of inflection (da Silva et al., 2012).
Description of different growth function.
| Function | Equation1 | Reference |
|---|---|---|
| Brody | (Brody, 1945) | |
| Gompertz | (Winsor, 1932) | |
| Logistic | (Nelder, 1961) | |
| Negative exponential | (Ghavi Hossein-Zadeh, 2015) | |
| Richards | (Richards, 1959) | |
| von Bertalanffy | (von Bertalanffy, 1957) |
| Function | Equation1 | Reference |
|---|---|---|
| Brody | (Brody, 1945) | |
| Gompertz | (Winsor, 1932) | |
| Logistic | (Nelder, 1961) | |
| Negative exponential | (Ghavi Hossein-Zadeh, 2015) | |
| Richards | (Richards, 1959) | |
| von Bertalanffy | (von Bertalanffy, 1957) |
1Y = observed body weight at age T (days); A = Asymptotic weight; B = Integrated constant; K = rate of maturity; M = inflection point to A.
All functions were fitted to each individual animal separately using the NLIN procedure of SAS 9.4 (SAS Institute Inc.) and the parameter values estimated per animal. Each parameter of each model was evaluated for any extreme values. Extreme parameter values were defined as any parameter value 1.5 IQR times greater than the third quartile or 1.5 IQR times lesser than the first quartile for that parameter for that function; these were noted and not included in the summary statistics. This was undertaken to mitigate the impact of outliers on downstream analyses.
The statistical methods used to estimate the fit of each model to the data included, per animal, the root mean square error (RMSE) and the coefficient of determination (R2). The ease of convergence and estimation of biological sensible parameters were additional criteria to evaluate function suitability. Within function, correlations were estimated between the individual animal solutions for the different model parameters. Correlation and regression coefficients were also calculated between the individual animal solutions for the same model parameter across functions.
RESULTS
Function Fitting
The percentage of animals that converged varied by function, ranging from 82.39% (Richards function) to 100.00% (Logistic and negative exponential functions) (Table 2). The Gompertz function yielded the highest percentage (98.27%) of animals that converged with parameter estimates within the acceptable range, while the Richards function had the lowest percentage (81.43%). The number of animals common to more than one function where convergence was not achieved is in Supplementary Table 1; included in Supplementary Table 2 is the number of animals common to each function where their function parameter values were non-sensible. Of the 12 animals that failed to converge for the Brody function, all 12 also failed to converge for the Richards function; this represented the two functions with the greatest number of animals in common that failed to converge. Of the 637 animals with non-sensible parameter estimates for the Brody function, 256 also had non-sensible parameter estimates for the negative exponential function.
Percentage of animals that converged for each function and the percentage of animals (that converged) with function parameter estimates within acceptable range of each function in female lowland sheep.
| Function | Converged | Parameters estimates within acceptable range1 |
|---|---|---|
| Brody | 99.91 | 95.12 |
| Gompertz | 99.99 | 98.27 |
| Logistic | 100 | 96.62 |
| Negative exponential | 100 | 97.08 |
| Richards | 82.39 | 81.43 |
| von Bertalanffy | 99.92 | 98.26 |
| Function | Converged | Parameters estimates within acceptable range1 |
|---|---|---|
| Brody | 99.91 | 95.12 |
| Gompertz | 99.99 | 98.27 |
| Logistic | 100 | 96.62 |
| Negative exponential | 100 | 97.08 |
| Richards | 82.39 | 81.43 |
| von Bertalanffy | 99.92 | 98.26 |
1Acceptable range for each parameter of a growth function was defined as any value that was not greater or lesser than third and first quartile by 1.5 times to IQR, respectively.
Of the individuals that converged with sensible model parameters, a minimal difference existed between the functions in how well they fit the data. The mean R2 for each function varied from 0.94 (Logistic) to 0.98 (Richards) (Table 3). The Richards and Logistic functions had the lowest (3.13 kg) and the highest (5.25 kg) mean RMSE, respectively (Table 3). The observed and modeled body weights from the different functions are presented in Figure 1. Overall, the trajectory of the modeled body weight data followed the actual data except for the cyclic undulations associated with lambing and body tissue catabolism and anabolism throughout pregnancy and lactation (Figure 1).
Summary of coefficient of determination (R2) and root means square error (RMSE) of different growth functions in female lowland sheep.
| Function | R2 | RMSE (kg) | ||||||||||
|---|---|---|---|---|---|---|---|---|---|---|---|---|
| Mean ± SE | Median | Min | Q1 | Q3 | Max | Mean ± SE | Median | Min | Q1 | Q3 | Max | |
| Brody | 0.96 ± 0.0003 | 0.97 | 0.62 | 0.95 | 0.98 | 1.00 | 3.98 ± 0.014 | 3.86 | 0.06 | 2.88 | 4.91 | 20.32 |
| Gompertz | 0.95 ± 0.0003 | 0.96 | 0.63 | 0.93 | 0.97 | 1.00 | 4.76 ± 0.015 | 4.66 | 0.16 | 3.58 | 5.77 | 20.23 |
| Logistic | 0.94 ± 0.0004 | 0.95 | 0.62 | 0.92 | 0.97 | 1.00 | 5.25 ± 0.015 | 5.14 | 0.52 | 4.02 | 6.28 | 17.26 |
| Negative exponential | 0.95 ± 0.0003 | 0.96 | 0.62 | 0.94 | 0.98 | 1.00 | 4.68 ± 0.015 | 4.49 | 0.86 | 3.44 | 5.68 | 20.40 |
| Richards | 0.98 ± 0.0003 | 0.98 | 0.63 | 0.97 | 0.99 | 1.00 | 3.13 ± 0.015 | 2.95 | 0.05 | 2.19 | 3.86 | 13.78 |
| von Bertalanffy | 0.95 ± 0.0003 | 0.96 | 0.63 | 0.94 | 0.98 | 1.00 | 4.50 ± 0.014 | 4.43 | 0.21 | 3.37 | 5.50 | 20.24 |
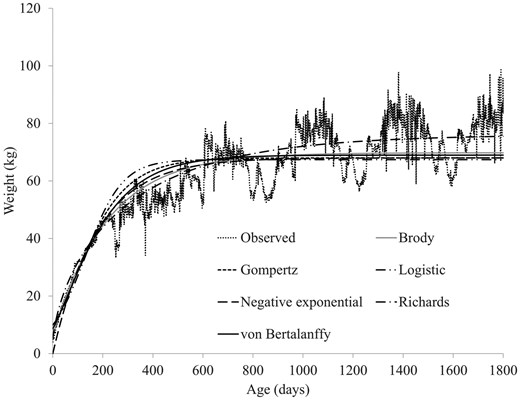
Growth curves of female lowland sheep as observed and as modeled by nonlinear functions.
Function Parameters
The mean value for the A parameter varied between functions, with the lowest mean A parameter value for the Logistic function (67.42 kg) and the highest for the Richards function (76.10 kg). The mean of the A parameter was similar for the Gompertz and negative exponential functions (68.02 kg). However, the standard deviation of the A parameter was lower for the negative exponential function (11.64 kg) compared to the Gompertz function (12.09 kg) (Table 4). The highest mean B parameter across the functions was for the Gompertz (2.05) and Logistic (5.76) functions (Table 4). Of the remaining functions, the mean B parameter varied from 0.05 (von Bertalanffy) to 0.99 (Richards). The Richards and Logistic functions had the lowest (0.0024 kg/d per kg asymptotic weight) and the highest (0.0135 kg/d per asymptotic weight) mean values for the K parameter, respectively (Table 4). The mean and standard deviation of the M parameter of the Richards function were 0.58 and 0.18, respectively.
Mean and standard deviation (SD) of A (asymptotic weight), B (integrated constant) and K (maturity rate) parameters in female lowland sheep.
| Function | A (kg) | B | K (kg/day per kg asymptotic weight) | |||||||||
|---|---|---|---|---|---|---|---|---|---|---|---|---|
| Mean | SD | Min | Max | Mean | SD | Min | Max | Mean | SD | Min | Max | |
| Brody | 69.80 | 12.54 | 38.20 | 106.79 | 0.91 | 0.04 | 0.80 | 1.02 | 0.0046 | 0.0016 | 0.0004 | 0.0091 |
| Gompertz | 68.02 | 12.09 | 36.17 | 103.91 | 2.05 | 0.35 | 1.07 | 3.03 | 0.0086 | 0.0034 | 0.0007 | 0.0180 |
| Logistic | 67.42 | 11.64 | 34.80 | 101.43 | 5.76 | 2.03 | 1.56 | 11.52 | 0.0135 | 0.0054 | 0.0012 | 0.0284 |
| Negative exponential | 68.02 | 11.64 | 38.05 | 102.38 | 0.0056 | 0.0014 | 0.0018 | 0.0095 | ||||
| Richards1 | 76.10 | 14.60 | 36.69 | 115.94 | 0.99 | 0.02 | 0.93 | 1.00 | 0.0024 | 0.0015 | 0.0001 | 0.0084 |
| von Bertalanffy | 68.98 | 12.15 | 36.32 | 104.21 | 0.50 | 0.07 | 0.31 | 0.69 | 0.0067 | 0.0029 | 0.0001 | 0.0152 |
Parameter M in Richards (Mean = 0.58, SD = 0.18, Min = 0.14, Max = 1.32).
Correlation Among Parameters Within Function
Within function, the A and B parameters were all negatively correlated (r = −0.23 to −0.13), except for the Richards function, where the correlation between both parameters was 0.15 (Table 5). Similarly, within function, a negative correlation ranging from −0.55 (Brody) to −0.41 (Logistic) existed between the A and K parameters. The B and K parameters of the Richards function were negatively correlated (r = −0.76), while the B and K parameters of all the other functions were positively correlated (r = 0.56 to 0.79). The M parameter of the Richards function was negatively correlated with the A (r = −0.13) and B (r = −0.88) parameters but positively correlated with the K (r = 0.82) parameter of the Richards function.
Correlation between different parameters within each function estimated in female lowland sheep.
| Parameters | Brody | Gompertz | Logistic | Negative exponential | Richards | von Bertalanffy |
|---|---|---|---|---|---|---|
| A, B | −0.15 | −0.23 | −0.13 | 0.15 | −0.20 | |
| A, K | −0.55 | −0.51 | −0.41 | −0.50 | −0.44 | −0.49 |
| B, K | 0.56 | 0.76 | 0.79 | −0.76 | 0.77 | |
| A, M | −0.13 | |||||
| B, M | −0.88 | |||||
| K, M | 0.82 |
Correlation and Regression Between the Same Parameter Across Functions
A strong positive correlation coefficient (r ≥ 0.82) existed between the values for the A parameter of all the functions (Table 6). The values of the B parameter from the different functions were strongly positively correlated with each other; the exception was the B parameter of the Richards function which was negatively correlated with the B parameter of all the other functions (Table 7). A very weak relationship (r = −0.04; P < 0.001 when tested against zero) existed between the B parameter of Richards and Logistic functions. Although positive correlations existed between the values of the K parameter across all functions (Table 8), they varied in strength from weak (r = 0.25 between Logistic and Richards) to strong (r = 0.99 between the Brody and von Bertalanffy models).
Correlation (below diagonal) and regression ± standard error (SE) (above diagonal) between the A parameter (asymptotic weight) of different functions in female lowland sheep.
| Function1 | Brody | Gompertz | Logistic | Negative exponential | Richards | von Bertalanffy |
|---|---|---|---|---|---|---|
| Brody | 1.03 ± 0.002 | 1.05 ± 0.002 | 1.04 ± 0.002 | 0.69 ± 0.005 | 1.03 ± 0.002 | |
| Gompertz | 0.98 | 1.02 ± 0.002 | 1.00 ± 0.002 | 0.65 ± 0.005 | 0.96 ± 0.002 | |
| Logistic | 0.97 | 0.98 | 0.97 ± 0.002 | 0.62 ± 0.005 | 0.91 ± 0.003 | |
| Negative exponential | 0.97 | 0.97 | 0.98 | 0.63 ± 0.005 | 0.91 ± 0.003 | |
| Richards | 0.83 | 0.82 | 0.84 | 0.80 | 1.03 ± 0.007 | |
| von Bertalanffy | 0.99 | 0.96 | 0.95 | 0.94 | 0.83 |
1Functions in rows were used as dependent variables in regression.
Correlation (below diagonal) and regression ± standard error (SE) (above diagonal) between the B parameter (integrated constant) of different functions in female lowland sheep.
| Function1 | Brody | Gompertz | Logistic | Richards | von Bertalanffy |
|---|---|---|---|---|---|
| Brody | 0.08 ± 0.001 | 0.01 ± 0.001 | −0.69 ± 0.021 | 0.52 ± 0.002 | |
| Gompertz | 0.73 | 0.14 ± 0.008 | −2.57 ± 0.217 | 4.21 ± 0.030 | |
| Logistic | 0.55 | 0.86 | −5.55 ± 1.331 | 20.38 ± 0.214 | |
| Richards | −0.34 | −0.13 | −0.04 | −0.06 ± 0.003 | |
| von Bertalanffy | 0.87 | 0.78 | 0.65 | −0.22 |
1Functions in rows were used as dependent variables in regression. Negative exponential does not include parameter B.
Correlation (below diagonal) and regression ± standard error (SE) (above diagonal) between the K parameter (maturity rate) of different functions in female lowland sheep.
| Function1 | Brody | Gompertz | Logistic | Negative exponential | Richards | von Bertalanffy |
|---|---|---|---|---|---|---|
| Brody | 0.41 ± 0.002 | 0.20 ± 0.002 | 1.01 ± 0.004 | 0.45 ± 0.009 | 0.52 ± 0.002 | |
| Gompertz | 0.83 | 0.54 ± 0.003 | 1.90 ± 0.012 | 0.69 ± 0.021 | 0.93 ± 0.006 | |
| Logistic | 0.66 | 0.86 | 2.42 ± 0.026 | 0.85 ± 0.036 | 1.30 ± 0.012 | |
| Negative exponential | 0.90 | 0.80 | 0.64 | 0.28 ± 0.009 | 0.37 ± 0.003 | |
| Richards | 0.46 | 0.33 | 0.25 | 0.31 | 0.24 ± 0.005 | |
| von Bertalanffy | 0.90 | 0.80 | 0.70 | 0.74 | 0.42 |
1Functions in rows were used as dependent variables in regression.
The regression coefficient for the A parameter of one function on the A parameter of the other functions varied from 0.62 (regression of Logistic on Richards) to 1.05 (regression of Brody on Logistic) (Table 6). The regression coefficient for the B parameter of Richards on the B parameter of other functions was negative and ranged from −5.55 (regression of Logistic on Richards) to −0.06 (regression of Richards on von Bertalanffy). However, the regression coefficient for the B parameter of all the other functions on each other was positive, with the regression of Logistic on von Bertalanffy being the highest (b = 20.38) and the regression of the B parameter from the Brody on that of the Logistic being the lowest (b = 0.01) (Table 7). The regression of the K parameter of the Brody function on the K parameter of the Logistic function had the lowest regression coefficient (b = 0.20), whereas the regression of the K parameter of the logistic function on the same parameter of the negative exponential function had the highest regression coefficient (b = 2.42) (Table 8).
DISCUSSION
Six nonlinear functions (i.e., Brody, Gompertz, Logistic, negative exponential, Richards and von Bertalanffy) were fitted to the body weight data of female lowland sheep in order to define their growth profiles and estimate the correlations between the function parameters. Body weight data from only female sheep was modeled in this study because most remained on the farm until they reached maturity; in fact, all animals included in the present study had at least one body weight after 999 d of age. It was expected that ewes could have achieved their mature weights by this age; however, the mean weights of lowland sheep plotted against age in Figure 1 show that ewes continued to gain weight beyond this age. Overall, the delay in ewes to attain their full mature weight might have happened due to several reasons including physiological stresses of pregnancy and lactation. Ewes are generally bred when they reach 50% to 70% of their mature weight (Rosales Nieto et al., 2013). The physiological stress of pregnancy in breeding ewes slows their growth, and in challenging environments, it may prevent them from making any further gains in body size after entering the breeding flock (Coop and Clark, 1966). Even under optimal conditions, many breeding ewes are unlikely to achieve their maximum genetic potential for mature body size because the growth in sheep is also influenced by environmental factors (Sharif et al., 2022). Similarly, Coop (1973) noted that nutritional deficiencies in breeding ewes prevented them from exceeding 60% of their mature weight, and these ewes showed a substantial increase in live weight when moved to improved pasture systems at 5 to 6 yr of age.
Comparison of Functions
The number of records per animal and their distribution across age needs to be considered in light of the complexity (e.g., number of model parameters) of the function to be fitted. Generally, functions with fewer parameters are easier to fit; this was also concluded from the present study whereby the algorithm converged for all animals for the negative exponential function (i.e., 2 parameters); ≥ 99.91% of the animals converged for the functions with 3 parameters, but just 82.39% of animals converged for the Richards function with 4 parameters. In agreement with the present study, both Malhado et al. (2009) and da Silva et al. (2012) reported difficulty in achieving convergence for modeling body weights with the Richards (4 parameters) function in sheep. Even though Richards function had the highest mean R2 value and the smallest mean RMSE value of the studied functions in the present study, it cannot be considered as the best function given its low rate of animals that converged with sensible parameter estimates. This conclusion also corroborates previous studies that evaluated the Richards function in modeling the body weight in Brazilian sheep (de Paz et al., 2018) and Kermani sheep (Mokhtari et al., 2019). However, the convergence issue of Richards can also be linked to the availability, or lack thereof, weight records at the later stages of life. Supplementary analysis in the present study revealed that animals with weight records beyond 1,400 d of age had a 1.40 (95% confidence interval of 1.27 to 1.53) times greater odds of achieving convergence for the Richards function than those animals with no weight records after 1,400 d of age. This finding suggests that the convergence issue of the Richards function can possibly be mitigated if more weight records from later life stages are available.
Of the functions evaluated where convergence was achieved, the Richards function had the greatest number of converged animals with nonsensible parameter estimates; this agrees with the study of Lambe et al. (2006) in sheep, who noted that while Richards function is known for its flexibility due to not having a fixed inflection point, this flexibility may result in nonsensible parameters values. A function may also generate non-biological parameter estimates for animals if the number of records per individual is low relative to the number of parameters in the function. However, all animals in the present study had at least 6 body weight records.
With the exception of the Richards function, there was actually little difference in fitting ability among the remaining functions. Ali et al. (2020) and Sharif et al. (2021) evaluated 4 functions (Brody, Gompertz, Logistic and von Bertalanffy) to model growth data of female Kajli and female Lohi sheep, respectively; although both studies reported small differences in R2 values of evaluated functions, both chose Brody as the best function on the basis of 4 fit statistics criteria of the R2, RMSE and Akaike and Bayesian information criteria. Ahmadpanah et al. (2023) also compared the 4 aforementioned functions along with the Richards function to predict the optimum weight and age at slaughter for Kurdi sheep and despite Brody being the best fitting function, they chose the second best function (von Bertalanffy) because of the lack of inflection point in the Brody function. Hence, a growth function is not only selected on the measures of fit statistics but also on its possible application.
Considering the ability of a function to describe the body weight data of female lowland sheep up to 5 yr of age as well as the generation of sensible parameter estimates, in the present study, both the Gompertz and von Bertalanffy were considered the best functions with minimal obvious differences between both functions. In an attempt to differentiate between both functions and select the optimal function for Irish lowland sheep data, the fit of both the Gompertz and von Bertalanffy functions to the data across different stages of life was explored. Stage of life was stratified into 4 stages (first: ≤ 13 wk; second: 14 to 26 wk; third: 27 to 52 wk; fourth: > 52 wk) and the R2 per animal per function estimated for each life stage. The R2 values per stage were transformed to be normally distributed and a linear model ran where the dependent variable was the transformed R2 and the fixed effects were function (i.e., Gompertz and von Bertalanffy), stage and the interaction between the two. Neither function nor an interaction of function and stage was associated (P > 0.05) with the goodness of fit, signifying that both functions fit the data equally well in all stages of life with no difference in the goodness of fit between them. This choice of models corroborates the conclusions of Topal et al. (2004), who compared Brody, Gompertz, Logistic and von Bertalanffy and reported Gompertz and von Bertalanffy as the best functions for modeling the growth profiles of Morkaraman and Awassi sheep, respectively. This conclusion also corroborates the study of Berry et al. (2005), who selected von Bertalanffy as the best function from the five evaluated functions (Brody, Gompertz, Logistic, von Bertalanffy and Richards) by considering the highest number of animals converged for modeling live weight in cattle. Similarly, Gompertz was considered as an ideal function among the linear, nonlinear and polynomial functions for modeling body weights of Texel and Scottish Blackface sheep (Lambe et al., 2006).
Function Parameters
The range of mean (67.42 to 76.10 kg) mature weight (A parameter) provided by all of the six functions for the female lowland sheep in the present study was greater than most of the previous studies on female sheep breeds like the Shall sheep (Ghavi Hossein-Zadeh, 2015) and both the Kajli (Ali et al., 2020) and Lohi sheep (Sharif et al., 2021). The differences in mature weights could be a result of breed differences. The other possible explanation for larger mature weights estimated in the present study might be due to the inclusion of weight records up to 5 yr of age, while these earlier studies only used weight records up to the maximum of 18 mo of age. This finding is consistent with the study of Lambe et al. (2006) in UK sheep, where the functions underestimated mature weight because of using only early life data (8 mo) for modeling. Similarly, in a study on female mice, Bunger and Schonfelder (1984) concluded that longitudinal body weight data consisting of observations up to at least maturity or otherwise entire life are required to accurately estimate mature weight.
The greatest mean values for the B parameter of the Logistic and Gompertz functions compared to the other functions in the current study correspond with previous findings in sheep (Ali et al., 2020; Sharif et al., 2021). The difference in the mean of the K parameter of different functions might be attributed to the differences in the inflection points of these functions (Lambe et al., 2006). The mean estimates for the B and K parameters in the current study also varied from previous studies on sheep (Ghavi Hossein-Zadeh, 2015; Hojjati and Ghavi Hossein-Zadeh, 2018; Sharif et al., 2021). The difference in the parameter values of the present study from the existing literature might be due to differences in the breeds and production systems.
Despite the fact that the B parameter does not have a significant biological meaning (Malhado et al., 2009); the negative correlation and regression coefficients between the B parameter of Richards and all the other evaluated functions may indicate that the B parameter of Richards function means something different to the B parameter of functions with 2 or 3 parameters. A weak to moderate correlation between the K parameter of Richards and other functions compared to the strong correlation for the K parameter of all the other functions can be explained by the fact that Richards has a flexible inflection point, affecting the estimates of the K parameter for this function (Lambe et al., 2006).
A weak negative correlation between A and B parameters for all the functions except for the Richards function was in line with the findings of Bathaei and Leroy (1996), who reported similar results with the Brody function for these two growth parameters in Mehraban sheep. The parameter K is a function of the maximum growth rate relative to mature weight. The presence of a negative correlation between the A and K parameters in all the functions suggests that animals with larger K values had smaller asymptotic weights (da Silva et al., 2012). As an indicator of maturation rate, the parameter K plays a significant role in determining the rate at which an animal reaches its asymptotic weight. Animals with higher K values attain maturity more rapidly than those with lower K values, even when their birth weight are similar (Malhado et al., 2009).
The findings from the present study suggested the overall suitability of all the evaluated functions, except the Richards function, for modeling body weight and estimating growth parameters in Irish female lowland sheep from birth to maturity. The rate of convergence for the Richards function was low and it also provided non-sensible estimates of growth parameters for a large number of animals; due to this reason, the Richards function was deemed not appropriate to model the body weight data in the present study. The Gompertz and von Bertalanffy functions were the best in terms of achieving convergence with sensible parameter estimates and can be used for estimating important traits such as mature weight or growth rate of lowland female sheep. By utilizing these models, producers can identify animals that exhibit rapid growth and reach their target mature weight in a shorter time frame. Similarly, these functions can possibly be applied to predict the future weights of lowland sheep, especially the optimum age and weight for slaughter and puberty. This will help farmers to identify replacement ewe lambs at an early age to enhance the productive and reproductive efficiency of the flock. Additionally, growth curve parameters can be used in breeding programs to select the appropriate animals for the production system. However, future studies will be needed to estimate genetic variance components and genetic correlations for these parameters to facilitate their use as traits in genetic evaluation programs for lowland sheep.
Acknowledgments
The funding from the Teagasc Walsh Scholarship is highly acknowledged.
This publication has emanated from research supported by a research grant from Science Foundation Ireland under the Grant 21/FFP-A/9148 (OviSeq).
Author Contributions
Numan Sharif (Formal analysis, Methodology, Writing - original draft, Writing - review & editing), Fiona McGovern (Conceptualization, Funding acquisition, Methodology, Resources, Supervision, Writing - review & editing), Noirin Mc Hugh (Conceptualization, Data curation, Funding acquisition, Methodology, Supervision, Writing - review & editing), Thierry Pabiou (Data curation, Resources, Writing - review & editing), and Donagh Berry (Formal analysis, Methodology, Supervision, Writing - original draft, Writing - review & editing)
Conflict of Interest statement
The authors have no conflicts of interest to disclose.
