


Abstract
Although performance benefits of monensin have been extensively studied in finishing cattle, growing cattle, and dairy cows, considerably less published work is available evaluating response to monensin supplementation in cow-calf production systems. This meta-analysis investigated the impacts of monensin on performance of beef cows and developing replacement heifers. The replacement heifer analysis was conducted using data from 18 different peer-reviewed publications and experiment station reports. The mature cow analysis included 21 different publications and experiment station reports. The metaphor package (version 2.4-0; Viechtbauer, 2010) for R (version 4.0.3; www.r-project.org) was used to determine the overall effect size of monensin compared to a negative control. Each study’s n, means, and SEM or P value was used to calculate the mean difference and estimate of within study variance for responses of interest. In replacement heifers, monensin treatment increased (P < 0.01); average daily gain (+0.03 ± 0.008 kg/d), feed efficiency (+0.013 ± 0.008 gain:feed), and percentage cycling before the breeding season (+15.9 ± 5.13%); while decreasing (P < 0.01): dry matter intake (0.293 ± 0.081 kg), and age at puberty (‐8.9 ± 1.48 d). Six studies reporting ad libitum forage intake for mature cows showed decreased (P = 0.008) DMI by 0.85 ± 0.32 kg/d. Six studies reported milk yield and revealed an increase (P = 0.01) of 0.39 ± 0.15 kg/d when cows were supplemented with monensin. Monensin supplementation resulted in a reduction (P = 0.02) in days to first estrus by 18 ± 8.2 d and percentage of cows exhibiting estrus prior to the breeding season was increased by 19 ± 8% (P = 0.03). There were no differences in artificial insemination pregnancy nor total pregnancy for either the heifer or mature cow data sets. This analysis indicates potential for use of monensin in heifer development and beef cow production systems. Further research is needed to elucidate the effects on reproductive efficiency, DMI, milk production, weight, and body composition change.
INTRODUCTION
Forage and supplemental feed costs remain the overriding factors driving profitability in U.S. cow/calf operations (Miller et al., 2002; Bowman et al., 2019). In a study evaluating yearly profitability of 81 cow/calf enterprises enrolled in the Kansas Farm Management Association from 2016 through 2020, feed, and pasture costs averaged 68% of variable costs, 56% of variable plus fixed costs, and 47% of variable, fixed, labor, and management costs (Pendell and Herbel, 2021). In this study, the most profitable one third of operations incurred 39% ($157.38) less feed cost per cow compared to the least profitable one third of operations. The difference in feed cost represented 67% of the total variable cost margin ($233.31) between high- and low-profitability operations (Pendell and Herbel, 2021). Assuming equal calf prices, differences in weaning rate (91.3 vs. 87.8%) and calf sale weights (624 vs. 597) accounted for $67.41 increased gross returns in the high-profitability group. Clearly, management practices with potential to reduce forage and (or) supplemental feed costs, improve weaning rate, and (or) increase calf weight simultaneously, could improve cow/calf enterprise profitability.
The monensin molecule was first discovered in 1967 (Agtarap et al., 1967) and approved by the Food and Drug Administration for use in finishing cattle diets in 1975, for replacement beef and dairy heifers in 1983, for beef cows in 1988, and for dairy cows in 2004. Monensin is a carboxylic polyether ionophore that selectively inhibits gram positive bacteria, increasing propionate production and reducing methane production (Appuhamy et al., 2013), thereby improving energetic efficiency (Fuller and Johnson, 1981; Schelling, 1984).
The use of monensin has been studied extensively in feedlot finishing (Goodrich et al., 1984; Duffield et al., 2012) and dairy systems (Duffield et al., 2008). Using a meta-analysis approach, Duffield et al. (2012) reported an overall improvement in feed efficiency in growing and finishing cattle of 6.4%, although the response declined in magnitude from 1975 to 2010. In a previous meta-analysis, Duffield et al. (2008) documented mean improvement in feed efficiency for milk production in dairy systems of 2.5%. In that study, monensin supplementation resulted in a greater increase in milk yield in pasture-managed dairy cows compared to cows managed in confinement. In contrast to the research available for finishing cattle and dairy systems, the body of literature available to assess the use of monensin to improve production efficiency in cow/calf and heifer development systems is limited (Sprott et al., 1988). Monensin has been reported to improve feed efficiency (McCartor et al., 1979; Purvis et al., 1996), hasten the onset of puberty in beef heifers (Moseley et al., 1977; McCartor et al., 1979; Moseley et al., 1982; Lalman et al., 1993), and reduce feed intake in beef cows (Lemenager et al., 1978). Together, these results suggest that monensin may improve beef production efficiency at the beef cow/calf enterprise level.
Meta-analysis is a statistical approach to combine responses among studies for establishing a generalized effect size. It improves statistical power where original research succumbs to too much variation to establish statistical significance for the response mean difference. Thus, the objective of this paper is to present a meta-analysis of the responses of beef replacement heifers and beef cows when supplemented with monensin to provide a basis for its utilization in these production systems and provide direction for avenues of future research.
MATERIALS AND METHODS
Because this report only used previously conducted research and published literature, no animals were used in this research and no animal care and use protocol was required.
Replacement Heifers
A literature search was conducted using PUBMED, Google Scholar, Journal of Animal Science, Translational Animal Science, Applied Animal Science, Animal Production Science, and searchable university research reports. Only data from experiments using diets and supplements that were similar between the negative control and monensin treatments were used in this analysis. Twelve peer-reviewed publications and six experiment station reports or extension publications (non-peer reviewed) were identified. References to each publication or report are provided in the Supplemental Materials document. These studies contained a minimum of supplementation-period body weight (BW) gain and one of the following reproductive measurements: age at puberty or percent pregnant after a limited breeding season. Three of the experiments used Holstein heifers while the remaining 15 studies used beef heifers. To be included, studies were required to include at least one 200 mg/d treatment and a negative control with no monensin. This parameter resulted in one treatment mean being excluded from the study of Baile et al. (1982) because this group received 600 mg/d supplemental monensin. In all studies, monensin supplementation occurred between weaning and the beginning of the first breeding season, with a minimum treatment period of 88 d and maximum of 450 d (Table 1). Due to early weaning of Holstein heifers, average supplementation period in the dairy heifer studies averaged 446 d compared to 184 d in studies using beef heifers. All feed intake data used in the analysis were from experiments using processed forage or mixed concentrate/forage diets and direct measurement techniques.
Variable means, standard deviation, minimum, and maximum for 18 publications evaluating the effects of monensin supplementation on replacement heifer production traits
| Variable | n | Mean | SD | Minimum | Maximum |
|---|---|---|---|---|---|
| Supplementation duration, d | 26 | 217 | 111 | 88 | 450 |
| Initial body weight, kg | 22 | 220.2 | 33.9 | 165 | 333 |
| Average daily gain, kg | 23 | 0.67 | 0.28 | 0.24 | 1.48 |
| Daily feed intake, kg | 16 | 6.63 | 1.0 | 3.83 | 8.02 |
| Gain/feed | 15 | 0.098 | 0.025 | 0.065 | 0.148 |
| Age at puberty, d | 19 | 416 | 42.0 | 336 | 514 |
| Weight at puberty, kg | 17 | 307 | 29 | 265 | 373 |
| Cycling prior to breeding, % | 13 | 53.2 | 26.4 | 5.0 | 92 |
| AI conception, % | 10 | 45.4 | 20.0 | 13.8 | 78.6 |
| Pregnancy, % | 23 | 80.6 | 15.5 | 47 | 100 |
Beef Cows
A literature search was conducted using PUBMED and Google Scholar search engines, Journal of Animal Science, Translational Animal Science, Applied Animal Science, Animal Production Science, and searchable university research reports. Only data from experiments using diets and supplements that were similar between the negative control and monensin treatments were used in this analysis. This search generated 21 publications reporting one or multiple experiments and 26 experimental mean comparisons. References to each publication or report are provided in the Supplemental Materials document. The dose of monensin ranged from 125 to 200 mg/d, which was supplied (Table 2) via hand-fed supplements for an average of 99 ± 24.8 d. Initial cow BW in the 26 comparisons was 457 ± 51.7 kg and ranged from 346 to 580. Initial body condition score (BCS) was reported in only 11 mean comparisons, averaging 5.7 ± 0.73 and ranging from 4.6 to 7.1. Dietary treatment with or without monensin occurred during variable stages of production: breeding season in two treatment mean comparisons, gestation in eight treatment mean comparisons, lactation in six treatment mean comparisons, and a portion of gestation extending into lactation in 10 treatment mean comparisons.
Variable means, standard deviation, minimum, and maximum for 21 publications with 26 experimental mean comparisons evaluating the effects of monensin supplementation on performance and reproduction of beef cows
| Variable | n | Mean | SD | Minimum | Maximum |
|---|---|---|---|---|---|
| Supplementation duration, d | 26 | 99 | 24.8 | 38 | 175 |
| Monensin dose, mg/day | 26 | 192 | 22.2 | 125 | 200 |
| Initial body weight, kg | 24 | 457 | 51.7 | 346 | 580 |
| Initial body condition score | 10 | 5.7 | 0.73 | 4.6 | 7.1 |
Statistical Methods
The metafor package (version 2.4-0; Viechtbauer, 2010) for R (version 4.0.3; www.r-project.org) was used to determine the overall effect size of monensin compared to a negative control by subtracting response mean for control animals from the response mean for the monensin-treated animals. The number of observations, mean, and standard error of the mean (SEM) or P value was used to calculate the mean difference and an estimate of within-study variance for responses of interest. The reciprocal of within-study variance was used for weighting contribution of each study to the overall estimate of effect size and variability. A random-effects model was chosen to account for both within-study and between-study heterogeneity of variance. The model was fit using restricted-maximum likelihood and maximum-likelihood estimation. Maximum likelihood was used if restricted-maximum likelihood estimation did not converge. Maximum likelihood was also used when testing the effect of study characteristics on effect size estimates. Study characteristics evaluated with the cow-calf dataset included stage of production (categorical) and study duration (continuous). Study characteristics were not evaluated for the heifer dataset (means model only). The influence of study characteristics on effect size was examined by comparing fit statistics between full (all characteristics included in the model) and reduced models (one or more study characteristics removed from the full model sequentially). Models were compared using analysis of variance with probability statistics calculated for the log-likelihood ratio. A final model was fit using restricted-maximum likelihood and either included study characteristics that influenced effect size at P ≤ 0.1, or the model was reduced to a means model (intercept only) when no study characteristics influenced effect size.
Three responses did not have enough studies providing sufficient information about within-study variability to perform a meta-analysis that included within-study variance: growing heifer dry matter intake (DMI), growing heifer feed conversion, and suckling calf average daily gain (ADG) for cows receiving monensin during lactation. For these three responses, treatment mean differences were analyzed with a linear model that included only the intercept (means model) with and without weights for the number of observations/treatment. The standard error for the mean (SEM) model only accounted for between-study variability. The number of observations per treatment was included as a potential weighting factor as studies with more replications would be expected to have a smaller SEM.
The effect size of continuous responses was modeled as a mean difference. Analysis of pregnancy data presented a challenge due to inconsistencies in whether data were analyzed using individual animal or group as the experimental unit. The replacement heifer data provided frequencies for number of heifers exhibiting estrus and pregnancy. Study counts were analyzed using the odd-ratio option of the metafor package. Count data was also re-calculated as proportions (p). The standard deviation for a proportion was calculated as the square root of P(1‐P). Pregnancy responses from the cow-calf dataset were analyzed as proportions.
Identified studies were inconsistent in reporting responses measured (e.g., ADG) and estimates of variability. For example, BW may have been reported as initial and final BW only, initial BW, and ADG, or initial BW and ADG. In some cases, SEM were not reported, but P values or P value thresholds were provided. To minimize study exclusion, missing continuous responses were calculated from available data (e.g., weight gain converted to ADG). For studies that did not report SEM for a continuous response variable, or a response was calculated from available data, an estimate of SEM was determined arithmetically from P values (Gadberry et al., 2015). When P value thresholds were provided, α = 0.05 was used for P < 0.05. When P value was reported as P > 0.05, SEM was substituted based on comparison to other studies with similar n and mean difference for the response being analyzed. When neither P value nor SEM were provided, first alternative was to use a substitute SEM based on other studies with similar n and mean difference, second alternative was to use the overall average SEM when the study had either similar n or mean difference as the other studies in the analysis. If a study could not meet any of these criteria for imputing a SEM, the study was excluded from the analysis. Imputing a SEM described by the first alternative would help avoid excluding studies without a statistically significant response. Imputing a SEM as a second alternative would permit a study’s mean difference to contribute to the overall effect size, its weight toward the overall mean would only come from its contribution to between-study variability but not within-study variability as within study variability would be equal to the overall average of within-study variances.
A dummy variable (“imputed”) was coded indicating which studies provided a SEM for the response (not imputed) and which studies had a calculated or substitute SEM (imputed). This variable was included in the model to determine whether including studies with imputed SEM had a significant effect on the overall effect size estimate. The model was also fit without an intercept to observe the SEM of the imputed and not imputed means. In general, including studies with calculated or substitute SEM did not significantly affect the effect size of a response, but the SEM of imputed studies would contribute to larger SEM compared to the non-imputed studies. Allowing these studies to contribute to the overall effect increases the number of studies contributing to the overall effect and helps reduce bias toward studies that provided less response detail, especially if the within-study response was not statistically significant.
Fitted models were assessed using provided fit statistics including test for residual heterogeneity, variance, test for study characteristics (i.e., test of moderators), and model results. The significance of model estimates was based on the normal distribution (z-value). Full and reduced models were compared as previously described. Standardized residual, funnel, and forest plots were examined to identify outliers. Using these tools, the response in a study would be removed from the analysis if there was sufficient evidence that the mean difference, variance, or study characteristics were unique to all other studies and inclusion appeared detrimental to interpretation of the overall effect size.
RESULTS
Replacement Heifers
Average daily gain
Twenty-three mean comparisons were available to evaluate the effects of monensin (200 mg/d) on ADG in replacement beef and dairy heifers (Table 1). One study was determined to be an outlier with monensin response equal to 0.36 kg/d. In addition, four experiments used a single pen or pasture for each treatment combined with group-feeding, resulting in n = 1. These studies were removed from the analysis resulting in 18 total mean comparisons to evaluate the effect of monensin supplementation on weight gain in replacement heifers (Figure 1). Retaining studies with imputed SEM did not significantly alter mean difference (P = 0.87) in the effect size. Overall monensin effect on heifer ADG was 0.03 ± 0.008 kg, a 5% increase in gain, which differed from zero (P = 0.0003).
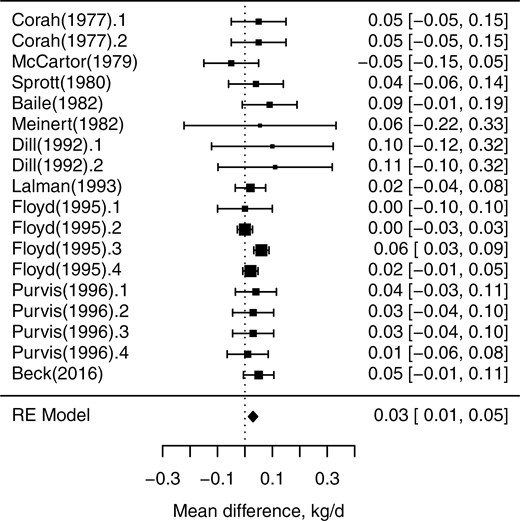
Forest plot of heifer average daily gain response to monensin supplementation. The x-axis shows standardized mean difference with the vertical dashed line representing mean difference = 0; each square represents the mean effect size for that study, and the size of the square reflects the relative weighting of the study to the overall effect size estimate with larger squares representing greater weight. The upper and lower limit of the line connected to the square represents the upper and lower 95% confidence interval for the effect size. The diamond at the bottom represents the 95% confidence interval for the overall estimate.
Dry matter intake
Sixteen mean comparisons were available to estimate the influence of monensin supplementation on feed DMI (Table 1). However, only five studies reported SEM or probabilities for mean differences. Rather than imputing SEM values for the remaining 11 comparisons, DMI was analyzed using a mixed model including ionophore treatment as a fixed effect and study as a random effect with studies weighted based on number of replications per treatment. According to this model, monensin supplementation resulted in 0.293 ± 0.081 kg/d reduction in DMI (P = 0.003) or 4.3%.
Feed efficiency
Fifteen comparisons reported gain:feed or the information necessary to calculate gain:feed (Table 1). However, only five of these studies reported SEM or mean difference probabilities. Therefore, the same linear mixed model described above was used and study effect size was weighted based on the number of replications per treatment. Resulting effect size was 0.013 ± 0.008 increase in gain:feed for monensin-treated heifers (P = 0.006), or a 14% improvement.
Age at puberty
Nineteen comparisons were available to determine the effect of monensin supplementation on age at puberty in replacement heifers (Table 1). All these experiments reported SEM, therefore a random effects model with REML was used. Between-study heterogeneity was not significant (P = 0.22). Monensin supplementation reduced age at puberty 8.9 ± 1.48 d and this effect size differed from zero (P < 0.0001; Figure 2).
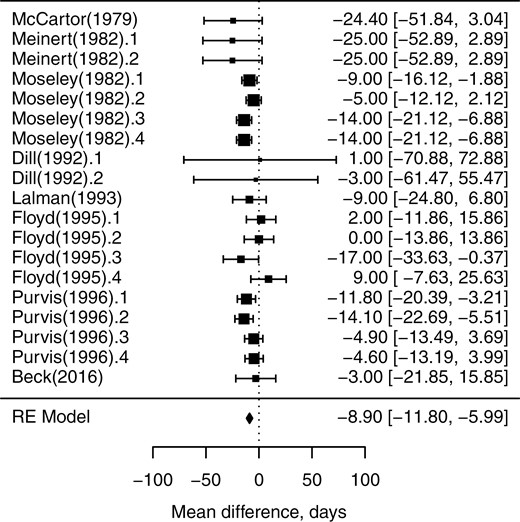
Forest plot of heifer age at puberty response to monensin supplementation. The x-axis shows standardized mean difference with the vertical dashed line representing mean difference = 0; each square represents the mean effect size for that study, and the size of the square reflects the relative weighting of the study to the overall effect size estimate with larger squares representing greater weight. The upper and lower limit of the line connected to the square represents the upper and lower 95% confidence interval for the effect size. The diamond at the bottom represents the 95% confidence interval for the overall estimate.
Weight at puberty
The forest plot for BW at puberty is shown in Figure 3. Seventeen mean comparisons were available with 14 reporting SEM (Table 1). When SEM was imputed for three studies, effect size was not significantly influenced (P = 0.48). Between study heterogeneity was significant (P = 0.0009). The resulting monensin supplementation effect size was ‐3.12 ± 2.66 kg BW and not different from zero (P = 0.24).
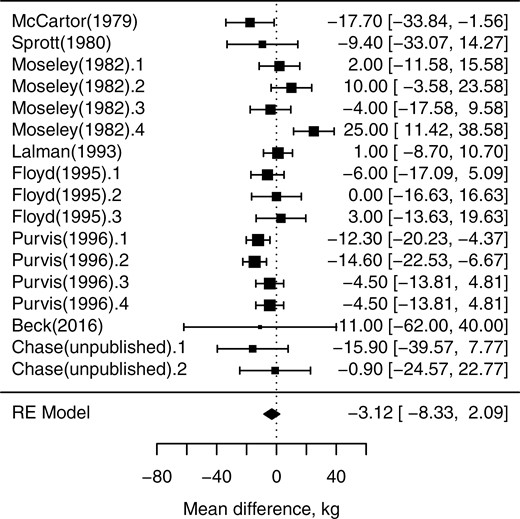
Forest plot of heifer weight at puberty response to monensin supplementation. The x-axis shows standardized mean difference with the vertical dashed line representing mean difference = 0; each square represents the mean effect size for that study, and the size of the square reflects the relative weighting of the study to the overall effect size estimate with larger squares representing greater weight. The upper and lower limit of the line connected to the square represents the upper and lower 95% confidence interval for the effect size. The diamond at the bottom represents the 95% confidence interval for the overall estimate.
Percent cycling prior to breeding season
Thirteen mean comparisons were available to investigate the effect size of monensin supplementation on percent heifers cycling prior to the beginning of the breeding season (Table 1). When tested for difference in log-odds ratio, between study heterogeneity was significant (P = 0.01) with effect size 0.82 ± 0.23 log-odd increase (P = 0.004). Similarly, when data were analyzed by proportion, between study heterogeneity was significant (P < 0.0001) and monensin supplementation mean response was 15.9 ± 5.13% more heifers cycling by the beginning of the breeding season (P = 0.002; Figure 4).
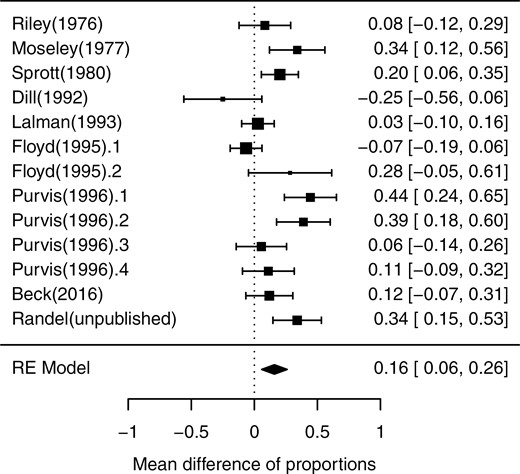
Forest plot of the difference in proportion of heifers cycling by the beginning of the breeding season response to monensin supplementation. The x-axis shows standardized mean difference with the vertical dashed line representing mean difference = 0; each square represents the mean effect size for that study, and the size of the square reflects the relative weighting of the study to the overall effect size estimate with larger squares representing greater weight. The upper and lower limit of the line connected to the square represents the upper and lower 95% confidence interval for the effect size. The diamond at the bottom represents the 95% confidence interval for the overall estimate.
Artificial insemination pregnancy
Ten mean comparisons provided proportion or count data related to the effect of monensin supplementation on artificial insemination (AI) pregnancy rate (Table 1). Between study heterogeneity was not significant for either the log-odds ratio technique or the proportion technique (P ≥ 0.40). Similarly, the effect size was not different from zero when expressed as log-odds ratio (0.03 ± 0.16; P = 0.84) or as a proportion (0.33 ± 3.24%; P = 0.92).
Overall pregnancy rate
Twenty-three mean comparisons were available to determine the effect size of monensin supplementation on overall pregnancy rate (Table 1). Between-study heterogeneity was not different regardless of the statistical method used (P ≥ 0.93). Using the log-odds ratio method, the effect size = 0.16 ± 0.13 and not different from zero (P = 0.22). In the proportion analysis, the effect size was 2.55 ± 2.07% and not different from zero (P = 0.22)
Mature Cow-Calf
Cow performance
The data set for cow BW included 24 mean comparisons, 12 studies reported both beginning and ending BW, 4 studies reported ADG or loss in kg/d, and 8 studies reported BW gain or loss over the duration of the experiment. One study was determined to be an outlier due to reported 1.27 kg/d weight change response to monensin supplementation. Average daily gain was converted to BW gain (or loss) and SEM were calculated using the P value and n. Gain (or loss) was calculated from end BW minus beginning BW and the end BW P value and n were used to impute SEM. If gain or ending BW P values were not available, the SEM were set to be equal to the average of known study SEM. A moderator effect test for the impact of stage of production on study effect size was conducted, stages of production were categorized as gestation only, gestation-lactation, and lactation only. Including the studies with imputed SEM did not significantly affect (P = 0.16) the effect size. Stage of production did not significantly influence the effect size among studies (P = 0.83). Neither study duration (P = 0.35) nor average beginning BCS (P = 0.97) contributed to the differences among studies for the effect size of cow BW change. Overall, cow BW change (Figure 5) was not affected (P = 0.43) by monensin.
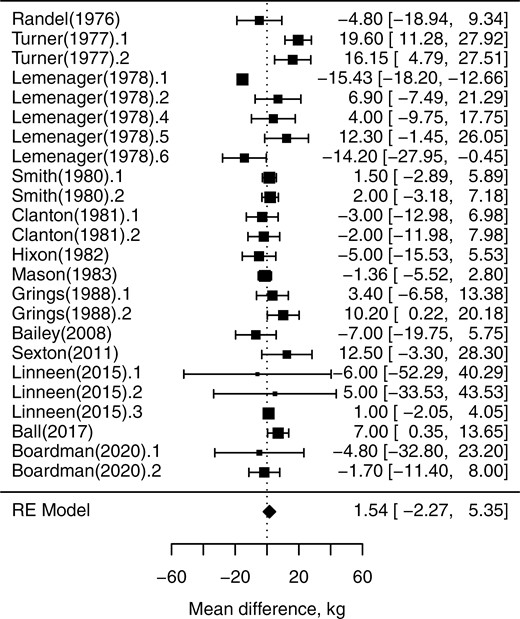
Forest plot for beef cow body weight change response to monensin supplementation. The x-axis shows standardized mean difference with the vertical dashed line representing mean difference = 0; each square represents the mean effect size for that study, and the size of the square reflects the relative weighting of the study to the overall effect size estimate with larger squares representing greater weight. The upper and lower limit of the line connected to the square represents the upper and lower 95% confidence interval for the effect size. The diamond at the bottom represents the 95% confidence interval for the overall estimate.
Body condition score
There were only 11 studies that reported BCS, four of these studies reported BCS change with the remainder reporting beginning and ending BCS. The mean difference for ending BCS was used for the analysis. Ending BCS was calculated as initial BCS + BCS change, and the SEM was based on either the ending BCS P value or the BCS change P value. One study was excluded from the analysis as an outlier, leaving 10 mean comparisons for the analysis. Including the studies with imputed SEM did not significantly affect (P = 0.53) the effect size. Average initial BCS, stage of production, and study duration were included in tests of moderators and did not have significant impacts (P ≥ 0.35) on effect size. As with cow BW change, change in BCS (Figure 6) was not significantly affected by monensin (P = 0.45).
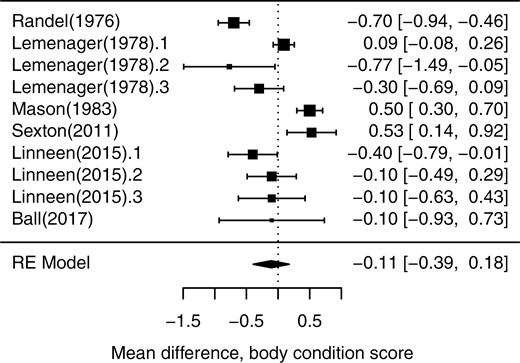
Forest plot for beef cow body condition score change response to monensin supplementation. The x-axis shows standardized mean difference with the vertical dashed line representing mean difference = 0; each square represents the mean effect size for that study, and the size of the square reflects the relative weighting of the study to the overall effect size estimate with larger squares representing greater weight. The upper and lower limit of the line connected to the square represents the upper and lower 95% confidence interval for the effect size. The diamond at the bottom represents the 95% confidence interval for the overall estimate.
Milk production
There were six mean comparisons available to determine effect size for milk production. Because of the limited number of studies, no tests of moderators were conducted, and the analysis was conducted as a random effects model of mean differences in early lactation milk yield. The mean difference increase (P = 0.01) in milk yield was 0.39 ± 0.15 kg/d due to monensin supplementation (Figure 7).
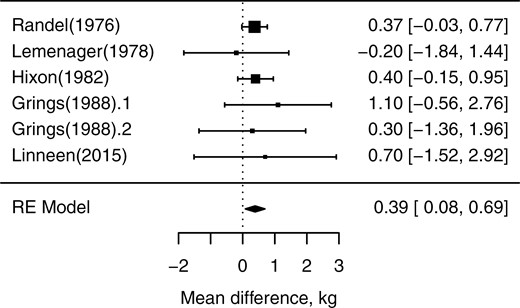
Forest plot for beef cow milk yield response to monensin supplementation. The x-axis shows standardized mean difference with the vertical dashed line representing mean difference = 0; each square represents the mean effect size for that study, and the size of the square reflects the relative weighting of the study to the overall effect size estimate with larger squares representing greater weight. The upper and lower limit of the line connected to the square represents the upper and lower 95% confidence interval for the effect size. The diamond at the bottom represents the 95% confidence interval for the overall estimate.
Dry matter intake
There were six mean comparisons that reported ad libitum grazed forage or hay intake. In two studies SEM and P values were not provided so the average of reported SEM was applied to those studies. For these six studies, monensin was provided separately from the forage in a daily supplement. Monensin decreased (P = 0.008) DMI by 0.85 ± 0.322 kg/d for the beef cows in these studies, which is about 8% reduction from the average DMI by control cows (Figure 8).
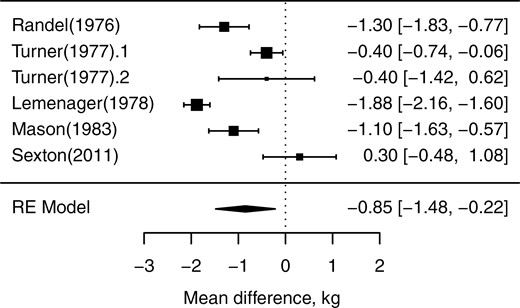
Forest plot for beef cow feed intake response to monensin supplementation. The x-axis shows standardized mean difference with the vertical dashed line representing mean difference = 0; each square represents the mean effect size for that study, and the size of the square reflects the relative weighting of the study to the overall effect size estimate with larger squares representing greater weight. The upper and lower limit of the line connected to the square represents the upper and lower 95% confidence interval for the effect size. The diamond at the bottom represents the 95% confidence interval for the overall estimate.
Reproduction
The effects of monensin on reproduction in beef cows were examined for studies providing monensin prior to breeding. Three mean comparisons reported the proportion of females exhibiting estrus before breeding. Monensin supplementation increased (P = 0.02) the proportion of cows exhibiting estrus by 0.19 ± 0.08 or by 19% units. Along with the increase in proportion of cows exhibiting estrus prior to the breeding season, the days to first estrus was reduced (P = 0.03) 18 ± 8.2 d by monensin in five studies. In mean comparisons reporting first service or AI pregnancy (n = 9) and overall pregnancy (n = 5) proportions, monensin had no effect (P ≥ 0.45).
Calf performance
There were limited studies (n = 5) that reported calf birth weight following the provision of monensin during gestation. Figure 9 shows the forest plot of the effect of monensin on calf birthweight. Monensin increased calf birthweight by 2.4 ± 0.91 kg (P = 0.01). Fifteen mean comparisons reporting calf gain or average daily gain pre-weaning were variable and inconsistent in reporting of P values and SEM, so missing SEM could not be imputed with confidence. Therefore, calf performance pre-weaning was analyzed as a simple linear model that does not account for within study variability. This analysis shows no difference (P = 0.55) in preweaning calf performance due to monensin supplied to the dam.
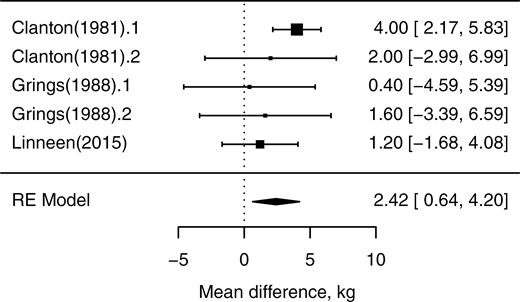
Forest plot for calf birth weight response to monensin supplementation. The x-axis shows standardized mean difference with the vertical dashed line representing mean difference = 0; each square represents the mean effect size for that study, and the size of the square reflects the relative weighting of the study to the overall effect size estimate with larger squares representing greater weight. The upper and lower limit of the line connected to the square represents the upper and lower 95% confidence interval for the effect size. The diamond at the bottom represents the 95% confidence interval for the overall estimate.
DISCUSSION
Improved ADG response to monensin supplementation averaged five percent (0.03 kg/d) in replacement heifers compared to the 11% improvement in growing stocker calf ADG (0.078) reported in a companion meta-analysis (Gadberry, 2022). An explanation for lower ADG response in replacement heifers is difficult because ADG for control cattle (no monensin supplement) in both data sets was similar (0.67 kg/d for replacement heifers vs 0.72 kg/d for growing stocker calves). Similar ADG suggests that mean diet nutritive value was also similar. Gadberry (2022) determined that increasing study period length in growing stocker calves had a negative influence on ADG response to monensin. The mean study period for the replacement heifer data was 217 ± 111 d compared to 113 ± 51 d for the growing calf data set. Therefore, it is possible that declining response to monensin over time could be a factor in the difference in response between these two studies.
Even though heifers were managed for moderate rate of gain, monensin supplementation resulted in reduced feed intake (4.3%) and improved feed efficiency (14%), which is greater than the 6.4% improvement in feed efficiency for growing and finishing cattle reported by Duffield et al. (2012) in an extensive meta-analysis. This may be due to larger improvements in gain (5%) by growing replacement heifers vs. finishing cattle (2.5%) and 4.3% reduction in DMI for replacement heifers vs. 3% DMI reduction for finishing cattle reported by Duffield et al. (2012).
Limited data suggests decreased DMI and no change in BW or BCS for beef cows supplemented with monensin. Feed intake was reduced by 0.85 kg/d or 7.8%. This is greater than the 0.3 kg/d (2.3%) reduction in DM intake reported by Duffield et al. (2008) in dairy cows and the 3% DMI reduction reported by Duffield et al. (2012) in finishing cattle. Perhaps monensin has a greater impact on DMI in lower energy diets. Alternatively, it is possible that the effect size for feed intake is inflated in the current analysis simply due to random error and insufficient observations. For example, 53 mean comparisons were available in the Duffield et al. (2008) publication, whereas only six mean comparisons were available for the current study. Interestingly, in the meta-analysis for lactating dairy cows (Duffield et al., 2008), BW change increased (P < 0.001) by 0.06 kg/d when cows were supplemented with monensin, in contrast with no change documented in the current work with beef cows. Again, this is not surprising because our analysis included only 24 mean comparisons from 13 publications using data from studies conducted during both non-lactating and lactating stages of production compared to 33 publications with 84 mean comparisons and involving 2,471 lactating dairy cows in the work of Duffield et al., 2008.
These results suggest an increase in dietary energy concentration when monensin is fed to beef cows. Additionally, the increase in calf birthweight (P = 0.01), with only five comparisons available, suggests that beef cows supplemented with monensin have greater energy availability from the same basal diet fed to control cows.
The Nutrient Requirements of Beef Cattle publication (NASEM, 2016) recommends an increase of 2.3% diet metabolizable energy (ME) when monensin is fed. To estimate the impact of monensin on diet ME for beef cows, the Beef Cattle Nutrient Requirements Model (BCNRM; NASEM, 2016) was used. Model inputs included mean values taken from four experiments providing BW, BW gain, and feed intake data for gestating beef cows (Turner et al., 1977; Lemenager et al., 1978; Sexten et al., 2011). Mean BW (465 kg), DMI (10.6 kg/d), and BW gain (0.26 kg/d) for control-fed cows was used to estimate mean feed ME concentration (1.85 Mcal ME/kg DM). Subsequently, feed DMI was reduced by 7.8% and diet ME adjusted until ADG was equal to 0.26 kg/d. This calculation resulted in an increase in diet ME of 4.7% (1.94 Mcal ME/kg DM). Other possible mechanisms for similar performance concurrent with reduced feed intake were suggested by Byers (1980). In silage-fed growing cattle supplemented with monensin, Byers (1980) reported that either efficiency of energy utilization for maintenance was improved, or maintenance energy requirements were reduced. In their study, efficiency of energy use for maintenance was improved (5.7%) or maintenance energy requirement was reduced (5.4%). This is about the same proportion as the estimate of ME increase based on the BCRNRM and inputs from these four experiments.
With the exception of the Sexten (2011) study, the remaining studies measuring effect size for feed intake in beef cows were published in 1983 and earlier. In the meta-analysis of Duffield et al. (2012) it was determined that the effect size for feed efficiency measured in 85 experiments conducted in the 1970’s had declined by 27% when compared to means generated from 11 experiments conducted between 2001 and 2010. It is unclear whether this decline in monensin effect size was due to improved cattle genetics for ADG and feed efficiency, changes in diet composition, or other management changes over time. Because the data for beef cow feed intake and performance is both limited and dated, more research is necessary to determine feed intake and BW gain response in modern beef cows supplemented with monensin.
Even though only six mean comparisons were available, milk yield was increased (P = 0.01) by 0.39 kg/d or 5.4% when beef cows were supplemented with monensin. This compares to 0.7 kg/d increase in milk yield (2.3%) when dairy cows were supplemented with monensin as reported by Duffield et al. (2008). Additionally, the response in milk production was more pronounced (0.19 kg/d) in dairy cows with access to pasture compared to dairy cows managed in confinement. These results suggest that monensin may improve the efficiency of milk production in beef cows, although only one experiment was available providing milk yield and feed intake measurements (Randel and Rouquette, 1976).
In developing replacement heifers, age at puberty was reduced although weight at puberty was not affected by monensin supplementation. The mechanism by which monensin influences age at puberty remains elusive. Bushmich et al. (1980) demonstrated greater ovarian responsiveness to exogenous gonadotropin stimulation when heifers were fed monensin. Similarly, when prepubertal heifers were supplemented with monensin, pituitary responsiveness to both estradiol and gonadotropin releasing hormone was improved (Randel et al., 1980; Randel and Rhodes, 1980a, 1980b). McCartor et al. (1979) concluded that feeding management resulting in increased ruminal propionate production was responsible for reduced age at puberty in heifers fed monensin or increased dietary concentrate treatments. However, when supplemental propionate was fed directly and dietary energy was controlled to achieve similar weight gain across treatments, heifers fed propionate did not achieve puberty at an earlier age, while monensin-fed heifers did (Lalman et al., 1993).
Weight at puberty would not be expected to be substantially different if monensin causes slightly greater ADG and reduces the number of days required to reach puberty. Similarly, monensin supplementation results in a greater proportion of replacement heifers experiencing their first estrus cycle prior to the beginning of the breeding season. This was comparable to the analysis of mature cow data where the percentage of cows exhibiting estrus before the breeding season was increased with monensin and the anestrus period was shortened by 18 days. No differences in AI pregnancy nor overall pregnancy rates were found with either mature cows or growing replacement heifers.
CONCLUSIONS
Compared to finishing cattle and dairy cows, data documenting the effects of supplementing monensin on production of replacement beef heifers and beef cows is limited. Particularly in the case of beef cows, published experimental designs are inconsistent, leading to scarce mean comparisons to evaluate its effect on most production traits of interest. Nevertheless, performance and feed efficiency were improved in growing replacement heifers fed monensin. Similarly, limited data suggests that diet energy concentration is improved when beef cows are supplemented with monensin because feed intake is reduced, BW and BCS is unchanged, while calf birthweight, and milk yield are increased. Finally, monensin supplementation reduces age at puberty and increases the percentage of cows and heifers cycling prior to the beginning of the breeding season. Additional research is necessary to quantify monensin’s role in improving efficiency of modern cow/calf production systems and the beef industry’s carbon footprint.
Acknowledgments
This research is a contribution from the Oklahoma Agricultural Experiment Station, Arkansas Agricultural Experiment Station, and Elanco Animal Health. Partial funding of this project was provided by the Dennis and Marta White Endowed Chair in Animal Science and the Howard and Adene Harrington Endowed Chair in Animal Science.
Conflict of interest statement
This research was sponsored by Elanco Animal Health. Co-authors Sara Linneen and Frank White are employed by Elanco Animal Health. The other authors have no conflicts of interest.
