


Abstract
One hundred twenty individually fed steers (initial BW 283 kg ± 32) were utilized in an 84-d growing trial to evaluate the effects of increased metabolizable lysine from non-enzymatically browned soybean meal (SoyPass) in grass hay-based diets containing wet distillers grains plus solubles (WDGS). The treatments were arranged as a 2 × 3 factorial with two levels of protein supplement as 20% (low; DL20) or 35% (high; DL35) of dietary DM using WDGS as the basal protein source, and three increments of SoyPass (SP) replacing 0%, 30%, or 60% of the WDGS DM in the protein supplement yielding six dietary treatments. Average daily gain (ADG), dry matter intake (DMI), gain:feed (G:F), and plasma urea N (PUN) data were analyzed using the MIXED procedure of SAS as a 2 × 3 factorial. Animal was the experimental unit and fixed effects included body weight block, dietary inclusion of distillers grains (DL20, DL35), dietary inclusion of SoyPass (SP) (3 levels), and DL × SP inclusion interactions. Linear and quadratic interactions between DL and SP inclusion were analyzed using covariate regression. No interactions were detected for ADG between SP and DL (P = 0.76). Additionally, SP had no effect on ADG (P = 0.49). However, ADG was increased for steers consuming the DL35 diet compared to DL20 (1.13 vs. 0.86 kg/d, respectively; P < 0.01). A DL × SP interaction was detected for DMI (P = 0.01). As SP replaced WDGS in the DL35 diet, DMI increased linearly from 8.10 to 8.93 kg/d (P = 0.02). In the DL20 diet, DMI was not different as SP replaced WDGS (P ≥ 0.11). Therefore, G:F tended to decrease linearly (P = 0.06) as SP replaced WDGS in the DL35 diet, while no difference (P ≥ 0.11) was detected in the DL20 diet, suggesting SP contained less energy than WDGS but did improve dietary lysine balance. Furthermore, plasma urea nitrogen (PUN) increased linearly as SP replaced WDGS in the DL20 diet (P < 0.01) but was not affected by SP substitution in the DL35 diet (P ≥ 0.19). When WDGS is fed at a low (20% DM) or high (35% DM) inclusion rate in a forage-based diet, replacing the distillers with a source of protected amino acids supplied through heat-treated soybean meal, did not improve performance. A more concentrated or energy-dense form of amino acids may be beneficial in forage-based growing cattle diets containing 20% distillers grains but is not needed in diets with 35% distillers grains.
INTRODUCTION
Most calves born in the United States spend some time in a forage-based growing system prior to feedlot entry. Peel (2003) reported that depending on the time of year, stocker cattle represent 12% to 18% of total cattle inventory. Crude protein (CP) content of forages can vary greatly but the majority is rumen degradable protein (RDP), resulting in microbial crude protein (MCP) making up a large percentage of total metabolizable protein (MP) supply (Buckner et al., 2013). The supply of methionine and lysine, two essential amino acids, can be limited when relying primarily on MCP (Storm and Ørskov et al., 1984; Sok et al., 2017). However, Peel (2003) also reported these calves are often supplemented with 0.45 to 1.14 kg/d of a 25% to 40% CP supplement depending on forage quality and desired rate of gain.
With the passage of the Clean Air Act in 1990, ethanol production, particularly in the Midwest, expanded greatly (Abebe, 2008), which resulted in an increased supply of the by-product distillers grains made from corn. Corn distillers grains have been an economical supply of supplemental energy and protein for growing cattle in the Midwest US. The CP content of distillers grains is approximately 30% dry matter (DM) and of that 63% is rumen undegradable (RUP; Castillo-Lopez et al., 2013). Supplementing distillers grains has been shown to improve gains in growing cattle grazing dormant forages (Jenkins et al., 2009; Gillespie-Lewis et al., 2016) as well as growing forages (Martinez-Perez et al., 2013; Watson et al., 2015; Larson et al., 2019). However, while corn and corn milling by-products are a good source of methionine, they are low in lysine (NRC, 1996).
Conversely, soybean meal (SBM) is low in methionine but high in lysine (NRC, 1996). However, while SBM is 46% to 52% CP, the protein is 70% RDP and metabolized by the rumen microbial community, decreasing the direct contribution of amino acids to MP supply for the animal. Providing a non-enzymatically browned SBM (SoyPass; LignoTech USA) could improve amino acid supply to the animal because during the process of heating and in the presence of xylose, the amino acids become less available to rumen microorganisms through maillard reactions (Cleale et al., 1987) but are still available to the animal (98% RUP digestibility; Schumacher et al., 2020).
Therefore, the hypothesis of this research was that when corn distillers grains are fed at a low level (20% of the dry matter intake, DMI), substituting SoyPass for a portion of the distillers grains would improve cattle performance by increasing the intestinal supply of needed amino acids while greater levels of distillers grains (35% of DM) would increase ADG, but meet amino acid requirements. The objective of this research was to evaluate the performance of cattle fed three levels of SoyPass in a forage-based diet when supplemented 20% (low) or 35% (high) of DMI corn distillers grains.
MATERIALS AND METHODS
The procedures used in this experiment were approved by the University of Nebraska – Lincoln Institutional Animal Care and Use Committee (protocol #1785) which comply with the Guide for the Care and Use of Laboratory Animals (NRC, 2011) and are accredited by AAALAC International.
Experimental Design
One hundred twenty crossbred steers [initial body weight (BW) = 283 kg ± 32] were utilized in an 84-d individual feeding study to evaluate the effects of increasing amounts of SoyPass in forage-based diets containing wet corn distillers grains with solubles (WDGS) on performance and plasma urea nitrogen (PUN). The growing study was conducted at the University of Nebraska Eastern Research and Extension Center located near Mead, NE. Upon arrival in October of 2017, cattle were vaccinated against common respiratory and clostridial diseases (Ultrabac 7/somnus, Zoetis Inc., New York, NY; Bovi-Shield GOLD 5, Zoetis Inc.). Additionally, all cattle were injected with 1% wt/vol doramectin (10 mg doramectin/mL, Decotmax, Zoetis Inc.) and orally drenched with 15 mL of fenbendazole solution (100 mg fenbendazole/mL, Safe-guard, Merck Animal Health, Shawnee Mission, KS) to control external and internal parasites. Animals were revaccinated 21-d later against common respiratory diseases (Bovi-Shield GOLD ONE SHOT, Zoetis Inc.).
Between receiving and revaccination, cattle grazed smooth bromegrass pasture as one group. Immediately following revaccination, cattle were divided into two blocks based on BW and the study was initiated for block one (60 head, light block, initial BW = 264 ± 14 kg). Cattle assigned to block two (60 head, heavy block, initial BW = 302 ± 34 kg) grazed cornstalks for approximately 120-d. All cattle grazing cornstalks were supplemented 2.3 kg/animal daily Sweet Bran (Cargill Corn Milling, Blair, NE) until study initiation. Amino acid requirements may be impacted by both BW and age, making the interaction between body weight block and treatment of interest.
Before each block received treatments and after 2 weeks of training in the Calan gate system (American Calan Inc., Northwood, NH), cattle were individually limit-fed a diet consisting of 47.5% alfalfa hay, 47.5% Sweet Bran, and 5.0% supplement (DM basis) offered at 2.0% of BW for 5 d consecutively and then weighed over a 3-d period (Watson et al., 2013). The 3-d weight data were then averaged for each steer to determine initial BW. Immediately following the third day of weighing (d 0) cattle were implanted with 200 mg progesterone and 20 mg estradiol benzoate (Synovex S, Zoetis Inc.) and offered experimental treatments individually utilizing the same Calan gate system. Following d 84 of the experiment, the same limit-feeding and weighing schedule was utilized as described for determining initial BW. Ending BW was calculated by subtracting 0.45 kg for each limit-fed day from the average BW measured over the 3-d weighing period to account for the additional growth while being limit-fed beyond the duration of the study.
Orts were removed from the individual bunks weekly, and a subsample was collected (0.5 kg). The subsample was oven-dried at 60 °C for 48 h to determine DM (AOAC International, 1999; method 4.2.03). Dietary DM was determined weekly by sampling ingredients and following the same procedure for drying listed above to accurately measure DMI. Dried weekly samples of ingredients were composited by month. Composites were used to analyze neutral detergent fiber with the addition of 0.5 g of sodium sulfite (Van Soest et al., 1991; Mertens et al., 2002) and CP (LECO Corp., St. Joeseph, MI; AOAC International, 1999; method 990.03) content for each month of the study. The hay was ground to pass through a 1 mm screen using a Wiley Mill grinder. Ash content was estimated using a 600 °C muffle furnace for 6 h (AOAC International, 1999; method 4.1.10) and the estimate was subsequently used to calculate organic matter content. Additionally, a subsample from each monthly sample was collected, composited, and sent to a commercial lab for amino acid content analysis (Ward Laboratories Inc., Kearney, NE). Diets fed to cattle mixed well and cattle were not observed to sort or selectively eat any component of the diet. Using WDGS instead of modified or dry DGS added moisture to the diet and reduced sorting challenges.
The treatments were arranged as a 2 × 3 factorial with two levels of WDGS as 20% (low; DL20) or 35% (high; DL35) of dietary DM using WDGS as the basal protein source, and three increments of SoyPass (SP) replacing 0%, 30%, or 60% of the WDGS DM in the protein supplement yielding six dietary treatments (Table 1). Preliminary data modeling (NASEM, 2016) showed that while MP requirements were met for all treatment diets, there were lysine deficiencies for both DL20 and DL35 diets with no SP and the DL20 diet with SP replacing 30% of the WDGS. All cattle were fed once daily at 0700 h. Animals were blocked by BW as described above (heavy and light), stratified by BW within each block, and dietary treatment assigned randomly to strata within each block. Treatments (20 hd/treatment) and blocks (60 hd/block) contained an equal number of steers. DMI, average daily gain (ADG), and feed efficiency (reported as gain-to-feed; G:F) were calculated using DMI and animal weight data between d 0 and d 84 of the study.
Experimental diets and nutrient composition
| Low level WDGS (20%) | High level WDGS (35%) | |||||
|---|---|---|---|---|---|---|
| SoyPass replacing WDGS DM, % | SoyPass replacing WDGS DM, % | |||||
| Item | 0 | 30 | 60 | 0 | 30 | 60 |
| Ingredient, % DM | ||||||
| Brome hay | 77 | 77 | 77 | 62 | 62 | 62 |
| WDGS | 20 | 14 | 8 | 35 | 25 | 15 |
| SoyPass1 | 0 | 6 | 12 | 0 | 10 | 20 |
| Supplement2 | 3 | 3 | 3 | 3 | 3 | 3 |
| Nutrient Content, % DM | ||||||
| OM | 90.8 | 90.7 | 90.6 | 91.4 | 91.2 | 91.1 |
| Neutral detergent fiber | 57.2 | 57.0 | 56.8 | 52.1 | 51.8 | 51.4 |
| CP | 12.7 | 13.8 | 14.9 | 16.1 | 17.9 | 19.7 |
| RUP | 4.6 | 5.7 | 6.7 | 7.4 | 9.1 | 10.9 |
| RDP | 8.1 | 8.1 | 8.2 | 8.7 | 8.8 | 8.8 |
| Lysine3 | 0.419 | 0.502 | 0.585 | 0.545 | 0.684 | 0.823 |
| Metabolizable lysine | 0.047 | 0.059 | 0.072 | 0.094 | 0.126 | 0.160 |
| Rumen available TDN4 | 54.7 | 56.8 | 57.1 | 53.5 | 54.9 | 56.2 |
| Total TDN5 | 63.1 | 61.6 | 60.1 | 71.5 | 69.0 | 66.5 |
| ME, Mcal/kg6 | 2.28 | 2.22 | 2.17 | 2.58 | 2.49 | 2.40 |
| NEm, Mcal/kg6 | 1.41 | 1.36 | 1.31 | 1.68 | 1.60 | 1.52 |
| NEg, Mcal/kg6 | 0.82 | 0.78 | 0.74 | 1.06 | 0.99 | 0.92 |
1LignoTech USA, Rothschild, WI.
2Supplement formulated to provide 1.646% fine ground corn, 1.005% limestone, 0.075% salt, 0.225% tallow, 0.038% beef trace mineral (6% Zn, 5.0% Fe, 4.0% Mn, 2.00% Cu, 0.29% Mg, 0.2% I, and 0.05% Co), and 0.011% vitamin A-D-E in a premix containing 30,000 IU of Vitamin A, 6,000 IU of Vitamin D, 7.5 IU of Vitamin E per gram.
3Dietary lysine calculated from AA analysis of individual ingredients.
4Rumen available total digestible nutrients (TDN) values used to model microbial crude protein flow. Rumen available TDN for WDGS assumed to be 60% and other feeds matched NASEM (2016) values.
5TDN values used for performance (daily gain) calculations. TDN of WDGS assigned as 108% due to bypass protein and fat contributions to TDN that are not rumen available. All other ingredients had 1 value used for both TDN and rumen available TDN.
6Metabolizable energy (ME) calculated as 0.82 × Digestible Energy (DE) and 1 kg TDN = 4.4 Mcal DE (NASEM, 2016). Net Energy values (NEm and NEg) calculated from ME using equations 3–10 and 3–11 (NASEM, 2016).
Analysis of PUN
On experiment d 43 for the heavy block, and d 41 for the light block; 14 mL of whole blood were collected in two (7 mL/tube) Vacuette tubes containing K2-EDTA (Greiner Bio-One North America Inc., Monroe, NC) via jugular venipuncture using a 1.25 mm × 38 mm drawing needle (Greiner Bio-One North America Inc.) and bleeding hub. Samples were collected, placed on ice, and transported for laboratory analysis. In the lab, and on the same day they were collected, samples were centrifuged at 5,000 × g for 20 min and 2 mL of plasma removed and frozen at −80 °C until analysis. At the time of analysis, samples were thawed, vortexed, and 20 μL of sample or standard added to a prelabeled test tube (two for each animal) containing 20 μL of distilled water. Then, 500 μL of a urease solution was added to each tube followed by incubation in a 37 °C water bath for 10 min. Following incubation samples were derivatized and analyzed using a spectrometer following the procedures of Broderick and Kang (1980) and Chaney and Marbach (1962).
Metabolizable Lysine Balance and Performance Modeling
Metabolizable lysine supplied and required under the varying dietary conditions and animal performance parameters were modeled (NASEM, 2016). Inputs to the model included measured DMI and ADG of calves, on a treatment average basis. Several assumptions were made for the microbial contribution of metabolizable lysine. The contribution of WDGS to ruminally available organic matter to predict MCP was assumed to be 60% total digestible nutrients (TDN) (DM basis). This is because the 108% TDN value assigned to WDGS based on animal performance (Loy et al., 2008) also accounts for rumen-protected fat and RUP content which is available at the tissue level and therefore would result in overestimating potentially fermentable nutrients. The microbial efficiency in the model was assumed to be 13% of TDN intake. The assumed TDN concentration for brome hay, SoyPass, and fine ground corn in the supplement were 52%, 83%, and 88% of ingredient DM. MCP flow was assumed to be 80% true protein and 80% of the true protein digestible (Storm et al., 1983). MCP was assumed to be of 85% bacterial and 15% protozoal origin based on Castillo-Lopez et al. (2013). Lysine was assumed to represent 7.58% of total amino acids in bacteria and 10.78% in protozoa (Sok et al., 2017). The lysine content of brome hay, SoyPass, WDGS, and the fine ground corn in the supplement was 0.24%, 2.47%, 1.08%, and 0.28% of DM, respectively. The animals’ metabolizable lysine requirements were estimated for each treatment based on their MP requirement calculated using measured performance and NASEM (2016). The proportion of lysine in tissue was assumed as 7% of protein (NRC, 1996). Therefore, the metabolizable lysine requirement was calculated as 7% of the modeled MP requirement. For performance modeling, the TDN value of WDGS was assumed to be 108% of DM (Loy et al., 2008), while the TDN of the SoyPass, bromegrass hay, and fine ground corn were the same as for metabolizable lysine modeling.
Statistical Analysis
ADG, DMI, G:F, and PUN data were analyzed using the MIXED procedure of SAS as a 2 × 3 factorial. Fixed effects in the statistical model included body weight block, dietary inclusion of distillers grains (DL20, DL35), dietary inclusion of SoyPass (SP) (3 levels), and DL × SP inclusion interactions. There were no significant 2 or 3-way interactions between body weight block and treatment (P ≥ 0.20); therefore, the interaction term was removed from the model. Linear and quadratic interactions between DL and SP inclusion were analyzed using covariate regression in the MIXED procedure of SAS with dietary SoyPass as the covariate in the model. The least square means for fixed effects were separated at P < 0.05 using Fisher’s Protected LSD test.
RESULTS AND DISCUSSION
Cattle Performance
Body weight block did affect cattle performance with heavier cattle at trial initiation eating more (P < 0.01), gaining more (P < 0.01), and being more efficient (G:F of 0.103 and 0.138; P < 0.01). There were no DL × SP interactions detected for ending BW or ADG (P > 0.76). Ending BW and ADG were greater for steers consuming DL35 diets compared with DL20 (P < 0.01) (Table 2). This gain response to additional distillers grains in forage-based diets was expected and is well documented in the literature (MacDonald et al., 2007; Jenkins et al., 2009; Martinez-Perez et al., 2013). Adding SP in the diet had no effect on ending BW or ADG (P > 0.49). This is in contrast to results reported by Montano et al. (2019) where lightweight (128 kg) Holstein steers exhibited a positive linear gain response to increasing protected lysine when fed a forage-based diet with 25% distillers grains (DM basis). Additionally, Brazle and Stokka (1997) reported increased gain when lightweight (133 kg) beef calves were provided protected lysine and methionine in a receiving diet. However, when Holstein steers (183 kg) were fed a whole shelled corn-based diet with unheated SBM as a protein source and provided rumen-protected lysine, no growth response was detected due to the increasing levels of protected lysine (Hussein and Berger, 1995).
Effects of dietary protein supplement inclusion and SoyPass on performance and plasma urea nitrogen of growing steers
| Low level WDGS (20% DM) | High level WDGS (35% DM) | |||||||||||||
|---|---|---|---|---|---|---|---|---|---|---|---|---|---|---|
| SoyPass replacing WDGS DM, % | SoyPass replacing WDGS DM, % | P-value1 | ||||||||||||
| Item | 0 | 30 | 60 | Lin2 | Quad2 | 0 | 30 | 60 | Lin2 | Quad2 | SEM | INT | DL | SP |
| No. obs | 20 | 20 | 20 | 20 | 20 | 20 | ||||||||
| Initial BW, kg | 283 | 283 | 282 | 0.91 | 0.91 | 284 | 282 | 282 | 0.95 | 0.91 | 5.9 | 0.98 | 0.97 | 0.99 |
| Ending BW, kg | 357 | 353 | 355 | 0.85 | 0.83 | 380 | 377 | 376 | 0.82 | 0.92 | 6.4 | 0.99 | <0.01 | 0.84 |
| Dry matter intake, kg/d | 8.1 | 8.4 | 7.7 | 0.30 | 0.11 | 8.1 | 8.4 | 8.9 | 0.02 | 0.80 | 0.21 | 0.01 | 0.01 | 0.30 |
| Average daily gain, kg | 0.89 | 0.83 | 0.87 | 0.78 | 0.50 | 1.14 | 1.13 | 1.12 | 0.76 | 0.94 | 0.03 | 0.76 | <0.01 | 0.49 |
| Gain:feed | 0.110 | 0.098 | 0.113 | 0.73 | 0.11 | 0.143 | 0.135 | 0.125 | 0.06 | 0.84 | 0.01 | 0.03 | <0.01 | 0.17 |
| PUN, mg/dL3 | 13.4 | 14.1 | 16.7 | <0.01 | 0.26 | 18.8 | 20.3 | 19.9 | 0.22 | 0.19 | 0.64 | 0.04 | <0.01 | <0.01 |
1Effects of distillers level (DL), SoyPass level (SP), and DL × SP interaction (INT).
2Linear and quadratic responses to SoyPass inclusion using covariate regression.
3Plasma urea nitrogen.
A DL × SP interaction was detected for DMI (Table 2; P = 0.01). For steers consuming the DL35, DMI increased linearly as SP inclusion increased (P = 0.02). Conversely, DMI was not different (P = 0.30) as SP replaced DL in the DL20 diets. DMI was greater (P < 0.01; Table 2) for DL35 compared with DL20 which is likely a function of the lower neutral detergent fiber (NDF) in DL35 (Table 1). French et al. (2010) reported no difference in DMI when protected lysine was added to lactating dairy cow diets containing distillers grains. Montano et al. (2019) also reported no difference in DMI when protected lysine was added to growing calf diets containing 25% distillers grains (DM basis). Feed intake is controlled by both gut fill or distension and chemostatic or energy feedback. As SP replaced WDGS in the DL20 diets, DMI and energy intake decreased. The DL20 diets had greater NDF content and lower NDF digestibility compared to the DL35 diets. As SP replaced WDGS in the DL35 diets, energy concentration decreased and DMI increased. It is possible that intake regulation was being driven primarily by gut fill for the DL20 diets, while chemostatic regulation played a bigger role for the DL35 diets.
An interaction was also detected for G:F (P = 0.03). Feed efficiency tended to decrease linearly (linear, P = 0.06) as SP increased in the DL35 diet; however, G:F was not different due to SP inclusion in the DL20 diet (P ≥ 0.11). The cattle receiving the DL35 diets had greater G:F than cattle receiving the DL20 diets (P < 0.01). Conversely, when Montano et al. (2019) fed increasing levels of a commercial source of protected lysine and methionine in diets containing 25% corn distillers grains, they reported an increase in G:F. Hussein and Berger (1995) reported no difference in G:F when protected lysine and methionine were supplemented in diets where the source of protein was unheated SBM. It is likely the response in the current study is a function of energy in the diets. As SP replaced WDGS, energy concentration of the diets decreased (Table 1).
Plasma Urea Nitrogen
A DL × SP interaction was detected for PUN (Table 2; P = 0.04). As SP replaced WDGS in the DL20 diet, PUN increased linearly (P < 0.01) and was not statistically different regardless of the amount of SP in the DL35 diet (P ≥ 0.19). Lee et al. (2012) reported PUN levels were lower for an MP deficient diet when a protected source of lysine and methionine was added compared with a diet formulated to be adequate in MP when fed to lactating dairy cows. However, plasma lysine concentration was not different between the two treatments. Like the current study, Piepenbrink et al. (1996) also found PUN increased as protected lysine was added in a 14% CP diet fed to lactating dairy cows. The reported diet was similar to the DL20 diet in the current study. Those authors also reported plasma lysine concentration in the 14% CP diet with added protected lysine was not different from plasma lysine concentration in an 18% CP diet without added protected lysine (similar to the current DL35).
The concentration of PUN is an estimate of N balance within the animal and indicates if sufficient urea is available for rumen microbial synthesis through N recycling. The amount of N recycled to the rumen is dependent on many factors including rumen ammonia concentration. Levels of PUN beyond 12 mg/dL have been shown to not further increase rumen ammonia concentration (Reynolds and Kristensen, 2008). In an experiment by Bailey et al. (2012), supplementing energy to a prairie hay diet decreased PUN, but casein supplementation did not affect PUN. The CP content of the prairie hay was 5.8% of DM and PUN ranged from 2.32 to 4.98 mM. Wickersham et al. (2008) also supplemented casein to a prairie hay diet (4.7% CP) and observed linear increases in PUN concentration. Baseline PUN started lower in the Wickersham et al. (2008) experiment compared to Bailey et al. (2012) and casein supplementation amounts were greater. Vasconcelos et al. (2007) concluded that increasing blood urea N concentrations beyond 5 to 8 mg/dL results in increased N excretion in the urine with little improvement in N retention. For the current experiment, dietary CP was greater than 12% for all diets. The concentration of PUN reflected this and was similar to findings by Jennings et al. (2018) in diets with similar CP. There are upper limits on PUN levels for cattle. With the greater CP of the DL35 diets, PUN was likely close to the maximum for all treatments, resulting in no differences at the time of sampling.
Modeling Nutrient Requirements
SoyPass supplementation increased intestinal supply of several amino acids, with lysine being of primary interest due to the low lysine content of corn protein. Predicted metabolizable lysine balance for steers consuming all six experimental diets are in Table 3. There are a number of assumptions employed related to the amount of MCP flow, its source, and the individual quantity and digestibility of the AA in MCP as listed in the footnote to Table 3. The metabolizable lysine balance was negative for the DL20 diets with 0% and 30% SP. This suggests replacing WDGS with SP should have elicited a performance response. The fact that performance was not different in the DL20 diets suggests the assumptions for the model were not completely correct, small (<5 g/d) deficiencies in lysine balances are outside the range to elicit a performance response, or the decreased dietary energy of the diets overshadowed any benefits of the additional dietary amino acids. The increased ADG for cattle fed DL35 diets increased the requirement for lysine compared to DL20 diets. Overfeeding CP supplied through distillers grains does increase the supply of lysine and providing 35% dietary distillers grains appears to meet the lysine requirement of growing cattle. Historically, overfeeding CP was expensive, but in recent decades overfeeding CP has become common with byproducts from the ethanol industry providing CP at a lower cost (Klopfenstein et al., 2008). Energetic costs of overfeeding N and excreting excess N as urea in the urine are not well understood but likely increase maintenance requirements (Reed et al., 2017; Jennings et al., 2018). The primary environmental cost of feeding excess N is increased ammonia volatilization from the feedlot pen surface (Vasconcelos et al., 2007). Methods of decreasing N volatilization include phase feeding diets to better align N supply and requirement through the feeding period, increasing organic matter content on the pen surface, or removing manure from pens more frequently (Erickson and Klopfenstein, 2010).
Effects of cattle performance, diet, and modeled lysine supply on metabolizable lysine balance
| Low level WDGS (20% DM) | High level WDGS (35% DM) | |||||
|---|---|---|---|---|---|---|
| SoyPass replacing WDGS DM, % | SoyPass replacing WDGS DM, % | |||||
| 0 | 30 | 60 | 0 | 30 | 60 | |
| Model inputs | ||||||
| DMI, g/d | 8,050 | 8,360 | 7,980 | 8,100 | 8,440 | 8,930 |
| Rumen available TDN intake1, g/d | 4,403 | 4,765 | 4,554 | 4,334 | 4,634 | 5,019 |
| Metabolizable Lys intake, g/d | 4 | 5 | 6 | 8 | 11 | 14 |
| MCP flow, g/d2 | 572 | 620 | 592 | 563 | 602 | 652 |
| Bacterial3 | 487 | 527 | 503 | 479 | 512 | 555 |
| Protozoal3 | 85 | 93 | 89 | 84 | 90 | 97 |
| Microbial metabolizable Lys, g/d4 | 30 | 32 | 31 | 29 | 31 | 34 |
| Total metabolizable Lys flow, g/d5 | 33 | 37 | 36 | 37 | 42 | 48 |
| Requirements, g/d | ||||||
| MP6 | 540 | 537 | 490 | 570 | 564 | 563 |
| Metabolizable Lys7 | 38 | 38 | 34 | 40 | 40 | 39 |
| Metabolizable Lys balance, g/d | −5 | −1 | 2 | −3 | 2 | 9 |
1Rumen available total digestible nutrients (TDN) used to estimate MCP production in the rumen.
2Microbial crude protein flow estimated using rumen available TDN intake and microbial efficiency of 13%.
3Assumes MCP is 85% bacteria and 15% protozoa (Castillo-Lopez et al., 2013).
4Assumes 7.58% and 10.78% of total AA in bacteria and protozoa are lysine, respectively (Sok et al., 2017).
5Metabolizable lysine from feed and microbes, does not include endogenous flow.
6Metabolizable protein requirement calculated from NASEM (2016) using cattle performance measured in the current experiment.
7Metabolizable lysine requirement assumed to be 7% of MP requirement based on AA composition of lean beef (NRC, 1996).
Klemesrud et al. (2000) reported increased gain when lysine was added to a corn gluten meal supplement for growing steers. That research indicated the lysine requirement for growing steers similar to the weight of steers in the current study was 5.7% of the MP requirement. In the current experiment, the total metabolizable lysine flow was 6.3% and 6.5% for the 0 SP diets in the DL20 and DL35, respectively, suggesting the lysine balance still may have been adequate without SP added. However, Figure 1 shows the interaction between DL and SP inclusion. The modeled line in Figure 1 is dependent on the energy density of the diet, irrespective of amino acid requirements. In the DL35 diets, there was a linear decrease in G:F as SP increased, which would be expected if lysine requirements are met as this is a classical response of increased DMI and same ADG due to a lower energy diet with SP. However, with DL20 there was no effect of SP, suggesting that even though the greater inclusion of SP was less energy-dense, cattle had similar G:F, possibly because of the better amino acid balance. Energy density decreased by 4.8% (2.28 to 2.17 Mcal ME/kg) in the DL20 diets and 7.0% (2.58 to 2.40 Mcal ME/kg) for the DL35 diets as SP inclusion increased (Table 1). It is challenging to separate impacts of energy and MP from feeds and assign true energy values for RUP supplements such as SP. Feeding a more concentrated source of amino acids to growing cattle on a forage diet with less than 20% distillers grains may result in performance benefits due to balancing the diet for amino acids, most notably lysine.
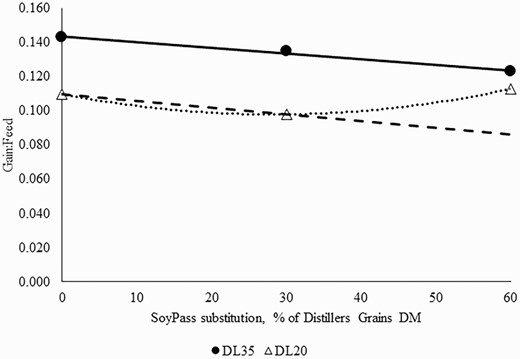
Effect of replacing 35% (DL35) or 20% of diet DM (DL20) distillers grains with SoyPass (0%, 30%, or 60% of the distillers grain) in brome hay-based growing diets on gain:feed. For cattle fed 35% distillers grains (solid line and solid circles), gain:feed tended to linearly decrease (P = 0.06; y = −0.0003(SE = 0.0002)x + 0.143(SE = 0.23) with greater inclusions of SoyPass. For cattle fed 20% distillers grains (dotted line and open triangles), gain:feed was not affected by SoyPass inclusion (P ≥ 0.11). A linear decrease in gain:feed for DL20 (dashed line) would be expected if lysine requirements were met due to decreasing dietary energy as SoyPass replaced distillers grains.
When WDGS was fed at a low (20% DM) or high (35% DM) inclusion rate in a forage-based diet, replacing the distillers with a source of protected amino acids, supplied through heat-treated SBM, did not improve growing calf performance. The amino acids (primarily lysine) supplied through MCP and 35% distillers grains were sufficient to meet the amino acid requirements of growing steers. To benefit from improved amino acid dietary balance, concentrated forms of rumen-protected amino acids or energy dense feeds must be used to not reduce dietary energy.
ACKNOWLEDGMENTS
Funding for this project was received from the Nebraska Soybean Board. This project is based on research that was partially supported by the Nebraska Agricultural Experiment Station with funding from the Hatch Act (Accession Number 1007896) through the USDA National Institute of Food and Agriculture.
Conflict of interest statement. None declared.
