


Abstract
The objectives of this study were to benchmark cow-calf producer perspectives on management strategies and challenges, and to determine if demographic differences and Beef Quality Assurance (BQA) certification status influenced the frequency of certain management strategies. A total of 1,414 responses from cow-calf producers in 44 states were collected through an online survey conducted in partnership with BEEF, a producer-focused magazine. Survey recipients were asked 30 questions to gather demographic information, respondents’ current handling and health management practices, and how they prioritized industry challenges. The frequency of management methods and decisions such as preconditioning and identification methods were impacted by respondent age, operation size, location, and BQA certification (Ps ≤ 0.009). BQA-certified respondents more frequently used electronic ear tags and freeze branding (Ps = 0.009). Overall, 74.5% of respondents were preconditioning their calves. Respondents who were BQA certified more frequently preconditioned their calves (449; 81.5%) compared with those who were not BQA certified (582; 70.4%) (P < 0.001). BQA training seems to be having a positive impact on production practices. Respondents identified cow-calf health as the biggest beef industry challenge and identified land availability or price as the biggest challenge to producers’ own operation. Respondents identified bovine respiratory disease, flies, pinkeye, and reproductive health as the most important animal health issues on producers’ operations. Health challenge responses varied significantly by producer age, beef cow inventory, and region of the United States (Ps < 0.001). Calf or neonate health was most commonly identified as the biggest challenge for respondents under the age of 30 years. Producers between the ages of 55 and 70 years most commonly responded that the Veterinary Feed Directive or regulations were more of a challenge than other age groups. Respondents clearly identified managing herd health as a challenge throughout the survey. Respondents with similar herd health challenges were identified based on demographic categorization, such as age of respondent and region.
INTRODUCTION
Livestock producers are encountering increased pressure to alter how they raise animals and there often comes a cost associated with measures to better improve animal welfare (Olynk, 2012). Benchmarking cow-calf producer perspectives on management strategies and industry challenges can provide insight into how producers are altering their production systems to respond to consumer demands. Simon et al. (2016) benchmarked health and handling practices and created management predictors to examine relationships with cattle health and behavior outcomes. In 2017, the United States Department of Agriculture’s (USDA) National Animal Health Monitoring System (NAHMS) conducted a needs assessment to determine gaps in management practices and identified cow and calf health, along with animal welfare, as high-ranking priorities (USDA-APHIS-NAHMS, 2016b).
Preventing calfhood diseases influences the economic viability of beef operations (Lorenz et al., 2011). Preconditioning cattle can add on average $14 per head (Dhuyvetter et al., 2005) and reduces the likelihood of calves getting sick post-weaning (Stuttgen and Halfman, 2013). Larger producers, who rely on cattle for a greater percentage of their household income, along with younger cow-calf producers, were found to be more likely to adopt management practices recommended by university extension agents (Ward et al., 2008).
Beef Quality Assurance (BQA) certification may identify producers who are willing to make learning about good management practices a priority. The purpose of the BQA program is to enhance profitability through better management and uphold consumer confidence in valuable beef products (Beef Checkoff, 2017).
The objectives of this study were to benchmark cow-calf producer perspectives on management strategies and challenges, and to determine if demographic differences and BQA certification status influenced the frequency of certain management strategies.
MATERIALS AND METHODS
General
Survey questions regarding current management practices on U.S. cow-calf operations were developed by Colorado State University in partnership with Penton Research, the research branch of Penton ( New York, NY, USA). The survey was constructed for electronic dissemination using Qualtrics survey software (Qualtrics, Provo, Utah, USA). Methodology, data collection, and analysis were performed by Colorado State University and Penton Research. Penton was the parent company of BEEF, and BEEF has since been acquired by Informa (London, UK). BEEF serves as a source for business management and production information for the U.S. beef cattle industry, with subscribers in all 50 states with varying cow inventories and management styles. BEEF’s purpose is to help readers build more efficient and profitable cattle production businesses with a focus on quality and the preservation of natural resources (BEEF, 2018). As a result, BEEF subscribers are likely to be cattle producers who are engaged in new industry practices and are more focused on improving their herd management than the industry as a whole. Owing to this survey being distributed via email, cow-calf producers who only receive BEEF in print were excluded from the survey distribution. This survey was examined by the institutional review board (IRB) at Colorado State University and deemed exempt from full IRB review (CSU IRB No. 122-18H).
On July 26, 2017, Penton Research e-mailed invitations to participate in an online survey to 41,191 BEEF subscribers who within the BEEF database had previously reported having any beef cows in inventory. By August 14, 2017, Penton Research received 1,414 completed surveys and the survey was closed to respondents on that date. To encourage prompt response and increase the response rate overall, the following marketing research techniques were used: a live link was included in the e-mail invitation to route respondents directly to the online survey, reminder e-mails were sent to nonrespondents on August 1, 2017, and the invitations and survey were branded with the property name and logo of BEEF in an effort to capitalize on subscriber brand affinity.
The survey consisted of 30 questions divided into sections that included respondent demographic information, cattle handling, management, marketing, replacement selection practices, and challenges. Respondents could opt out of answering any of the questions, and the option to provide an answer labeled as “other” was included where applicable if respondents did not identify with any of the responses listed. Respondents could cease filling out the survey at any time; in the event of partially completed surveys, unanswered questions were removed from the analysis. The survey questions regarding respondent demographic information, cattle handling and management practices, and challenges are outlined in Table 1.
Survey question categories and question topics
| Survey question category | Survey question topics |
|---|---|
| Respondent demographic information | • Producer age |
| • Producer BQA certification | |
| • Seedstock or commercial producer | |
| • Role of producer on operation | |
| • Beef cow inventory | |
| • Beef cow location | |
| Handling | • Squeeze chute type |
| • Herding method | |
| Management | • Preconditioning |
| • Animal identification method | |
| Challenges | • Top challenges to producer’s operation |
| • Most important herd health challenge | |
| • Succession planning | |
| • Top 5 industry challenges |
The first section of the survey collected demographic information including beef cow inventory; the state in which the respondent’s cows predominantly reside; what role the respondent fills on the cattle operation (other could be specified); if the respondent would describe his and/or her operation as seedstock, commercial, or both; respondent age; and whether or not the respondent had achieved BQA certification. The states in which respondents’ beef cows predominantly resided were then divided into regions, which were defined using the O’Connor 2012 U.S. regions map (O’Connor, 2012). All demographic questions allowed for only one response to be selected.
Handling questions included squeeze chute type, manual, hydraulic, both or none, and the primary method of herding cattle. Management questions included whether or not respondent’s calves received vaccinations, if castration was performed while under his or her ownership, if respondents wean and vaccinate (precondition) their calves 45 to 60 d prior to them leaving the operation, and the main method of animal identification. All management questions allowed for only one response to be selected.
Producers were asked to identify the most important animal health issue facing their operation. Responses were typed into a comment box by respondents and then broken down into 19 categories for analysis. In order for the response to fall into one of the categories, the name of the category had to be used within the response. Categories included Bovine Respiratory Disease (BRD) or Pneumonia, Flies, Pinkeye, Reproductive, Internal Parasites, Scours or Diarrhea, Lameness or Foot Rot, Lice or External Parasites, Nutrition, Anaplasmosis, Calf or Neonate Health, Veterinary Feed Directive (VFD) or Regulations, Drought, Heat Stress, Endophyte, Clostridial diseases, Predators, Other, and None.
Respondents were asked to select their top five industry challenges (5 responses could be selected from a list of 15); responses were summed for each topic and frequencies were calculated. Respondents were asked whether or not they had a succession plan in place (succession plan was defined as transferring of the respondent’s operation upon exiting the industry) and their level of concern with succession planning. Finally, respondents were asked to rate a list of challenges to the success of their operation. Respondents could rate challenges to their operation from 1 to 5; 1 being defined as “not at all challenging”; 5 being defined as “extremely challenging.” The number of times respondents indicated that topics were “very” or “extremely” challenging was then summed for each topic and frequencies were calculated. Challenge questions only allowed for one response to be selected unless specified earlier. Results from marketing and selection practice responses are outlined in Martin et al. (2018).
Analysis
Data were entered into a spreadsheet (Microsoft Excel, 2017; Microsoft Corporation, Redmond, WA) and questions with incomplete answers or no response were removed from analysis. Data describing respondent demographic information, cattle handling and management practices, and challenges were generated using means and frequency tables.
Data were analyzed as the number of respondents within each question and as the percentage of the total number of survey respondents for each question (this varied by question from 1,181 to 1,414 responses with an average of 1,373 responses). Demographic information and BQA certification status were compared to management strategies and challenges using contingency tables with significance tested by chi-square analysis using R software (R Core Team, Vienna, Austria). Statistical significance was designated a priori as P values less than or equal to 0.05.
RESULTS
Demographics
The survey response rate was 3.43%. Respondents with cows in 44 states responded to the survey. A total of 1,414 responses were received. Respondents’ cow herds predominantly resided in the Midwest region (607; 42.9%), followed by the Southeast (294; 20.8%) and Southwest (234; 16.6%), the West (228; 16.1%), and finally the Northeast (51; 3.6%) (Figure 1). Respondents’ cow herds predominantly resided in the states of Texas (136; 9.6%), Missouri (100; 7.1%), Nebraska (96; 6.8%), Iowa (78; 5.5%), Oklahoma (71; 5.0%), Kansas (64; 4.5%), and California (51; 3.6%).
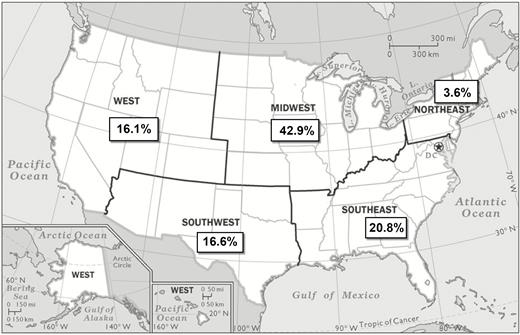
Percentage of respondents by region of the United States (N = 1,414). License permission from National Geographic Society, Washington, DC.
Survey respondents predominantly had 51 to 200 head of beef cows, followed by less than 50 head of beef cows (Table 2). Those with 50 head or less of beef cows were most frequently from the Northeast region (23; 57.5%) relative to other regions. Respondents with inventories ranging from 201 head (54; 28.7%) to more than 1,000 head (11; 5.9%) were most frequently from the West. The majority of survey respondents were of the ages 55 to 70 years and the smallest age group of respondents was under 30 years of age (Table 3).
Respondents’ beef cow inventory as a percentage of overall respondents (N = 1,414)
| Beef cow inventory | Respondent percentage |
|---|---|
| 50 head or less | 33.9% |
| 51–200 head | 42.7% |
| 201–500 head | 16.4% |
| 501–1,000 head | 4.5% |
| More than 1,000 cows | 2.5% |
| Respondent count1 | 1,414 |
| Beef cow inventory | Respondent percentage |
|---|---|
| 50 head or less | 33.9% |
| 51–200 head | 42.7% |
| 201–500 head | 16.4% |
| 501–1,000 head | 4.5% |
| More than 1,000 cows | 2.5% |
| Respondent count1 | 1,414 |
1The number of respondents who answered the question in the survey.
Age of respondents as a percentage of overall respondents (N = 1,411)
| Age of respondent (yr) | Respondent percentage |
|---|---|
| Under 30 | 2.6% |
| 30–54 | 24.9% |
| 55–70 | 53.1% |
| Over 70 | 19.3% |
| Respondent count1 | 1,411 |
| Age of respondent (yr) | Respondent percentage |
|---|---|
| Under 30 | 2.6% |
| 30–54 | 24.9% |
| 55–70 | 53.1% |
| Over 70 | 19.3% |
| Respondent count1 | 1,411 |
1The number of respondents who answered the question in the survey.
Thirty-nine percent (552) of respondents self-identified as BQA certified. As age decreased, the percentage of respondents that indicated that they were BQA certified increased; 45.9% of respondents under 30 years self-identified as BQA certified (17), and only 36% of respondents aged more than 70 years answered that they were certified (98).
Handling
When asked what type of squeeze chute respondents used, 75.2% of respondents used a manual chute (1,062), 9.5% used a hydraulic chute (134), and 7.9% did not use a squeeze chute (112). Forty-one percent of respondents are primarily herding cattle with an ATV (all-terrain vehicle) or four-wheeler (583), 32.7% are herding on foot (461), 16.6% on horseback (234), 7.2% via pickup truck (101), and 2.1% are primarily using dogs (30). Forty-eight percent of respondents (132) over the age of 70 years were primarily herding cattle with an ATV or four-wheeler, which was a higher percentage than other age groups. Forty-six percent (17) of respondents under the age of 30 years primarily herded on foot, which was more than other age groups.
Management
Respondents’ main method of cattle identification was basic ear tag (967; 69.3%), followed by hot iron branding (314; 22.5%), tattoo (42; 3.0%), electronic ear tag (40; 2.9%), and freeze branding (32; 2.3%). The percentage of respondents using the various methods of animal identification differed by BQA certification (P = 0.009) (Table 4). The most common methods of primary identification of respondents not BQA certified were basic ear tags and hot iron branding (Table 4).
Respondents’ primary method of animal identification with responses divided by the percentage of yes/no response to BQA certification status (N = 1,396)
| Overall method use | Divided by BQA certification | ||
|---|---|---|---|
| Method of identification | No | Yes | |
| Basic ear tag | 69.3% | 61.2% | 38.8% |
| Electronic ear tag | 2.9% | 38.5% | 61.5% |
| Freeze branding | 2.3% | 40.6% | 59.4% |
| Hot branding | 22.5% | 60.6% | 39.4% |
| Tattoo | 3.0% | 55.0% | 45.0% |
| Respondent count1 | 1,396 | ||
1The number of respondents who answered the question in the survey.
Per the survey results, 74.5% of respondents are preconditioning their calves (1,045). Percentage of respondents preconditioning their calves differed by BQA certification status (P < 0.001). Respondents who were BQA certified more frequently preconditioned their calves (449; 81.5%) compared with those who were not BQA certified (582; 70.4%).
Challenges
When asked to rate challenges to the success of their own operation, respondents first chose land availability or price (752; 55.8%), followed by lack of market predictability (702; 51.9%), and access to reliable labor (502; 37.1%) (Table 5).
Respondents’ rating of challenges to their operation
| Challenge | Top two values % total | Respondent count1 |
|---|---|---|
| Land availability/price | 55.8% | 1,348 |
| Lack of market predictability | 51.9% | 1,352 |
| Access to reliable labor | 37.1% | 1,353 |
| Lack of market access/marketing options | 21.7% | 1,353 |
| Wildlife predation | 16.9% | 1,348 |
| Sickness/disease | 14.5% | 1,348 |
| Stress from transport/handling | 6.8% | 1,345 |
Respondents were asked to rate the list of challenges and table values represent the combined percentages of producer’s ratings of “very” or “extremely” challenging.
1The number of respondents who rated that particular challenge as one of the top two challenges in the survey.
When asked if succession planning was of great, minimal, or no concern to their operation 40.5% of respondents answered it was of great concern (557), 46.2% of respondents indicated it was of minimal concern (636), and 13.3% of respondents indicated it was of no concern (183). The percentage of respondents with and without a succession plan varied by age group (P < 0.001). Forty-five percent of respondents under 30 years of age said they did not have a succession plan and that they had not planned a transition for transferring the operation upon exiting the industry (13). Only 12.6% of respondents over the age of 70 years had not planned a transition (33). Fifty percent of the respondents over the age of 70 years who did have a succession plan, indicated that their plan was to have the next generation take over (131) (whether the next generation was family or not was not specified). Thirteen percent of respondents over the age of 70 years said yes, they had planned a transition, the cattle will be sold and the land still used for agricultural purposes (35). Overall, 43.0% of respondents planned a transition for the next generation to take over (593), with 11.3% saying no, there was no opportunity for a transition to occur (156).
The percentage of respondents who identified certain health challenges differed by region (P < 0.001). By region, respondents’ most commonly reported health challenge was BRD, which was identified as a challenge more commonly in the West (42; 19.2%) and less commonly in the Southeast (27; 9.4%) and Northeast (3; 7.3%). Reproductive problems were identified as a challenge most commonly in the West (26; 11.9%) and Northeast (5; 12.2%) compared with other regions. Scours were identified as a challenge most commonly in the Midwest (32; 5.6%) and the West (18; 8.2%). Predator problems were identified as a challenge in the West (5; 2.3%). The VFD or other regulations were identified most often in the Midwest (17; 3.0%). Internal parasites were most prevalently identified in the Southeast (26; 9.0%) and Southwest (26; 12.4%). Nutrition problems were most identified in the Northeast (5; 12.2%). Endophyte was a problem in the Midwest (8; 1.4%) and Southeast (2; 0.7%), where fescue is most prevalent. Flies were most commonly identified in the Midwest (78; 13.6%) and Southeast (53; 18.4%). Lameness or foot rot was most identified as a top challenge in the Northeast (3; 7.3%). Pinkeye was identified in the Midwest (90; 15.7%) and Southeast (51; 17.7%). Lice were identified more frequently as a problem in the Southwest (20; 9.5%).
The frequency with which producers identified challenges important to their operations varied by herd size (P < 0.001). Respondents with large herd sizes identified BRD and scours most commonly as significant challenges. Internal parasites, flies, pinkeye, and lice were most commonly identified as problematic in operations with smaller herd sizes.
Calf or neonate health was identified as the biggest challenge for respondents under 30 years of age (7; 16.7%). Lameness or foot rot (3; 7.1%) and clostridial diseases (2; 4.8%) were also identified most commonly by respondents under the age of 30 years. Respondents of the ages 55 to 70 years most commonly responded that the VFD or regulations were a challenge as compared with all other age groups (17; 2.4%). Those over the age of 70 years most commonly responded that they had no major health challenges on their operation (35; 12.1%) relative to other age groups.
Overall, the most important health challenges respondents identified on their operations were BRD or pneumonia (202; 14.7%), flies (179; 13.0%), pinkeye (172; 12.5%), and reproductive challenges (112; 8.1%) (Figure 2).
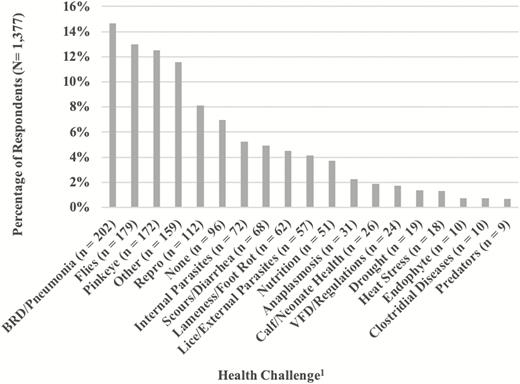
Percentage of respondents who identified the most important animal health issue facing their operation by health category (N = 1,377). 1Health challenges that did not fit into a category were placed into “Other.”
When asked to choose what they viewed as the cow-calf industry’s top five challenges, respondents identified cow-calf health most commonly (787; 57.4%), followed by reproductive health (670; 48.9%), the export market (585; 42.7%), pasture availability (579; 42.2%), and biosecurity or disease prevention (492; 35.9%) (Table 6).
Challenges expressed as a percentage of respondents that selected what they perceive to be the cow-calf industry’s top five challenges from a predetermined list provided in the survey; respondents could select up to five challenges (N = 1, 371)
| Challenge | Respondent percentage |
|---|---|
| Cow/calf health | 57.4% |
| Reproductive health | 48.9% |
| Export market | 42.7% |
| Pasture availability | 42.2% |
| Biosecurity/disease prevention | 35.9% |
| Animal welfare | 32.3% |
| Food safety | 31.5% |
| Quality assurance | 29.8% |
| Traceability/animal identification | 28.9% |
| Environmental sustainability | 28.2% |
| Foreign animal disease | 22.7% |
| Lameness/structural soundness | 21.6% |
| Heifer management | 21.2% |
| Antimicrobial resistance | 17.1% |
| Cost of genetic testing | 7.2% |
| Respondent count1 | 1,371 |
1The number of respondents who rated that particular challenge as one of the top two challenges in the survey.
DISCUSSION
Demographics
The percentage of respondents with cows residing in each region was consistent with the overall BEEF readership; the overall readership consists of 58.2% of readers in the Midwest, 13.2% in the Southeast, 13.1% in the West, 12.1% in the Southwest, and 1.8% in the Northeast (Alliance for Audited Media, 2017). As of January 1, 2017, the top states in the United States that raised cattle and calves were 1) Texas, 2) Nebraska, 3) Kansas, 4) California, 5) Oklahoma, and 6) Missouri (Livestock Marketing Information Center, 2017). Relative to the population of producers identified in a national study done in 2016 by the USDA NAHMS, the Midwest region had a higher representation of respondents and the Northeast region had a lower representation of respondents in this study (USDA-APHIS-NAHMS, 2016a). However, the NAHMS study used different media outlets to identify industry stakeholders and included more than just cow-calf producer responses.
The average beef cow herd in the United States is 40 head, but operations with 100 head or more beef cow inventories make up 51% of the overall U.S. beef cow inventory (USDA-ERS, 2018). In the 2012 Ag Census, 16% of beef cattle operation respondents were under age 45 years, 49% were 45 to 64 years of age, and 35% were 65 years and older (USDA-NASS, 2012).
Handling
Woiwode et al. (2016) found that in 28 western feedyards 50% were using generic scissor-type squeeze chutes and 50% were using hydraulic chutes. The infrequent use of hydraulic chutes by survey respondents in this study could be due to cost and smaller animal numbers being regularly processed through the working facility. Portable systems that allow respondents to move handling facilities from site to site and still have a good option for handling cattle on rented land without making permanent improvements may be a partial result of land availability challenges that respondents identified, which are discussed later. The advancing average age of beef producers may be partially attributable to why such a high percentage of respondents are using an ATV or four-wheeler (Hoppe and Banker, 2006) as they allow for less physical exertion than walking and are easier to get in and out of than some other vehicles.
Management
BQA-certified producers seem to be using more technologically advanced identification methods such as electronic ear tags that can be used for traceability purposes. When choosing a type of animal identification, it is likely that producers consider how often the animal is handled, cattle temperament, how quickly and effectively the means of identification can be applied, and what other procedures take place concurrently which all impact the stress response of the calf and how soon that response diminishes (Lay et al., 1992; Grandin, 2014). Respondents who were BQA certified had received some education about restraint and good handling, which may have been influencing what methods of identification they chose. The survey question simply asked respondents to self-identify if they were BQA certified; researchers were not able to verify the certification status of respondents. Therefore, it is not known if respondents self-identifying as BQA certified were currently certified or had received BQA training at some point but their certification had expired.
The number of respondents preconditioning their calves seemed to be high in the present survey. A survey of cow-calf producers in Canada found that 52% of respondents were shipping their calves within 2 d of weaning, indicating that preconditioning is still not practiced by many producers (Moggy et al., 2017). Respondents who read BEEF may be more invested in their calf crop than producers who do not, which may be why such a high percentage of respondents were preconditioning. In the survey, preconditioning was defined for respondents as weaning and vaccinating calves 45 to 60 d prior to them leaving the cow-calf operation. Respondents who background or finish their own calves may have been less likely to indicate that they precondition their calves based on the definition provided, as calves may never leave the cow-calf operation. In the past, premiums have existed for preconditioning but not necessarily great enough premiums to result in increased net profit for the producer (Thrift and Thrift, 2011). Preconditioning programs help calves during the transition period following weaning at the ranch and as they enter a backgrounding or feedlot environment (Stuttgen and Halfman, 2013). Preconditioning reduces morbidity and mortality (Machen and Gill, 2016) and leads to improved health, average daily gain, feed efficiency, and welfare (Hilton, 2015). With the advent of antibiotic-free and natural programs, calves that are less likely to become sick hold even more value because they are less likely to require treatment and be removed from those special programs.
BQA certification is one education tool that seems to be having a positive influence on implementing good management practices based on the results from this study. BQA certification is a practical education tool that is part of the solution to better equipping producers with relevant information for better managing their operations.
Challenges
Financial challenges were most commonly identified when producers were asked about their own operation instead of the beef industry in general. Land availability was identified as a personal operation challenge and pasture availability was ranked within the top five industry challenges. Access to land seemed to be at the forefront of producers’ minds when identifying challenges. Further studies investigating how a lack of pasture availability is influencing producers’ management decisions would be beneficial.
With land availability and price being an obstacle for young people entering the cow-calf business, succession is a solution that greatly reduces the amount of capital required to enter the business. Succession decisions have been found to be impacted by government farm policy, wealth, age, and education of farm operators (Mishra and El-Osta, 2008). This survey indicates that age impacts concern with succession planning.
Hall et al. (2003) identified beef producers’ primary risk management concerns for their operations as severe drought, cattle price variability, cold weather, and disease. These findings are consistent with respondents’ answers in the current survey when asked what the most important health challenge on their operation was. Many of the regional challenges identified are linked to management practices and could be a result of environmental factors not being managed ideally. With the timing of this survey running parallel to the warmest part of the year, the most humid regions of the U.S. reporting flies as a challenge was expected. Environmental factors and management practices play a big role in calfhood diarrhea (Cho and Yoon, 2014). Large temperature swings in these regions may be partial contributors to this problem, along with the need for improved management practices such as better hygiene in calving areas to reduce exposure to pathogens in mud and feces.
BRD can be a result of cattle being exposed to a host of different infectious agents and the regional differences may be attributable to vaccine usage and efficacy, along with commingling, stress, and different management practices (Lekeu, 1996). With endemic herd health challenges such as bovine viral diarrhea virus and Leptospira spp. being common pathogenic organisms that cause substantial reproductive losses that include low conception rates and abortions (Grooms, 2006), it is not surprising that reproductive challenges were a big concern for respondents.
Use of herd-health-related veterinary services has been found to increase with herd size (Waldner et al., 2013). This may be attributable to smaller herd sizes being less likely to have a working relationship with a veterinarian. When producers were asked to identify the cow-calf industry’s top five challenges, three of the five challenges they most frequently identified related to herd health. Similar priorities were identified by producers in 2016 when cow and calf health were identified as top management issues, followed by animal welfare, nutritional management, and biosecurity in a USDA NAHMS study (USDA-APHIS-NAHMS, 2016a). Through improved veterinary–client–patient relationships and the development of teaching materials that are relevant to younger producers, better herd health management protocols can be put into place. With specific health challenges identified by region and herd size, veterinarians can target specific gaps in management and health protocols that negatively affect cow-calf welfare based on operation specific parameters.
CONCLUSION
Cow-calf producer production practices are impacted by producer age, operation size, location, and BQA certification. BQA training seems to be having a positive impact on production practices. Producers with similar demographic categorization, such as producer age and region, identified similar herd health challenges. The most important animal health issues on respondents’ operations were identified as bovine respiratory disease, flies, pinkeye, and reproductive health, all issues that have been identified as common health challenges within the industry. The greatest industry challenge identified was cow-calf health and the biggest challenge to respondent’s own operation was identified as land availability or price. Future surveys benchmarking the change in production practices and challenges producers are facing over time would be beneficial.
ACKNOWLEDGMENTS
This survey was funded by BEEF.
Conflict of interest statement. None declared.
LITERATURE CITED
