


Abstract
Across the Tree of Life, most studies of phenotypic disparity and diversification have been restricted to adult organisms. However, many lineages have distinct ontogenetic phases that differ from their adult forms in morphology and ecology. Focusing disproportionately on the evolution of adult forms unnecessarily hinders our understanding of the pressures shaping evolution over time. Non-adult disparity patterns are particularly important to consider for coastal ray-finned fishes, which can have juvenile phases with distinct phenotypes. These juvenile forms are often associated with sheltered nursery environments, with phenotypic shifts between adults and juvenile stages that are readily apparent in locomotor morphology. Whether this ontogenetic variation in locomotor morphology reflects a decoupling of diversification dynamics between life stages remains unknown. Here we investigate the evolutionary dynamics of locomotor morphology between adult and juvenile triggerfishes. We integrate a time-calibrated phylogenetic framework with geometric morphometric approaches and measurement data of fin aspect ratio and incidence, and reveal a mismatch between morphospace occupancy, the evolution of morphological disparity, and the tempo of trait evolution between life stages. Collectively, our results illuminate how the heterogeneity of morpho-functional adaptations can decouple the mode and tempo of morphological diversification between ontogenetic stages.
For Losos 2009; Dornburg et al. 2011; Near et al. 2012; Frédérich et al. 2016; Wainwright and Price 2016; Cooney et al. 2017), with larvae and juveniles remaining largely neglected until recently (Sherrat et al. 2017; Wollenberg Valero et al. 2017). Such an ontogenetically restricted perspective is problematic as changes in one or more aspects of an organism’s niche during ontogeny (i.e., ecophases) are common across the Tree of Life. Examples of ontogenetic niche shifts are documented in various lineages including plants (Parish and Bazzaz 1985; Miriti 2006; Yang and Rudolf 2010); insects (Dopman et al. 2002); reptiles (Mushinsky et al. 1982); archosaurs (Marchetti and Price 1989; Subalusky et al. 2009); and fishes (Gagliano et al. 2007; Frédérich et al. 2008, 2010; Kimirei et al. 2013) to name but a few. If we acknowledge that ontogenetic niche shifts might act as a potential source of ecological opportunity, a narrowed focus on only a single life-stage of a lineage may obscure major drivers of ecomorphological diversity. In the worst case, not considering different life stages of an organism can lead to either biased or incomplete conclusions regarding the general rules governing organismal evolution. Developing an expanded ontogenetic perspective on patterns of phenotypic diversification therefore represents an oft-neglected, yet critical aspect of evolutionary biology.
The observation that selective pressures are heterogeneous between life stages has been discussed for more than 50 years (Istock 1967; Wilbur 1980; Gagliano et al. 2007), and there is increasing evidence for variation in the pattern of phenotypic diversification between stages. For example, the transition between amphibian life stages has been associated with a decoupling in the mode of morphological evolution across ecophases (Sherrat et al. 2017; Wollenberg Valero et al. 2017), with Fabre et al. (2020) demonstrating the role of complex life cycles in driving the rate of morphological evolution. However, this perspective that ontogenetic niche shifts can promote variation in the pattern of phenotypic diversification between life stages has rarely been considered in the macroevolutionary history of marine teleost fishes—an assemblage that represents a quarter of all living vertebrates. This knowledge gap is particularly problematic for the vast majority of reef-dwelling teleost fishes, as these have complex life-cycles characterized by ontogenetic shifts in their ecology (Nagelkerken et al. 2000). Most larvae drift in the water column in open water and near-reef pelagic environments. In contrast, the juvenile/adult stages are very active swimmers and are associated with demersal habitats (Leis 1991). Unfortunately, the evolutionary diversification of non-adult fishes remains understudied.
Recent studies have shown that the ecological transition from a relatively homogenous environment to a more trophically and structurally complex environment leads to major ontogenetic variation of fish morphology between larval fishes and later life stages (Frédérich et al. 2008; Frédérich and Vandewalle 2011). However, even within coastal environments, juveniles and adults may not share the same type of habitats. For example, many species occupy open or high-flow environments only during their adult stage (Fulton and Bellwood 2002). In contrast, their juvenile forms generally inhabit nursery habitats that are characterized by three-dimensional complexity and shelter from changes in flow regime and predation (Nagelkerken et al. 2000). Shifts in habitat usage from these nurseries to high-flow environments are common throughout ontogeny (Lecchini and Galzin 2005; Amorim et al. 2018; Moussa et al. 2020), subjecting transitioning individuals to new hydrodynamic regimes and ecological opportunities. Such changes in hydrodynamic regimes and ecological opportunities between adults and juveniles raise the question of how such transitions have shaped the evolution of morphological traits associated with locomotion.
Swimming performance, directly determined by various structures of the locomotor system, is a major determinant of fish survival, growth, and reproductive fitness (Webb 1984; Blake 2004). In teleosts, the two most common swimming modes are defined based on the parts of the body involved in thrust production during steady swimming (Webb 1984; Sfakiotakis et al. 1999): body/caudal fin (BCF) and median/paired fin (MPF) locomotion. BCF swimmers undulate sinusoidal waves along the body or oscillate their caudal fins. Conversely, MPF swimmers hold their bodies and caudal fins steady at most speeds while relying on undulations or oscillations of their median or paired fins for propulsion. Based on this simple classification, functional studies have repeatedly highlighted links between swimming performance and traits such as body and fin shapes, as well as the aspect ratio (AR) of fins (e.g., Wainwright et al. 2002; Walker & Westneat 2002a; George and Westneat 2019). However, given the differences in environmental niches between many juvenile and adult fishes, locomotor-associated traits such as fins and body morphology are likely to be under opposing selective pressures between ontogenetic stages. For example, body or fin morphology may differently affect various axes of swimming performance such as maximum sustainable swimming speed, burst performance, or maneuverability (Webb 1984; Vogel 1996; Blake 2004), thereby imposing functional trade-offs on the optimization of locomotion (Blake 1983a, 1983b; Fossati and Muggiasca 2009; Langerhans and Reznick 2010). How such possible trade-offs are mitigated during the evolution of fin and body morphology between juvenile and adult stages occupying alternate habitats and/or experiencing variation in other selective factors (e.g., predators) remains unknown.
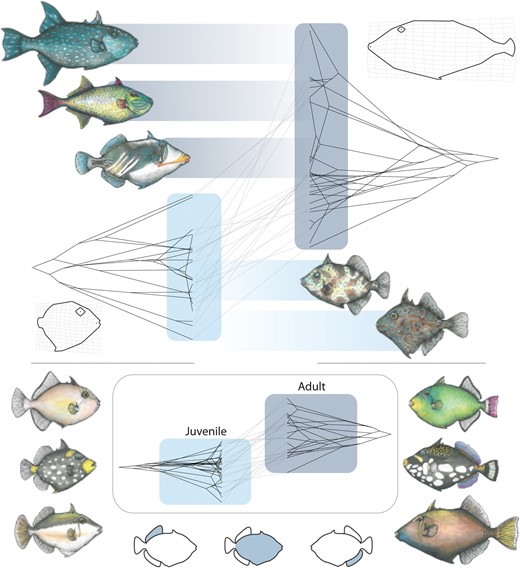
Triggerfishes (Balistidae) provide an ideal case study from which to investigate the relationship between the two active swimming stages—juvenile and adult—and the diversification of locomotor morphology. These iconic reef fishes also possess a distinct MPF swimming mode, balistiform locomotion, in which forward propulsion is primarily generated by a combination of oscillations or undulations of paired dorsal and anal fins (Lighthill et al. 1990; Sfakiotakis et al. 1999). To increase speed, triggerfishes undergo a gradual gait transition from balistiform locomotion alone at low speeds, to a gait involving both balistiform locomotion and a small BCF contribution at intermediate speeds, and finally to a gait dominated by burst-and-glide BCF locomotion at their fastest speeds (Wright, 2000). However, there are fundamental differences in fin and body shapes between species that have been correlated with swimming performance and transitions in swimming mode (Wright, 2000). High-flow open-ocean species such as the white-spotted oceanic triggerfish (Canthidermis maculatus) are characterized by shallow bodies with high aspect ratio dorsal and anal fins. In these species, high aspect ratio fins are associated with decreased drag, oscillatory fin motions, and prolonged higher cruising speed. In contrast, species such as the blackbelly triggerfish (Rhinecanthus verrucosus) have deeper bodies with lower aspect ratio fins that are often associated with undulating fin movements and effective prolonged slow swimming (Wright 2000). As a consequence, species with small, short, and rounded median fins and narrow caudal peduncles will transition to BCF locomotion at far lower speeds than species with large and long median fines, higher AR median fins, and wide caudal peduncles (Wright 2000; George and Westneat 2019).
The evolutionary novelty of balistiform locomotion is hypothesized to have driven repeated convergence in habitat-associated body forms and fin shapes (Dornburg et al. 2008, 2011; Santini et al. 2013; McCord and Westneat 2016a). However, this range of habitats is not observed in juvenile triggerfishes. Like many reef fish species, triggerfish juveniles are found in sheltered, low-flow habitats whereas adults range from low- to fast-flow environments (Chen et al. 2001; Lyczkowski-Shultz et al. 2003; Dornburg et al. 2011). For example, in Moorea lagoon (French Polynesia), the juveniles of the white-banded triggerfish (Rhinecanthus aculeatus) live in sandy areas close to the beach whereas adults are found at greater depths along the barrier reef in areas with strong currents and high-living coral cover (Lecchini & Galzin 2005). Similar mismatches between adult and juvenile habitats challenge a consideration of factors driving the disparity of this fish group at different life stages. On the one hand, we hypothesize that the diversity of nursery habitats, characterized by their high structural complexity (Morinière et al. 2004; Cheminée et al. 2015; Dance et al. 2021), could have catalyzed the diversification of juvenile body and fin morphology similarly to what is observed in adults (Dornburg et al. 2011). Such a pattern would reflect the diversification of juveniles within early diverging lineages into a variety of nursery habitats such as sargassum, mangroves, or inshore rubbles. On the other hand, the need for maneuverable phenotypes with high burst performance for predatory avoidance could have impeded morphological diversification. Discoid body shapes and low aspect ratio fins are naturally maneuverable and linked to gait transition to BCF locomotion at low speeds (George and Westneat 2019), and this form may represent more of a generalist phenotype that requires only minor modification to be efficient across nursery habitats. In this second scenario, the evolution of balistiform locomotion may have limited the potential for functional locomotor phenotype diversification in juvenile triggerfishes in contrast with their adults (Dornburg et al. 2011). Understanding the explanatory power of these corner cases and related hypotheses is essential to developing a broader perspective of the pathways that shape the phenotypic diversity of adult forms. Moreover, such a perspective is critical if we want to develop robust rules of life concerning the roles of evolutionary novelties on patterns of phenotypic diversification.
Here we investigated changes in locomotor morphology between adult and juvenile triggerfish phases across a time-calibrated phylogeny. We used geometric morphometrics to quantify median fin and body shapes, and also quantified fin aspect ratios from all major lineages. As changes in aspect ratio require changes in the angle of the fin relative to the horizon to effectively generate lift (Eiffel 1913; Anderson 2005; Fossati 2009), we also quantified incidence angles of the dorsal and anal fins. Additionally, we gathered habitat-usage data from the literature to place locomotor morphology into the context of flow regime differences between life stages. We then subjected phenotypic data to a series of phylogenetic comparative analyses to assess differences in the tempo and mode of phenotypic diversification between the two ontogenetic stages. Our study provides a detailed investigation of the impact of life stage on the phenotypic diversification within a lineage of fishes, giving a critical perspective on the ontogenetic decoupling of macroevolutionary dynamics in the evolutionary radiation of marine biodiversity.
Methods
Data Acquisition
Compiling digital images of specimens and habitat usage patterns.
Images of 270 adult triggerfishes spanning 26 species in all major triggerfish lineages were from Dornburg et al. (2011). An additional set of 454 images of juvenile and adult fishes were taken from online photo repositories and digitized specimens from the North Carolina Museum of Natural Sciences (Supplementary Table S1). This combined dataset encompasses 724 images from 32 triggerfish species (i.e., 78% of the extant diversity of Balistidae; Supplementary Table S2). All museum specimens were photographed facing left, using 12 megapixel DSLR cameras with a macro lens and ring flash. Juvenile triggerfishes possess unique morphologies and spot patterns still visible in museum specimens allowing for identification (Lyczkowski-Shultz et al. 2003). Habitat data for adult and juvenile life stages were compiled from the literature (Supplementary Table S2). Habitats used by triggerfish during their adult and juvenile life stages encompass the majority of tropical and temperate marine habitats. To characterize this broad range of habitats in a manner meaningful to locomotor function, habitat occupancy was partitioned into three bins: 1) mangroves, lagoons, and other structurally complex 3D matrices that buffer against pulses of high water flow; 2) open habitats such as surge zones, outer reefs, or the off-shore pelagic realm; and 3) both (1) buffered and (2) high flow/open habitats. Species assignment to one of these three groups as well as associated references are provided in Supplementary Table S2.
Quantifying locomotor morphology.
Landmark-based geometric morphometric methods were used for shape quantification (Zelditch et al. 2012). Landmark placement on fish bodies and fins was accomplished in the TpsDIG2 software, v2.32 (Rohlf 2015). To quantify body shape, 23 homologous landmarks also used by Dornburg et al. (2011) as well as other studies of acanthomorph body shape diversity (Aguilar-Medrano et al. 2016; Collins et al. 2016) were used to capture body shape variation (Supplementary Fig. S1A). These are: 1) the posteroventral corner of the maxilla; 2) the anteroventral tip of the premaxilla excluding teeth; 3) the anterodorsal point of mouth where the fleshy lip meets scales; 4) the most anterior point of the eye; 5) the most dorsal point of the eye; 6) the most posterior point of the eye; 7) the most ventral point of the eye; 8) the center of the eye; 9) the anterior point of the first dorsal spine insertion; 10) the dorsal fin origin; 11) the anterior point where the dorsal fin sheath joins the fin rays; 12) the dorsal fin insertion; 13) the dorsal inflection of the caudal peduncle; 14) the dorsal caudal-fin ray insertion; 15) the ventral caudal-fin ray insertion; 16) the ventral inflection of the caudal peduncle; 17) the anal fin insertion; 18) the anal fin origin; 19) the posterior inflection where the pelvic flap meets the body; 20) the posterior point of the pelvic spine insertion; 21) the anterior point of the pelvic spine insertion; 22) the posterior ventral point where the fleshy lower lip meets the scales; 23) the anterodorsal point of the lower jaw excluding teeth. To better capture the curves of the body between landmarks, the five sliding semi-landmarks were placed as follows: 1) at the midpoint between landmarks 3 and 9; 2) at the midpoint of the dorsal fin (placed along the body); 3) at the midpoint between the dorsal and ventral caudal fin ray insertions (placed along the fin ray insertion margin); 4) at midpoint of the anal fin (placed along the body); and 5) at the midpoint between landmarks 21 and 22.
For the dorsal and anal fins, a total of four landmarks were placed on each image: insertion and tip of the anterior soft fin ray, insertion and tip of the posterior soft fin ray. Sliding semi-landmarks were placed to capture the curvature of each fin’s distal margin. These were placed by resampling a curve drawn to an outline of each fin’s distal margin divided into nine sliding semi-landmarks (Bookstein 1997). In addition, a sliding semi-landmark was placed along the fin base at the midpoint between the fin origin and posterior insertion for a total of 13 fin landmarks (four fixed, nine sliding semi-landmarks; Supplementary Fig. S1B). Caudal fins could not be photographed consistently due to a high frequency of damage in the specimens and we thus restricted analyses to dorsal and anal fins. Because these two median fins represent the primary axes of locomotion in triggerfishes (Sfakiotakis et al. 1999), the omission of the caudal fins is unlikely to represent a major gap in modeling the ecomorphology of these fishes. Dorsal and anal fins in the specimens used did not suffer such preservation problems and were extended to their full natural raised span for each specimen. Photos of specimens that were not in the collection were only used if the dorsal and anal fins were intact and not collapsed against the body, and photographs of species for which we had museum data fell within the range of morphological measurements, indicating these to be appropriate for inclusion.
After recording landmarks and semi-landmarks, we produced the mean shape of each species at both life stages (juvenile and adult) for each morphological trait, that is, body, dorsal and anal fins. To do so, a Procrustes fit was used to remove variation due to scaling, rotation, and translation in the landmark-based data (Rohlf and Slice 1990; Zelditch et al. 2012), and to generate a mean shape for each species and each morphological trait at each ontogenetic stage. The mean configurations of each species were subsequently combined and subjected to a second Procrustes fit to generate a shape variable dataset for the three traits at both juvenile and adult stages. Procrustes fits were produced by using the TPS Relw software, v1.75 (Rohlf 2015).
In addition to the quantification of fin shapes, we also studied incidence angles and aspect ratios for both anal and dorsal fins. We calculated the angle of the dorsal and anal fin of each specimen relative to the horizon using the angle formed at the junction of two lines: 1) a line drawn from the anterior fin insertion point to the posterior fin insertion point, and 2) a line drawn parallel to the horizontal plane (defined as a line from the premaxilla to the middle of the caudal peduncle) from the posterior fin insertion point to the anterior region of a specimen (Supplementary Fig. S1B). The aspect ratio of each fin was defined following Walker and Westneat (2002a) as two times the leading edge of the fin squared, divided by the total fin area (Supplementary Fig. S1B). Angles and aspect ratios were measured using the ImageJ software package (Abramoff 2007; Hartig 2013).
Divergence Time Estimation
We assembled a phylogenetic dataset by combining publicly available DNA sequence data (Supplementary Table S1) from all previous investigations of triggerfish evolutionary relationships (Holcroft 2004; Dornburg et al. 2008, 2011; Santini et al. 2013; McCord and Westneat 2016b). This dataset included DNA sequence data from 11 genes (12S, 16S, RAG1, RAG2, rhod, Tmo-4c4, Bmp4, COI, CytB, Glyt, MYH6, RAG2) for a total of 9108 base pairs (bp). 12S and 16S were aligned to structural models following Dornburg et al. (2008). Multiple sequence alignments for all other loci were conducted using MAFFT (Katoh et al. 2009) in Geneious v7.1.2 with alignments confirmed by eye. The combined dataset included a total of 36 triggerfish species that span all major lineages as well as 46 monacanthid, two molid, and one diodontid species (Supplementary Table S3) that facilitated the use of fossil calibrations also used by Santini et al. (2013).
Divergence times and phylogenetic relationships were simultaneously estimated in a Bayesian framework using BEAST v2.4.5 (Drummond and Rambaut 2007; Drummond and Bouckaert 2015). Two independent analyses were run for 50 million generations logging parameter estimates every 1000 generations. Analyses were run under an uncorrelated lognormal relaxed clock with a birth-death speciation prior to branching times. Substitution and clock models were unlinked among genes and between stem and loop regions of the ribosomal genes with each partition assigned a GTR + I + Γ4 model of sequence evolution. Convergence between runs and appropriate burn-in levels was assessed through visual inspection of the log-likelihoods and parameter estimates in Tracer v1.7 (Rambaut et al. 2018). For each run, effective sample size (ESS) values were quantified to assess effective sampling of the posterior distribution [ESS values > 200 were taken as indicators of adequate sampling (Drummond et al. 2006). As data partitioning can also have a major impact on phylogenetic inference (Kainer and Lanfear 2015), we partitioned our alignment using Akaike Information Criterion (AIC) in PartitionFinder2 v2.1.1 using the greedy algorithm (Lanfear et al. 2017). The candidate pool of possible partitions contained each gene’s separate codon positions as well as the stem and loop regions of each ribosomal gene (Supplementary Table S4). Substitution and clock models were unlinked following the selection of the best-fit partition model.
To time-calibrate the phylogeny, we followed the fossil calibration strategy used by Santini et al. (2013). Briefly, this approach used the stem balistid Gornylistes prodigiosus to calibrate the divergence between triggerfishes and filefishes. This fossil from the Northern Caucasas is Middle Eocene in age (41–42 Ma) and represents the oldest known crown balistoid (triggerfish + filefish) fossil (Bannikov and Tyler 2008). The 95% soft upper bound on the prior age calibration for this split was determined using the presence of the stem Balistoid Bolcabalistes at 50 Ma (Santini and Tyler 2004). Austromola (Gregorova et al. 2009) was used to calibrate the split between Mola and Ranzania at 22 Ma, with a soft upper bound based on Eomola (Tyler and Santini 2002). A minimum root age for the tree was set to 59 Ma based on the appearance of the Danish fossil Moclaybalistes danekrus with a soft upper bound of 85 Ma based on the appearance of Protriacanthus gortani (Tyler and Santini 2002).
Santini et al. (2013) suggested that more inclusive sampling of monacanthid taxa improved site rate estimates and explained the inconsistency of divergence times between studies of triggerfishes. However, nucleotide substitution saturation could provide an alternate explanation. To test the impact of saturation on our branch length estimates, we quantified site rates of each locus using Hyphy (Pond et al. 2004) in the PhyDesign web interface (López-Giráldez and Townsend 2011) using the time tree from Santini et al. (2013) as a guide. Using the estimated site rates, phylogenetic informativeness (PI) profiles were calculated using the R package PhyInformR, v1.0 (Dornburg et al. 2016). Declines in the shape of PI profiles have been found to reflect intervals where branch length estimates have become compromised (Dornburg et al. 2014, 2017a). As such, we profiled each codon position of each gene as well as the stem and loop regions of each ribosomal gene, excluding loci from selected partitions that possessed a sharp decline in informativeness prior to the root of the guidetree (Dornburg et al. 2014). It should be noted that informativeness calculations have been found to be robust between input guide trees that vary in topology or branch lengths (Dornburg et al. 2017b), so the use of this guidetree over alternative divergence time estimates would be expected to produce indistinguishable PI profile shapes. The resulting alignment was then subjected to two BEAST analyses that mirrored the conditions outlined above. All analyses were also repeated using the same BEAST conditions and filtration criteria as above on an unpartitioned alignment to assess the additional possible effect of partition choice on branch lengths.
Variation in the Diversification of Form and Function Between Life Stages
Life stage and morphospace occupation.—To analyze phenotypic variation between juveniles and adults, we first subjected every shape dataset (i.e., body shape, dorsal fin shape, and anal fin shape) to a principal component analysis (PCA) using the TPS Relw software (Rohlf 2015) to summarize the major axes of shape variation. Juvenile and adult stages were combined to ensure that PC axes reflect the partitioning of morphospace between life stages. Then, to visualize patterns of trait diversity for all data and to qualitatively compare them between the two ontogenetic stages, phenograms were plotted for each trait in both adult and juvenile stages using the R-package phytools, v1.5.1 (Revell 2011). A distance-based Procrustes ANOVA (function procD.lm; 9999 iterations with a randomization of raw data) available in the R-package geomorph, v4.0.5 (Adams and Otárola-Castillo 2013) identified the significance in divergences between adults and juveniles in trait spaces. We additionally assessed phylogenetic signal to compare the pattern of morphological evolution between ecophases. We used the generalized K statistic, implemented in the R-package geomorph (Adams and Otárola-Castillo 2013), that can be applied to univariate and multivariate data (Adams 2014a). A K value greater than 1 implies that closely related species are more similar than expected under a null model of Brownian motion, whereas a value that is <1 suggests that relatives resemble each other less than expected. Rather than absolute values of K on this scale, we focus on how K differs between juveniles and adults. The statistical significance of K statistics was assessed by permutation (1000 iterations). To place our results into an ecomorphological perspective, we tested if the fins and the body morphology of triggerfishes vary across habitats (i.e., 1) structurally and protected habitats, 2) open habitats, and 3) mixed ones) by using ANOVAs followed by pairwise t-tests with Bonferroni adjustments.
Life stage and disparity.—No evidence has been presented for a strict positive linear relationship between the level of morphological disparity and the age of ontogenetic stages in any group of teleost fishes investigated to date (Zelditch et al. 2003; Frédérich and Vandewalle 2011). Thus we might also expect an absence of relationship between juvenile and adult morphological disparity in triggerfishes. To test this hypothesis, we calculated the level of shape disparity separately for each phenotypic trait discussed above based on Procrustes variance (Zelditch et al. 2012) and performed comparisons between ontogenetic stages (i.e., permutation test, 9999 iterations) using the function morphol.disparity in the R package geomorph (Adams and Otárola-Castillo 2013).
Next, we quantified and contrasted calculations of relative subclade disparity through time (DTT—Harmon et al. 2003) for both adult and juvenile stages. Previous work has suggested that between-clade disparity arose early in the evolutionary history of triggerfishes as a consequence of divergent fin aspect ratios allowing early lineages to exploit a range of marine environments (Dornburg et al. 2011). However, it is unknown if patterns of morphological disparity between juveniles follow a similar pattern. Accordingly, we compared whether juvenile fin aspect ratios depict a similar pattern to adult disparity by calculating the relative subclade disparity through time (Harmon et al. 2003) for both stages. We compared results to the expectations of a null model of Brownian motion generated from 10,000 simulations (Slater et al. 2010). We additionally conducted analyses of DTT on fin insertion angles relative to the horizon to test the expectation that this aspect of body shape should mirror patterns of disparity observed in aspect ratios. As principle components and similar ordination analyses such as a relative warps analysis can bias the major axes towards displaying a signature of an early burst of trait evolution (Uyeda et al. 2015), additional shape data was not used in the DTT analyses. All analyses were conducted in the R package geiger2, v2.0.11 (Pennell et al. 2014).
In addition to quantifying patterns of subclade disparity through time, we also used the approach from Cooney et al. (2017) to quantify global patterns of morphospace occupancy of aspect ratios and incidence angles through time. Maximum-likelihood-based ancestral states for each trait in either the juvenile or adult dataset were first estimated using the R package phytools (Revell 2011). Ancestral disparity through time values was based on one million year time slices and calculated as the sum of the variances for each trait in each time slice. Empirical disparity values were compared with trait values generated under a null Brownian model of evolution. Differences in the Loess-fitted slope of disparity between the null model and each dataset were then computed using the R package msir, v1.3.3 (Scrucca 2011). A difference of zero indicates no departure from the expectation of Brownian motion, whereas a positive difference indicates an increase in morphospace expansion, and a negative difference indicates the packing of existing morphospace (Cooney et al. 2017). For each trait, adults and juveniles were compared with assess differences in morphospace occupancy between life stages.
Life stage and rates of trait evolution.—Varied natural selection operating over ontogeny can promote variation in the dynamics of morphological evolution between life stages. We tested this prediction by first comparing the overall net rates of morphological diversification between adults and juveniles with the function compare.multi.evol.rates (Adams 2014b) from the R-package geomorph using a Brownian motion model of trait evolution. This approach calculates the net rate of morphological evolution (σ2) for each trait from the data, allowing a ratio of rates to be quantified, with significant differences assessed via phylogenetic simulation (10,000). The comparisons of overall net rates were performed for every morphofunctional trait, including univariate and multivariate data. Here, landmark configurations of body, dorsal fin, and anal fin were studied separately and were subjected to a single Procrustes superimposition including both juveniles and adults (see above). We strictly followed the procedure described in Denton and Adams (2015) to compare the evolutionary rates of multivariate traits, as this allowed us to compare the same multivariate structure between life stages. As both life stages utilized identical landmark data, no correction for differences in the number of landmarks was needed.
We additionally conducted a series of Bayesian analyses of macroevolutionary mixtures (BAMM, v2.5.0) (Rabosky 2014) to compare rates of phenotypic evolution between ecophases. For each data type (adult versus juvenile) and trait dataset (fin aspect ratio and incidence angle), we set prior parameters using the R package BAMMtools, v2.1.10 (Rabosky et al. 2014). All analyses were run twice independently for 50 million generations, sampling every 1,000 generations. Convergence between runs was assessed through visual inspection of the log-likelihoods and effective sampling of the target posterior distribution of parameter values was assessed through quantification of ESS values (ESS > 200). Finally, we used tip-specific BAMM estimates of trait evolutionary rates, which are the mean of the marginal posterior distribution of rates for individual species. We conducted an ordinary least squares regression analysis on tip rate values obtained from juvenile and adult traits to test the relationship between the dynamics of morphological evolution observed at both stages. In all cases, BAMM analyses were conditioned on taxon sampling at both adult and juvenile stages.
As phenotypic data were available for a larger set of species at the adult stage than for juveniles (Supplementary Table S5), we assessed the sensitivity of our results to uneven taxon sampling levels between juveniles and adults, by repeating analyses following two schemas. 1) We assessed phenotypic rates for individual species when using taxa shared by adult and juvenile datasets and then performed the tests of linear relationships. 2) We quantified phenotypic rates for individual species when including the maximum of taxa for both adult and juvenile datasets, dropped species for which morphofunctional data are not available at both ontogenetic stages, and then performed ordinary least squares regression analyses.
Results
Estimates of Triggerfish Divergence Times and Patterns of Habitat Use Between Ecophases
Across all analyses, the estimated phylogenetic tree topology mirrors previous studies of phylogenetic relationships by supporting six major clades: (1) Abalistes; (2) Canthidermis; (3) Sufflamen; (4) Rhinecanthus; (5) Balistes; and (6) all other balistids (Dornburg et al. 2008, 2011; Santini et al. 2013; McCord and Westneat 2016b). Using all possible subsets of data under a best-fit partitioning strategy (Supplementary Table S4), posterior probability values for all but one node (placement of Rhinecanthus verrocosus) were greater than 0.95 (Fig. 1, Supplementary Fig. S2). PI profiles of several data partitions reached their apex prior to the root of the guide tree (Supplementary Fig. S2B). A decline in PI following the apex of a profile has been dubbed a “rainshadow of noise,” the signature of an increase in the number of hidden substitutions (Townsend and Leuenberger 2011; Dornburg et al. 2017b) that can mislead branch length estimation (Dornburg et al. 2014). The exclusion of data that depicted declines in PI profiles resulted in very different, and at times mutually exclusive, highest posterior density intervals (HPD) of node ages (Supplementary Fig. S2). In general, posterior age estimates were older, generally on the order of 4–5 Ma, when all data was included. The HPD interval of the estimated age for the most recent common ancestor (MRCA) of crown triggerfishes ranged between 21.3 and 24.6 Ma (mean: 22.9 Ma) when all data was included and between 15.9 and 9.4 (mean: 12.6) when data was partitioned and filtered (Fig. 1 and Supplementary Fig. S2).
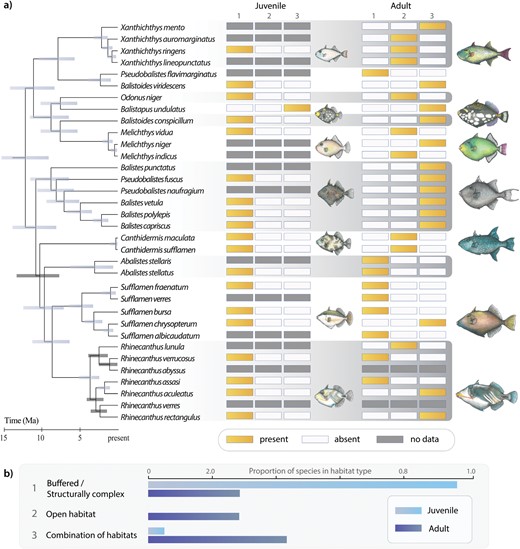
A phylogenetic perspective of triggerfish habitat use between life stages. a) Divergence time estimates of Balistidae from phylogenetically informative partitions and visualization of habitat types between life stages. b) Proportion of species per habitat type between life stages. Numbers in (a) (1, 2, or 3) correspond to habitats in (b). Illustrations by K. L. Zapfe.
Results of our literature search revealed that juveniles from nearly all lineages were associated with low-flow habitats with only Balistapus undulatus using both buffered and open habitats at the juvenile stage (Fig. 1). In contrast, results from our literature search coupled with our phylogenetic tree topology reveal repeated convergences into habitats characterized by high flow or a combination of high and low flow in adult triggerfishes (Fig. 1). For example, the open habitat was invaded by different lineages: Xanthichthys, Canthidermis, Melichthys and Odonus (Fig. 1A). Rhinecanthus showed the largest diversity of habitat usage at the adult stage, having representative lineages restricted to more open versus structurally complex habitats as well as lineages that used a combination of the two categories (Fig. 1).
Life Stage and the Diversification of Locomotor Morphology
Visualizations of phenograms revealed major differences in overall patterns of morphospace occupancy between juvenile and adult triggerfishes (Fig. 2), consistent with our finding of significant morphological variation between the two life stages (Table 1). Juveniles, which were found almost exclusively in sheltered habitats subject to low flow regimes, only possess low aspect ratio fins and thus occupy a fraction of the aspect ratio diversity found in adults (Fig. 2A and B, Table 2). Correspondingly, dorsal and anal fin shape was primarily captured in changes in the length of the fin rays that formed the leading edge of each fin on the first RW that explained 49.8 % and 38.2 % of the total variation between adult and juvenile dorsal and anal fin shapes respectively (Fig. 2C and D; Supplementary Table S5). The second major axis of dorsal and anal fin shape variation (RW2) explained the change in curvature of the distal fin margins and respectively accounted for 24.3% and 35.2% of the variation (Supplementary Table S5). Qualitatively, variation along RW1 and RW2 axes is suggestive of a higher level of shape diversity at the adult stage (Fig. 2C and D). However, when considering all shape information, this difference in disparity levels between life stages was not significant (Table 2).
Testing for morphological differences between life stages
| Trait | Df | F | Z | P-value |
|---|---|---|---|---|
| Body shape | 1;52 | 19.197 | 5.55 | 1.00 × 10-04 |
| Dorsal fin shape | 1;53 | 12.47 | 3.95 | 1.00 × 10-04 |
| Anal fin shape | 1;53 | 7.32 | 3.54 | 2.00 × 10-04 |
| Dorsal aspect ratio | 1;44 | 7.77 | 2.30 | 0.0040 |
| Anal aspect ratio | 1;44 | 7.43 | 2.24 | 0.0037 |
| Dorsal angle | 1;44 | 19.13 | 3.22 | 2.00 × 10-04 |
| Anal angle | 1;44 | 33.30 | 3.89 | 1.00 × 10-04 |
Tests were conducted using the function procD.lm from geomorph with 10,000 iterations and a randomization of raw values (i.e., RRPP = FALSE). Degrees of freedom (Df), F-values, effect sizes (Z) and P-values are provided.
Testing for the variation in the level of morphological disparity between life stages
| Trait | Adults | Juveniles | P-value |
|---|---|---|---|
| Procrustes variance | |||
| Body shape | 0.0064 | 0.0065 | 0.87 |
| Dorsal fin shape | 0.0437 | 0.0227 | 0.07 |
| Anal fin shape | 0.0397 | 0.0272 | 0.25 |
| Dorsal aspect ratio | 0.2772 | 0.0262 | 2.00 × 10-04 |
| Anal aspect ratio | 0.2410 | 0.0226 | 1.00 × 10-04 |
| Dorsal angle | 13.252 | 17.687 | 0.55 |
| Anal angle | 18.940 | 25.211 | 0.46 |
Tests were conducted using the function morphol.disparity from geomorph with 10,000 iterations. Procrustes variance and P-values are provided.
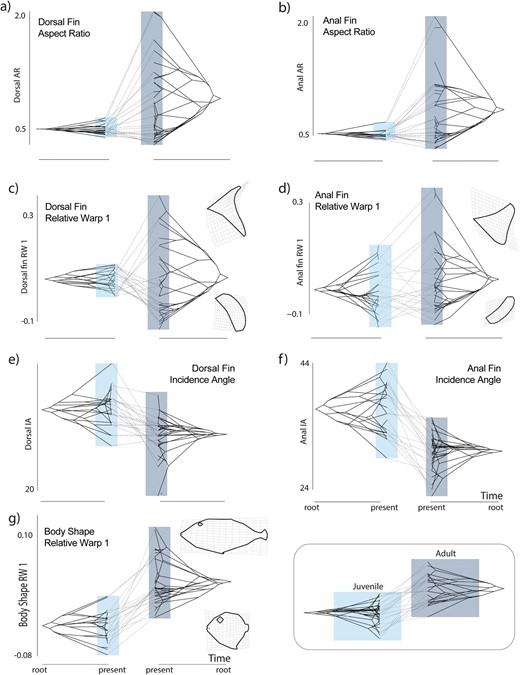
Phenograms comparing morphospace occupancy between juvenile (left each panel) and adult (right in each panel) triggerfishes for (a) dorsal fin aspect ratio; (b) anal fin aspect ratio; (c) the first relative warp axis of dorsal fin shape variation; (d) the first relative warp axis of anal fin shape variation; (e) Dorsal fin incidence angle; (f) anal fin incidence angle; and (g) the first relative warp axis of body shape variation. Light boxes indicate the range of trait values for juveniles, dark the range of adults in each panel.
In contrast to fin shape and aspect ratios, the scope of diversity of incidence angles in juvenile triggerfishes is on par with that observed in adults, albeit shifted towards lower angles (Fig. 2E and F). These changes in angle correspond to overall changes in body shape between adults and juveniles. A dorsal–ventral compression from a discoid juvenile shape to a more fusiform adult body shape is observed, which is coupled with an elongation of the anterior cranium forming the primary axis of body shape change accounting for 41.2 % of the variation (Fig. 2G). The second major axis of body shape variation (20.0 % of the total shape variation) is primarily associated with an elongation of the head region (Supplementary Table S3).
Visualization of our collected trait data partitioned by habitat type is consistent with a hypothesis that morphological differences between juveniles and adults can be explained by habitat use and associated flow regimes (Fig. 3). This association between locomotor morphology and habitat between juveniles and adults was strongly supported by ANOVA’s that revealed significant differences in fins and body morphology among high, low and mixed flow regimes (ANOVAs < 0.05, Supplementary Table S7). Pairwise comparisons additionally revealed the triggerfishes living in mixed habitats shared similar morphologies with species living in open, high-flow regime habitats (Supplementary Table S7). In contrast to comparisons including adults and juveniles, in restricted analysis that included only adults, dorsal and anal fins were the only traits significantly associated with habitat variation (Supplementary Table S8).
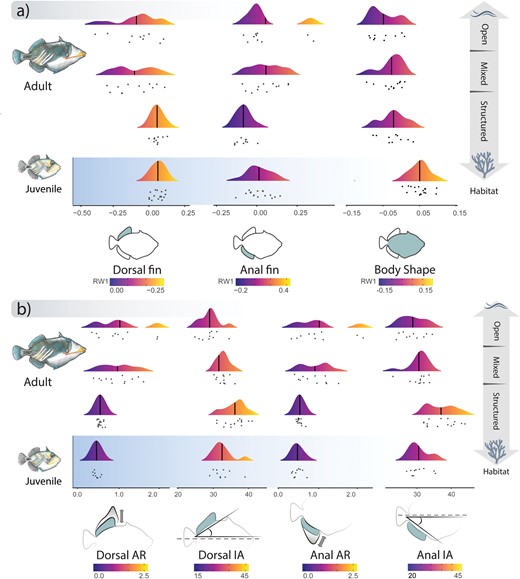
Ridgeline plots depicting the distribution of (a) shape and (b) other locomotor trait data relative to habitat type between adults and juveniles. Color gradients in each panel correspond to values from low (dark) to high (bright). Vertical bars within each distribution indicate the mean value of each trait, dots underneath each distribution represent the raw data values.
An examination of the phylogenetic signal (Table 3) substantiates the above qualitative account of diversification patterns by demonstrating opposing evolutionary patterns between ecophases for fin aspect ratios. In adults, closely related species are more similar than expected by chance, whereas in juveniles these traits are more evolutionary labile (Dorsal ratio: Kadult = 1.2 versus Kjuvenile = 0.6; anal ratio: Kadult = 1.6 versus Kjuvenile = 0.9). Similarly, quantification of phylogenetic signals for body and anal fin shapes was low in juveniles and moderate in adults (Table 3).
Testing for phylogenetic signal
| Trait | Adults | Juveniles | ||
|---|---|---|---|---|
| K | P-value | K | P-value | |
| Body shape | 0.52 | 0.0001 | 0.35 | 0.0029 |
| Dorsal fin shape | 0.66 | 0.0001 | 0.27 | 0.1193 |
| Anal fin shape | 0.91 | 0.0001 | 0.44 | 0.0020 |
| Dorsal aspect ratio | 1.17 | 0.0003 | 0.63 | 0.0111 |
| Anal aspect ratio | 1.62 | 0.0001 | 0.89 | 0.0022 |
| Dorsal angle | 0.22 | 0.5745 | 0.25 | 0.4349 |
| Anal angle | 0.20 | 0.6181 | 0.61 | 0.0111 |
Tests for phylogenetic signal in each data set were conducted using the function physignal from geomorph with 10,000 iterations. K-statistics and P-values are provided.
Our results quantifying overall patterns of disparity over time revealed contrasting patterns of morphospace occupancy over time for fin aspect ratios and incidence angles (Fig. 4). Dorsal and anal aspect ratios in both adults and juveniles were generally similar. In both cases, the disparity was near the expectations under Brownian motion, packing existing morphospace following the early diversification of the crown group (Fig. 4A and B). Placing these findings into the context of subclade disparity mirrors previous investigations of locomotor disparity in adults for aspect ratios (Dornburg et al. 2011): disparity is partitioned between subclades early in the evolutionary history of the clade (Fig. 5A and B). A similar pattern is observed for the anal fin aspect ratio in juveniles (Fig. 5B), while subclade disparity within clades is higher for the dorsal fin aspect ratio (Fig. 5A). In contrast, disparity in juvenile incidence angles reflects an expansion of morphospace over time that sharply diverges from the pattern of less morphospace occupancy over time relative to the expectations of a Brownian motion model observed for adults (Fig. 4C and D). For both adults and juveniles, overall patterns of subclade disparity revealed higher than expected disparity within subclades that exceeded expectations of the Brownian null model (Fig. 5C and D) for incidence angles.
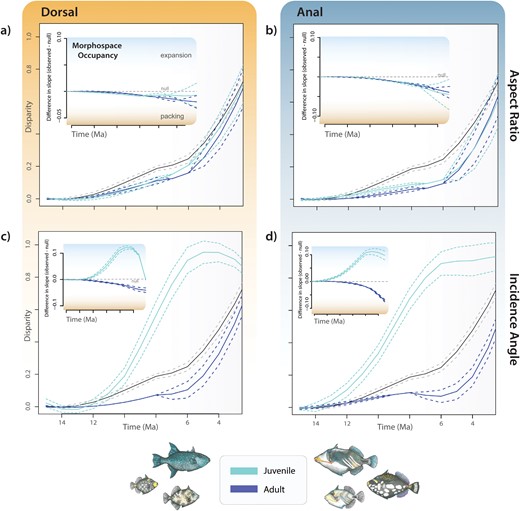
Contrasting patterns of the accumulation of disparity and morphospace occupancy (insets) through time between adults (dark/blue), juveniles (light/aqua), and a null expectation of disparity based on Brownian motion (gray) for (a) dorsal fin aspect ratio; (b) anal fin aspect ratio; (c) dorsal fin incidence angle; and (d) anal fin incidence angle. For insets, positive differences in slope indicate expansion of trait diversity (light shading) whereas negative differences indicate “packing” of an already occupied region of morphospace (orange shading).
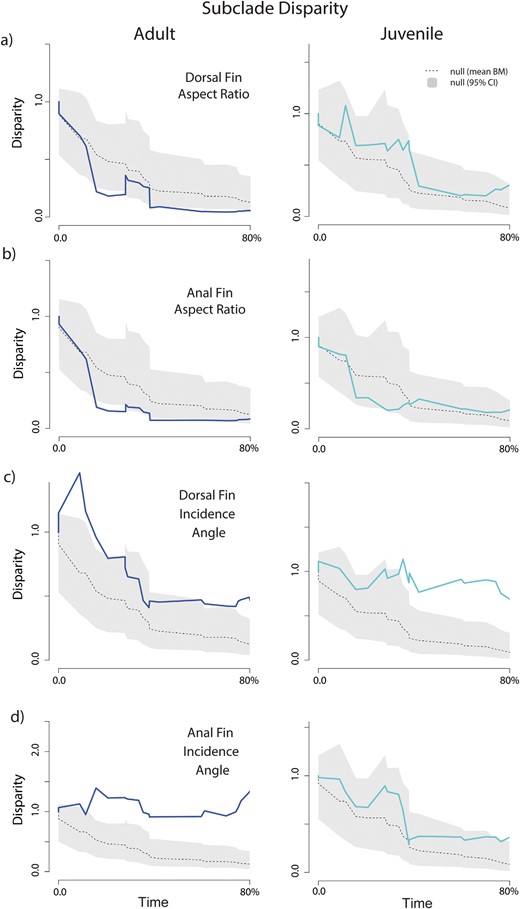
Subclade disparity through time for adults (dark/blue), juveniles (light/aqua), and a null expectation of disparity based on Brownian motion (gray) for (a) dorsal fin aspect ratio; (b) anal fin aspect ratio; (c) dorsal fin incidence angle; and (d) anal fin incidence angle. Dotted gray line indicates the mean subclade disparity through time across the Brownian motion simulations.
In addition to the divergent patterns of morphospace occupancy, the dynamics of morphological evolution display remarkable discordance between juvenile and adult stages. Except for the incidence angles, the overall net rates of evolution significantly differ between stages (Table 4). Specifically, the rate parameters (σ2) for dorsal fin shape and both fin aspect ratios are higher in adults compared with juveniles. Conversely, juveniles demonstrate higher rates of morphological diversification for body and anal fin shapes compared with adults (Table 4).
Testing for the variation in overall net rates of morphological evolution between life stages
| Trait | Adults | Juveniles | Ratio | P-value |
|---|---|---|---|---|
| Rate parameter | ||||
| Body shape | 9.54 × 10-06 | 1.11 × 10-06 | 1.16 | 1.04 × 10-05 |
| Dorsal fin shape | 1.32 × 10-04 | 1.10 × 10-06 | 1.20 | 1.21 × 10-04 |
| Anal fin shape | 9.10 × 10-05 | 1.06 × 10-04 | 1.16 | 9.84 × 10-05 |
| Dorsal aspect ratio | 0.012 | 0.0003 | 39.55 | 1.00 × 10-04 |
| Anal aspect ratio | 0.008 | 0.0002 | 34.18 | 1.00 × 10-04 |
| Dorsal angle | 2.183 | 2.830 | 1.295 | 0.55 |
| Anal angle | 2.589 | 1.414 | 1.83 | 0.16 |
Tests were performed using the function compare.multi.evol.rates from geomorph with 10,000 iterations. Estimated rate parameters (σ2), rate ratios and P-values are provided.
The analysis using BAMM provides further evidence of a pronounced decoupling of macroevolutionary dynamics between adults and juveniles, as well as between the rates of aspect ratio and incidence angle diversification (Fig. 5). The relationships between the estimated rates of morphological evolution in juveniles and adults exhibit poor or non-existent associations. Notably, all linear models tested were non-significant, except for dorsal fin aspect ratios when rate estimates were calculated with maximum taxon sampling for both stages (Table 5). Phylorate visualizations offer valuable insights into the patterns of dorsal and anal fin aspect ratio diversification in adults. These two traits display similar patterns, characterized by higher rates during the early evolutionary history of the group (Fig. 6A and B). In contrast, juvenile rates demonstrate relatively consistent values, significantly slower and over an order of magnitude lower than those estimated for adults (Fig. 6A and B). Similar observations can be made regarding the rates of change for incidence angles between juveniles and adults (Fig. 6C and D). Once again, rates are faster during the early stages of the group’s evolution in adults, surpassing the rates estimated for juveniles by a substantial margin. Furthermore, the incidence angle phenotype of the primary open habitat-associated lineage Canthidermis shows a distinctive signature of accelerating rates towards present-day diversification in adults. Importantly, these findings remain robust across various taxon sampling strategies (Supplementary Fig. S3 and Table 5).
Testing for the relationship between tip-specific estimates of the rate of morphological evolution in juveniles and adults
| Trait | Shared set of species | MAX taxa sampling | ||
|---|---|---|---|---|
| R2 | P-value | R2 | P-value | |
| Dorsal aspect ratio | 0.036 | 0.38 | 0.492 | 2.76 × 10-04 |
| Anal aspect ratio | 0.064 | 0.24 | 0.011 | 0.65 |
| Dorsal angle | 0.010 | 0.65 | 0.024 | 0.49 |
| Anal angle | 0.027 | 0.46 | < 0.001 | 0.95 |
Tip rates were estimated using BAMM with two schemas of sampling strategy: (1) runs of BAMM analyses on the shared sets of species between life stages and (2) runs of BAMM analyses with the maximum taxa sampling for each stage. Results from linear models are provided with R2 and P-values.
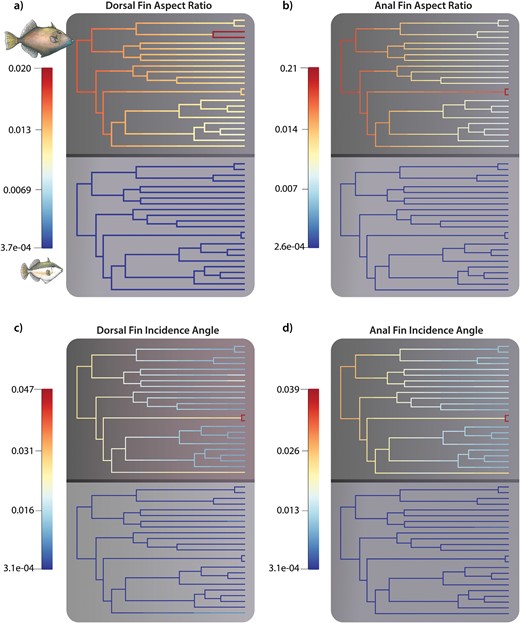
Visualization of rates of trait diversification between adults (top) and juveniles (bottom) for (a) dorsal fin aspect ratio; (b) anal fin aspect ratio; (c) dorsal fin incidence angle; and (d) anal fin incidence angle based on equal sampling of adult and juvenile tips for each trait.
Discwussion
We integrated novel phylogenetic hypotheses of triggerfishes with an extensive dataset on locomotor morphology encompassing body, dorsal fin, and anal fin characteristics. This allowed us to examine and compare patterns of ecomorphological diversification between two distinct ecophases: juvenile fishes inhabiting nursery areas characterized by three-dimensional complexity, shelters, and relatively low flow regimes, and adults utilizing diverse ocean habitats with varying flow regimes. Our results highlight notable differences in morphospace occupancy between juvenile and adult triggerfish body shapes (e.g., discoid body shape of juveniles vs elongated fusiform body shape of adults), and a substantial difference in fin shape diversity between life stages. Our phylogenetic comparative analyses strongly support that the observed disparity variation is driven by two distinct evolutionary patterns across the studied ontogenetic phases. On one hand, primary inter-specific phenotypic variation observed in adults arises from rapid and early divergence in fins and body morphology among major lineages. On the other hand, the disparity of juvenile forms consistently expands within morphospace over time, with closely related species often displaying significant disparity. The distinct evolutionary trajectories observed in the two ecophases highlight the importance of considering both developmental stages in understanding the overall ecomorphological diversification of coral reef fishes with distinct life stages.
Life Stage and the Evolution of Triggerfish Locomotion
Balistiform swimming, a MPF swimming mode, involves locomotion powered through the coordinated movements of their dorsal and anal fins while maintaining a steady body and caudal fin position (Lighthill et al. 1990; Sfakiotakis et al. 1999). This swimming mode has given rise to remarkable diversity in body and fin morphologies (Dornburg et al. 2011; George and Westneat 2021) which correspond to variations in kinematic and swimming performance (Wright 2000; George and Westneat 2019). In particular, triggerfishes can be classified into two distinct groups based on median fin morphology: species with high aspect ratio (AR) fins exhibit an oscillatory large wavelength form of balistiform locomotion, whereas species with low AR fins employ more undulatory fin kinematics (Wright 2000). However, only adult phenotypes show high median fin AR and streamlined, bullet-like body shapes (Figs. 2 and 3) that are associated with offshore pelagic habitats (George and Westneat 2019, 2021). This difference between adults and juveniles has immediate functional implications as another characteristic of balistiform swimmers is the observed gait transition from steady median pectoral fin (MPF) gait to unsteady body-caudal fin (BCF) gait as swimming speed increases (Wright 2000, Walker and Westneat 2002a). Recent experimental investigations have revealed that high median fin AR species demonstrate enhanced endurance swimming performance and higher gait transition speeds (George and Westneat 2019). In light of our findings, such swimming performance is likely functionally inaccessible to juveniles of the same species given the difference in median fin ARs and may partially explain the fundamentally different patterns of phenotypic evolution between life stages.
The findings of all morphospace and disparity analyses provide strong evidence for distinct phenotypic evolution and disparity patterns between adult and juvenile triggerfishes. Although adult triggerfishes possess a diverse range of morphological forms, only a fraction of the adult diversity is characterized by traits such as low aspect ratio (AR) of median fins and a discoid body shape with deep ventral keels (Figs. 2 and 3). In contrast, these traits exemplify juvenile phenotypes. These particular morphological characteristics are likely advantageous for maneuverability and backward swimming, which are essential for foraging in structurally complex, demersal habitats found in coral and rocky reefs (Fulton et al. 2005; George and Westneat 2021). The observed phenotypes suggest that juveniles are well-suited for maneuverability, precise back-and-forth locomotion, and high burst swimming capabilities (Walker and Westneat 2002b), all of which are crucial for swimming in complex three-dimensional nursery habitats and for evading predators. As such, strong selection pressure for low AR fins may explain the observed differences in fin AR variation between adult and juvenile fishes.
Adult triggerfish possess lower incidence angles and higher AR than juveniles, and this shift in median fin morphology between juveniles and adults is also reflected in body shape changes (Figs. 2 and 3). However, the functional implications of these changes remain speculative. The variation of these morphological traits suggests some functional integration of the locomotor system similar to that observed in other fishes. For example, damselfishes (Pomacentridae) and wrasses (Labridae) are other MPF swimmers in reef ecosystems that developed a labriform swimming mode where they mainly use pectoral fins in a rowing or flapping motion for locomotion (Fulton 2007). In both families, there is a strong pattern of correlation between pectoral fin AR and the angle of pectoral fin attachment (AFA) (Wainwright et al. 2002; Aguilar-Medrano et al. 2013): species with low AFA generally present high AR, and they are generally found in open water, whereas species with high AFA present low AR are generally found close to the reef. For the pectoral fins, a low AFA favors the flapping motion that permits high speeds (i.e., rowing) while a high AFA allows front-back movements with high precision (i.e., flapping) (Walker and Westneat 2002b). In triggerfish, we observe the same type of correlative pattern between AR and incidence angles for median fins. Thus we hypothesize that a similar “rowing-flapping” axis of variation may exist for median fins, where incidence angles and AR are integrated features to optimize maneuverability in juveniles and some adults associated with structurally complex habitats or sustained swimming speed in adults living in open water.
Considering Alternate Macroevolutionary Pattern Between Ecophases
Many organisms exhibit variation in life stages. Recent research on Anurans has highlighted decoupled diversification dynamics and diverse evolutionary phenotypic patterns among ecophases of organisms with complex life cycles (Sherrat et al. 2017; Wollenberg Valero et al. 2017). However, ray-finned fishes have only recently become appreciated in this context. Our study suggests similar phenomena are at play in juvenile and adult triggerfishes. One possible explanation for the divergent evolutionary dynamics observed between juvenile and adult triggerfishes lies in environmental factors, particularly contrasting ecological niches. For example, the pronounced disparity in fin aspect ratios observed in adults could be associated with the extensive diversity of habitats available to triggerfishes (Fig. 1). Strong selective forces, including resource availability, competition, and predation, likely induce substantial shifts in the adaptive landscape of swimming performance, thereby promoting adaptive evolution of fin and body shapes. The early partitioning of disparity in adult phenotypes during evolution supports a scenario in which the emergence of the balistiform swimming mode facilitated rapid exploration of previously unoccupied niches in reef environments characterized by a mix of high and low flow regimes (Dornburg et al. 2011). Conversely, the evolutionary dynamics of morphological functional diversity in juveniles exhibit a slower rate of change, marked by expansions of morphospace among closely related taxa.
This pattern in juveniles aligns with expectations that nursery areas, with factors such as high prey density, low predator abundance, and complex habitat structure (Nagelkerken 2009), provide higher survival rates compared with offshore habitats. The clustering of fin aspect ratios and body shapes of triggerfish juveniles within morphospace suggests that subtle phenotypic variations or behavioral adaptations are sufficient for competing in these nursery environments, which experience distinct selective pressures compared with adult habitats. Although the absence of comprehensive data prevents rigorous testing, we hypothesize that juveniles initially exploited unoccupied ecological spaces where minimal phenotypic variation allowed for adaptation to various low-flow regime habitats. The morphological functional clustering observed in juveniles represents successful morphotypes adapted to complex nursery habitats characterized by low flow regimes that span rubble to sargassum mats. Subsequently, the recent phenotypic divergences observed among closely related taxa may reflect shifts toward new adaptive zones within an increasingly saturated space.
Lineage-specific differences in juvenile and adult disparity may be expected. However, our findings highlight the research potential of comparative investigations that integrate data from genotypes and phenotypes at different life stages. Such work is already underway, with recent studies revealing shifts in gene expression among larval, juvenile, and adult life phases in cichlid opsins (Carleton et al. 2008), changes in color and types of chromatophores between adult and juvenile dottyback fishes (Cortesi et al. 2016), as well as the impact of epigenetic mechanisms on phenotypic development (Hu and Albertson 2017) to name but a few. Moreover, in Anurans, adult and juvenile phenotypes have not only been found to evolve asynchronously but also exhibit expression of mutually exclusive sets of phenotype-coding genes between life stages (Wollenberg Valero et al. 2017). A similar finding has been documented in cichlids, that further revealed suites of divergent coexpressed genes that were present in early life stages prior to major phenotypic differentiation and that these became more during ontogeny (Fruciano et al. 2019). Given that ontogenetic disparity arises through processes that include allometric repatterning and variation of the rate of ontogenetic shape changes (Gould 1977; Eble 1998; Hall 1999), the ubiquity of fishes that undergo shifts from juvenile to adult forms, are promising candidates for future studies of gene expression profiles or genome-wide association studies between fish life stages. Such studies would help illuminate genetic mechanisms facilitating the evolution of phenotypic disparity spanning phases across the Tree of Life (Gaither et al. 2018).
The Effect of Size on Functional Morphology and Ecological Diversity
The influence of body size on swimming performance is undoubtedly significant. However, the variation of functional locomotor performance of coral reef fish groups during ontogeny remains understudied. Small fishes in open marine habitats tend to exhibit specific behaviors such as schooling to avoid predation (Magurran 1990). Triggerfishes are not known to exhibit schooling behaviors, which could render juveniles highly vulnerable to predation in open habitats. Small body size helps to hide in holes and crevices or to swim among seagrasses and algae, and such a cryptic behavior likely canalized the locomotor morphology of juveniles towards high maneuverability and burst performance. Finally, simply being small will decrease the distance traveled per fin flap, thereby requiring more energy. Currently, it is unclear how median fin function and locomotor mechanics might change with triggerfish size. Allometric relationships of physiological traits (e.g., atp-supplying enzymes, buffering capacity) in fish muscles exist and some of their impacts on locomotion have been highlighted (e.g., Somero and Childress 1990), raising the question of the extent to allometry affects swimming performance between adult and juvenile triggerfishes. A recent experimental study from George and Westneat (2019) analyzed and compared relatively small triggerfishes (i.e., post-juveniles with a size ranging from 6 to 12 cm), revealing strong differences in swimming performance among species. We might expect that the differences in swimming performances between juveniles and adults assessed from our comparative analysis based on morphological traits may be exacerbated by a scaling effect.
In addition to the impact of size, the morphological variation observed within ecophases of triggerfish is also likely related to differences in their ecological diversity (habitat uses, foraging activities) and associated swimming performances. We expect that the diversity of locomotor traits in juveniles reflects adaptive responses to predator avoidance, competition, and niche partitioning as assumed to be the case in adults (Dornburg et al. 2011; George and Westneat 2021). As suggested by numerous ecomorphological studies highlighting the relationship between the body morphology, the fin morphology, and the ecology of reef teleost fishes (e.g., Fulton and Bellwood 2002; Aguilar-Medrano et al. 2011, 2013), the morphological variation among triggerfish species at the juvenile stage might reflect the use of different nursery types, microhabitats, and/or prey resources. Although the feeding ecology of most juvenile triggerfishes has not been studied, the finding of both intraspecific conflict and changes in prey acquisition strategies between sympatric species (i.e., selective picking in juvenile Rhinecanthus versus blowing water onto sand to expose prey in juvenile Balistoides viridescens) support this hypothesis (Chen et al. 2001). Given that major changes in available prey resources occur between nurseries as disparate as mangroves, lagoons, and sargassum mats in pelagic environments, further fine-scale studies of juvenile triggerfishes within and across different nursery habitats are critically needed to assess whether nursery-specific ecological opportunities have canalized juvenile phenotypes.
Conclusions
Over the last 20 years, several studies have begun to reveal variation of disparity over ontogeny in various taxa, including molluscs (Gerber et al. 2007), teleost fishes (Zelditch et al. 2003; Frédérich and Vandewalle 2011), newts (Ivanović et al. 2007, Vučić et al. 2019), lizards (Urošević et al. 2013), and mammals (Sanfelice and De Freitas 2007). These studies illustrate that, with rare exceptions (Zelditch et al. 2003), adult stages are generally more disparate than younger stages. Our comprehensive study of triggerfishes supports this general pattern where the disparity increases over ontogeny at the level of a taxonomic group. However, the dynamics of selection vary significantly throughout ontogeny, and the heterogeneity in life history can lead to a decoupling of diversification patterns between different ecophases. Our findings provide support for a scenario where strong selection pressure during the juvenile life stage favors maneuverable body morphologies with high burst performance in low-flow regimes. It is only during the adult stage that the evolution of balistiform locomotion has likely played a crucial role in sustaining the ecomorphological diversification of adult phenotypes across a broader range of habitats and flow regimes (Dornburg et al., 2011). This raises the question of whether there are separate general rules of evolutionary diversification for the distinct life stages of coral reef fishes. We argue that ontogeny is certainly a relevant factor in the variation of morphospace occupation and evolutionary dynamics between juvenile and adult fishes and that further investigations are crucial for advancing our knowledge of biodiversity patterns and the mechanisms driving their emergence.
Supplementary Material
Data available from the Dryad Digital Repository: https://doi.org/10.5061/dryad.m37pvmd87 and from Zenodo: zenodo.org/record/5838141 (DOI: 10.5281/zenodo.5838141).
Acknowledgements
We thank G. Hogue and L. Roupe of the North Carolina Museum of Natural Sciences Ichthyology Research Unit for help with aspects of specimen preparation for this project, L. Rao for additional assistance with imaging, B. Stuart for equipment loans, and B. Sidlauskas for insightful conversations during the inception of this project. Finally, we want to warmly thank Michelle C. Gilbert, Frank Burbrink, Peter Wainwright, and one anonymous referee for their insightful comments and suggestions which greatly help to improve our work.
Author Contributions
A.D., R.W., F.S., B.F., and K.L.Z. conceived of the study. A.D., K.L.Z., H.A., J.F., and R.W. collected data. A.D., K.L.Z., and B.F. performed analyses. A.D. and B.F. wrote the initial draft of the manuscript. All other authors contributed to the writing and subsequent development of the manuscript.
Funding
This work was supported by an NSF GRFP research fellowship (0000-0002-5159-641X) to KLZ.
