


Abstract
Introgression allows polyploid species to acquire new genomic content from diploid progenitors or from other unrelated diploid or polyploid lineages, contributing to genetic diversity and facilitating adaptive allele discovery. In some cases, high levels of introgression elicit the replacement of large numbers of alleles inherited from the polyploid’s ancestral species, profoundly reshaping the polyploid’s genomic composition. In such complex polyploids, it is often difficult to determine which taxa were the progenitor species and which taxa provided additional introgressive blocks through subsequent hybridization. Here, we use population-level genomic data to reconstruct the phylogenetic history of Betula pubescens (downy birch), a tetraploid species often assumed to be of allopolyploid origin and which is known to hybridize with at least four other birch species. This was achieved by modeling polyploidization and introgression events under the multispecies coalescent and then using an approximate Bayesian computation rejection algorithm to evaluate and compare competing polyploidization models. We provide evidence that B. pubescens is the outcome of an autoploid genome doubling event in the common ancestor of B. pendula and its extant sister species, B. platyphylla, that took place approximately 178,000–188,000 generations ago. Extensive hybridization with B. pendula, B. nana, and B. humilis followed in the aftermath of autopolyploidization, with the relative contribution of each of these species to the B. pubescens genome varying markedly across the species’ range. Functional analysis of B. pubescens loci containing alleles introgressed from B. nana identified multiple genes involved in climate adaptation, while loci containing alleles derived from B. humilis revealed several genes involved in the regulation of meiotic stability and pollen viability in plant species.
Hybridization and whole genome duplication (WGD) shape evolution in many different ways, facilitating gene flow across distinct lineages (Albertin and Marullo 2012; Dasmahapatra et al. 2012; Ellstrand 2014; Mallet et al. 2016; Schmickl and Yant 2021), giving rise to new species (Dowling and Secor 1997; Ramsey and Schemske 1998; Mallet 2007; Rieseberg and Willis 2007; Soltis and Soltis 2009; Baack et al. 2015; Van de Peer et al. 2017), and fueling adaptive radiations (Seehausen 2006; Keller et al. 2013; Fontaine et al. 2015; Lamichhaney et al. 2015; Meier et al. 2017; Robertson et al. 2017). Homoploid hybridization, the formation of interspecific hybrids without a change in ploidy level, is widespread across many eukaryotic groups (Grant and Grant 1992; Mallet 2005; Meier et al. 2017), having been estimated to affect 25% of all vascular plants and 10% of animal species (Mallet 2005). Polyploids, species whose genome contains more than 2 complete sets of chromosomes, can arise via WGD within a single ancestral species (autopolyploids), or from hybridization between 2 different species concomitant with genome doubling (allopolyploids). Polyploidy is particularly prevalent in plants (Bowers et al. 2003; De Bodt et al. 2005; Wood et al. 2009; Amborella Genome Project 2013; Barker et al. 2016; Van de Peer et al. 2017) but evidence of ancient polyploidization events has been found also in many other eukaryotic lineages, including fungi (Wolfe and Shields 1997; Kellis et al. 2004; Ma et al. 2009), vertebrates (Dehal and Boore 2005; Braasch and Postlethwait 2012; Berthelot et al. 2014; Macqueen and Johnston 2014), arthropods (Nossa et al. 2014; Schwager 2017; Li et al. 2018a; Cerca et al. 2021), and ciliates (Aury et al. 2006).
While introgression and polyploidization are generally addressed in the literature as separate biological phenomena, the two processes are not mutually exclusive and often coexist in nature. The occurrence of gene flow from a diploid species to its polyploid descendant, mediated by viable triploid hybrids, was first hypothesized more than 60 years ago by Stebbins (1956), who further noted that interploidal gene flow was expected to be largely unidirectional (Stebbins 1971) with the polyploid species acting as an “allelic sponge” (Schmickl and Yant 2021). A growing body of evidence has emerged suggesting that polyploids can accumulate new alleles not only through introgression with diploid progenitors but also from other, more distant, diploid and polyploid lineages (Marhold and Lihová 2006; Kim et al. 2008; Arnold et al. 2016; Spoelhof et al. 2017; Baduel et al. 2018; Cheng et al. 2019; Marburger et al. 2019; Nieto Feliner et al. 2020; Seear et al. 2020; Schmickl and Yant 2021; Nibau et al. 2022). Introgression via triploid hybrids allows incipient outcrossing polyploids to alleviate the dearth of intraspecific sexual partners (Felber 1991; Ramsey and Schemske 1998; Husband 2004), and contributes to genetic diversity and adaptation (Kim et al. 2008; Slotte et al. 2008; Arnold et al. 2016; Hardigan et al. 2017; Schmickl et al. 2017; Spoelhof et al. 2017; Schmickl and Yant 2021). Recent studies show that introgression can also play an important role in the establishment of meiotic stability in nascent polyploids (Marburger et al. 2019; Seear et al. 2020; Nibau et al. 2022). Introgression involving non-parental species in the aftermath of polyploidization is well-documented in the Arabidopsis genus, where it mediates bidirectional gene flow between tetraploid A. arenosa and tetraploid A. lyrata (Jørgensen et al. 2011; Arnold et al. 2016; Hohmann and Koch 2017; Lafon-Placette et al. 2017; Marburger et al. 2019; Monnahan et al. 2019; Seear et al. 2020). Interploidal gene flow from (non-parental) diploids into tetraploid species has been reported to occur, for example, in bread wheat (Triticum aestivum; Cheng et al. 2019), in the Neobatrachus genus of Australian burrowing frogs (Novikova et al. 2020), among Miscanthus perennial grasses (Clark et al. 2015), and in the Rorippa genus of flowering plants (Bleeker and Hurka 2001; Bleeker 2003). Gene flow across species of different ploidy levels has also been observed in the Betula (Ashburner and McAllister 2013, pp. 65–75), Senecio (Kim et al. 2008), and Cardamine (Lihová et al. 2007) genera of flowering plants, but as their reticulate phylogenies remain partially unresolved it is currently not clear whether observed interploidal patterns of gene flow involve any diploid species other than the polyploid’s parental species. This situation, in turn, calls attention to one unintended consequence of the coexistence of polyploidization and introgression in a single species: although levels of introgression are frequently too low to mask the evolutionary origin of a polyploid, there are instances where its presence may severely interfere with attempts at clarifying its reticulate history.
Few taxa illustrate this predicament better than the birch genus (Betula spp.), a group containing several polyploids, high levels of interspecific hybridization, and whose phylogeny has long been marred by uncertainty (Järvinen et al. 2004; Li et al. 2005, 2007; Schenk et al. 2008; Wang et al. 2016, 2021). One tetraploid, in particular, B. pubescens, a monoecious, self-incompatible tree that is widespread across northern Eurasia has been a subject of considerable interest. The high levels of genetic diversity and allelic richness observed in B. pubescens are often presented as indirect evidence of allopolyploidization (Howland et al. 1995; Tsuda et al. 2017) since species originating via WGD are generally expected to have levels of genetic diversity in line with values observed in their diploid progenitors (Howland et al. 1995; Palmé et al. 2004; Truong et al. 2007; Tsuda et al. 2017, but see Truong et al. 2007 for arguments for an autopolyploid origin). While most authors tend to agree that B. pendula is most likely one of the ancestral parents (Walters 1968; Howland et al. 1995; Järvinen et al. 2004; Tsuda et al. 2017; Wang et al. 2021), the identity of the putative second parent has remained elusive, with different studies providing support for disparate hypotheses. These include B. nana (Järvinen et al. 2004; Tsuda et al. 2017), B. humilis or a closely related, possibly extinct, species (Walters 1968; Järvinen et al. 2004; Salojärvi et al. 2017; Tsuda et al. 2017), and B. platyphylla (Wang et al. 2021). As B. pubescens also hybridizes with most of these same species (Anamthawat-Jónsson and Tomasson 1990; Atkinson 1992; Thórsson et al. 2001; Palmé et al. 2004; Jadwiszczak et al. 2012; Wang et al. 2014; Eidesen et al. 2015; Zohren et al. 2016; Tsuda et al. 2017), this combination of polyploidization and extensive introgression makes B. pubescens a particularly difficult species to characterize phylogenetically.
In part, this problem stems from a lack of adequate phylogenetic inference tools. The inference of phylogenetic relationships among lineages that contain species of hybrid origin can be performed using specialized tools that explicitly take into consideration the reticulate nature of their phylogenies. However, most currently available tools have been developed either to quantify levels of interspecific hybridization (Bryant and Moulton 2004; Huson and Bryant 2006; Than et al. 2008; Pickrell and Pritchard 2012; Solís-Lemus et al. 2017; Wen et al. 2018; Zhang et al. 2018a) or to identify the parental species of a polyploid (Jones et al. 2013; Bertrand et al. 2015; Oberprieler et al. 2017; Oxelman et al. 2017; Lautenschlager et al. 2020; Rothfels 2021; Yan et al. 2022; Freyman et al. 2023; Leal et al. 2023)—but not both simultaneously. There are also methods that can be used to determine whether a polyploid originated via autopolyploidization or allopolyploidization (Chenuil et al. 1999; Roux and Pannell 2015; Winkler et al. 2017; Muñoz-Rodríguez et al. 2018), but again these assume relatively low levels of gene flow from additional species. Despite their success in unveiling the evolutionary history of many polyploids and homoploid hybrids, the methods listed above would struggle to disentangle polyploidization from introgression if faced with highly hybridized polyploids. In fact, to our knowledge, no method has yet been specifically developed to identify and quantify the genomic components of species that are the outcome of complex polyploidization: auto- or allopolyploids that were subsequently subjected to extensive introgression with one or more additional species (i.e., with species other than the polyploid’s parental species).
Here, we use a novel approach to disentangle introgression from polyploidization in order to determine the mode of origin and reconstruct the reticulate phylogeny of the highly hybridized polyploid B. pubescens. This is achieved by employing genomic polarization, a phasing algorithm that sorts gene copies in polyploids according to their evolutionary history (Leal et al. 2023), and by modeling polyploidization and introgression events under the multispecies coalescent. An approximate Bayesian computation (ABC) rejection algorithm is then used to evaluate and compare competing polyploidization models. We carried out an analysis of 1603 exonic sequences in 269 B. pubescens specimens collected from 23 locations along the species’ range. Our results provide new insights into the evolutionary origin of B. pubescens, its genomic composition, and the probable role of alleles introgressed from B. nana and B. humilis.
Materials and Methods
Conceptual Framework
Inference of the evolutionary history of the tetraploid B. pubescens was based on the phylogenetic analysis of multiple sequence alignments (MSAs), one for each locus, where the nucleotide sequence associated with B. pubescens has been polarized prior to tree inference. Genomic polarization is a recently developed iterative subgenome phasing algorithm for tetraploid species (Leal et al. 2023) that captures allelic variants in a polyploid species not present in a reference sequence, usually one of the other sequences present in the MSA. If the reference sequence coincides with one of the polyploid’s parental species, the polarized polyploid sequence shows high sequence identity with the second parental species, pairing with it during subsequent phylogenetic analysis.
Of particular interest to us, cumulative polyploid pairing patterns measured across hundreds of loci are expected to vary not only according to the reference sequence selected, but also to depend on the mode of polyploidization and levels of introgression (Fig. 1). For example, in the absence of introgression, a PPHH allopolyploidization model (where B. pendula and B. humilis are assumed to be the parental species) predicts pairing patterns where the tetraploid overwhelmingly pairs with B. humilis when B. pendula is used as the reference sequence, and vice-versa (Fig. 1a). Occasional pairing with non-parental species (peaks shown in light blue in Fig. 1) may also occur as a consequence of incomplete lineage sorting (ILS). Instead, the PPPP autopolyploid model (B. pendula as the sole parental species; no hybridization) predicts pairing patterns with a single peak observed for B. pendula, a pattern which remains invariant irrespective of the species used during polarization (Fig. 1b). The presence of introgression is expected to affect pairing patterns in both allo- and autopolyploids (Fig. 1c and d). The location of the extra peaks and their intensity provide clues as to the identity of the species with which the polyploid hybridizes, and the degree of introgression. By comparing observed polyploid pairing patterns with those obtained through polyploidization and introgression modeling, it should, therefore, become possible to not only source the different components of a polyploid’s genome but also to determine its evolutionary origin, that is, to establish which taxa were the original progenitor species, and which taxa provided additional introgressed genome blocks through subsequent hybridization.
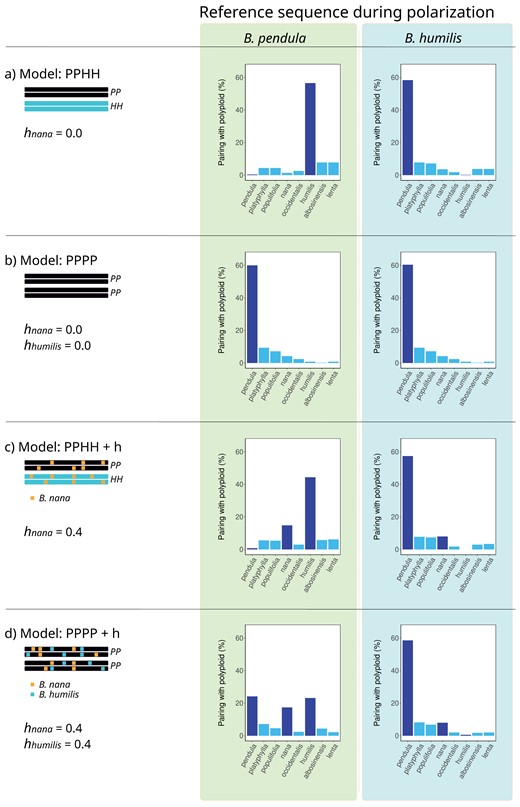
Schematic representation of polyploid pairing patterns for different polyploidization and hybridization models—Barplots show the frequency with which B. pubescens is expected to pair with other birch species, across multiple loci, for different evolutionary models and polarization settings. PP and HH indicate the hypothetical evolutionary origin of each subgenome component in the tetraploid (B. pendula and B. humilis, respectively, in the examples provided). Levels of introgressive hybridization are indicated by h.
Plant Material, DNA Isolation, Library Preparation, and Sequencing
Bud and leaf tissues were collected from natural populations for 300 birch individuals, 269 of which were subsequently identified as B. pubescens, 25 as B. pendula autotetraploids (4×), and 2 as triploid hybrids of different origin (see “Classification of Polyploid Specimens” section). Species and ploidy could not be conclusively determined for 4 samples. Some of these samples (44) were collected and sequenced as part of a previous study (Opgenoorth et al. 2021). Betula pubescens specimens were sampled from 23 locations across the species range, with a particular focus on Scandinavia (Supplementary Fig. S1, available on Dryad at https://doi.org/10.5061/dryad.5tb2rbp9f). Leaf material was also obtained from B. albosinensis, B. humilis, B. nana, and B. platyphylla specimens. See Supplementary Table S1 and Supplementary Materials 2 for further details.
Total DNA was extracted from bud and leaf tissues using a DNeasy Plant Mini Kit (Qiagen AG, Düsseldorf, Germany). Individual libraries were generated using the SeqCap EZ HyperCapWorkflow (Roche AG, Basel, Switzerland) using custom probes designed for targeted exome capture (TEC) and sequenced on paired-end mode (150 bp) on an Illumina NovaSeq 6000 platform (Illumina, San Diego, CA). Target resequencing was based on a custom probe design covering 1609 nuclear genes with a 3.2M bp cumulative target size and reduced sequence redundancy. See Supplementary Materials 1 for further details. Additional accessions were obtained from The European Nucleotide Archive (ENA, https://www.ebi.ac.uk/ena) for B. lenta, B. nana, B. occidentalis, B. pendula, B. platyphylla, B. populifolia, B. pubescens, Alnus glutinosa, Alnus incana, and a further 20 B. pendula specimens. Further details about each accession can be found in Supplementary Table S1 and Supplementary Materials 1 and 2.
Processing of Sequencing Libraries and Generation of MSAs
Read mapping and variant calling.
Sequenced reads were mapped to the B. pendula genome assembly, v Bpev01 (Salojärvi et al. 2017), using BWA-MEM (v 0.7.17) (Li and Durbin 2009). Chromosomal assignment of loci was performed on the basis of the B. pendula chromosomal map, v 1.4c (https://genomevolution.org/CoGe/GenomeInfo.pl?gid=35080, accessed 26 January 2023). Genotyping was performed with GATK 4.2.0.0 (McKenna et al. 2010). For all birch and alder accessions, including those obtained through WGS, only sites located within the 1603 nuclear loci covered by the exome probes were considered (6 of the targeted 1609 loci had very low coverage and were excluded). Sites located outside the targeted regions were excluded during downstream analysis. See Supplementary Materials 1 and 3 for further details.
Classification of polyploid specimens.
Betula pubescens and B. pendula specimens collected in the wild are often difficult to tell apart based solely on morphology (Ashburner and McAllister 2013, p. 232). Autotriploid and autotetraploid B. pendula variants have also been reported to occur under natural conditions (Johnsson 1944; Zohren et al. 2016). We classified each sample according to its ploidy level (2×, 3×, or 4×) by computing the ratio between the number of reads supporting the reference and alternate alleles at biallelic variant sites (distribution of read counts), as described previously in Yoshida et al. (2013) and Zohren et al. (2016); see Supplementary Materials 1 for further details. Results are shown in Supplementary Fig. S2 and Supplementary Materials 3.
Generation of consensus sequences and MSAs.
Consensus sequences were generated for each accession using bcftools consensus (v 1.12) (Danecek et al. 2021) by applying SNPs specific to each individual to the B. pendula reference assembly. Heterozygous sites were coded following the IUPAC nomenclature (Cornish-Bowden 1985). As only invariant sites and point mutations were used when producing each consensus sequence, consensus sequences associated with different samples are aligned by default: they all have the same length and retain identical start positions for each gene, and, therefore, require no further alignment (Leal et al. 2023). Separate MSAs were produced for each of the 1603 loci included in the analysis by splitting each consensus sequence using getfasta from the bedtools suite, based on the gff3 annotation file associated with the B. pendula reference assembly (Salojärvi et al. 2017). Each MSA contains 8 birch species (B. albosinensis, B. humilis, B. lenta, B. nana, B. occidentalis, B. pendula, B. platyphylla, and B. populifolia) and 2 alder species (A. glutinosa and A. incana). Additionally, each MSA contains a nucleotide sequence associated with 1 of the 269 B. pubescens samples included in this study, with each B. pubescens specimen and locus, therefore, being the subject of a separate phylogenetic analysis. See Supplementary Materials 1 for further details. In the MSAs used in the current study, all diploid species are represented by a single individual. As discussed elsewhere (Leal et al. 2023), while use of multiple individuals per species can, in some cases, help meliorate errors attributed to ILS during phylogenetic reconstruction (Maddison and Knowles 2006; McCormack et al. 2009; Heled and Drummond 2010), there is evidence that increasing the number of genes included in the analysis, as opposed to the number of samples, can produce similar or even better results (Rabiee et al. 2019).
Data Analysis
Genomic polarization.
Genomic polarization (Leal et al. 2023) of the focal B. pubescens nucleotide sequence was performed directly on each MSA before carrying out phylogenetic analysis (Supplementary Fig. S3). We performed independent polarizations based on 4 reference species: B. pendula, B. platyphylla, B. humilis, and B. nana. During polarization, the nucleotide sequence associated with the focal B. pubescens sample is scanned nucleotide by nucleotide, and variants at polymorphic sites found to also be present in the reference sequence are filtered out. This does not apply to sites in the focal B. pubescens sequence that are fixed, masked, or whose allelic composition exactly matches that observed in the reference sequence (in all 3 cases, the polarized sequence remains identical to the unpolarized B. pubescens sequence). Sites in the polarized sequence were recoded using the IUPAC nomenclature. Note that the terms reference sequence and reference genome have distinct meanings in the context of this paper. The former refers to the sequence in the MSA used as a reference during genomic polarization, while the latter refers to the B. pendula reference assembly used during read mapping, variant calling, and generation of consensus sequences.
Phylogenetic analysis.
Phylogenetic reconstruction of individual gene families was performed using maximum-likelihood as implemented in IQ-TREE2 v 2.0-rc2-omp-mpi (Minh et al. 2020). Polyploid pairing profiles were produced by counting the number of times the polarized polyploid species pairs with any of the other birch species included in the phylogeny, based on the analysis of individual gene trees (IQ-TREE2 output). This analysis was carried out independently for each of the 269 B. pubescens samples collected. Next, polyploid pairing profiles were generated for each population/location by averaging across all individuals in the population (Supplementary Fig. S3). See Supplementary Materials 1 for further details.
Population structure analysis.
Bayesian statistical inference of admixture levels between B. pubescens populations and different birch species was performed with STRUCTURE (v 2.3.4) (Pritchard et al. 2000), based on the analysis of 10,000 variant loci in 126 birch accessions. The presence of population genetic structure was also investigated using discriminant analysis of principal components (DAPC; Jombart et al. 2010) with adegenet (v 2.1.7), based on 50,000 variant loci belonging to 49 birch accessions. See Supplementary Materials 1 for further details.
Model Testing
In order to evaluate competing polyploidization models, we generated synthetic MSAs based on different polyploidization modes and levels of hybridization and compared their associated pairing profiles to those observed experimentally using an ABC rejection algorithm.
Polyploidization and hybridization simulations.
We produced synthetic MSAs where the focal polyploid, representing B. pubescens, was generated based on different polyploidization and hybridization models (Fig. 2 and Supplementary Fig. S3). We considered the following base polyploidization scenarios: PPPP, AAAA, PPNN, PPHH, PPNH, PPPyPy, AANN, AAHH, and AANH, where character pairs indicate the origin of each of the tetraploid’s subgenomes (Table 1). The first 2 cases (PPPP and AAAA) indicate an autopolyploid origin, while all other cases assume B. pubescens to be an allopolyploid. For each of these 9 models, we then simulate different scenarios where the polyploid gains new alleles through introgressive hybridization with one or more third species. During the modeling of introgression events, gene flow is restricted to tree tips. This assumes that ancient (immediately after B. pubescens speciation) levels of admixture were either negligible or well below recent gene flow levels, an assumption supported by demographic modeling results, also discussed in this article. We also ignore any hypothetical ancient polyploidization events, followed by diploidization, for any of the species considered, as there is no evidence of these having occurred in birch since the gamma paleohexaploid event (Salojärvi et al. 2017).
Polyploidization models.
| Model | Polyploidization mode | Parental species |
|---|---|---|
| 1: PPPP | auto | B. pendula |
| 2: AAAA | auto | Common ancestor of B. pendula and B. platyphylla |
| 3: PPNN | allo | B. pendula & B. nana |
| 4: PPHH | allo | B. pendula & B. humilis |
| 5: PPPyPy | allo | B. pendula & B. platyphylla |
| 6: PPNH | allo | B. pendula & B. nana—B. humilis homoploid hybrid |
| 7: AANN | allo | B. nana & common ancestor of B. pendula and B. platyphylla |
| 8: AAHH | allo | B. humilis & common ancestor of B. pendula and B. platyphylla |
| 9: AANH | allo | Common ancestor of B. pendula and B. platyphylla & B. nana—B. humilis homoploid hybrid |
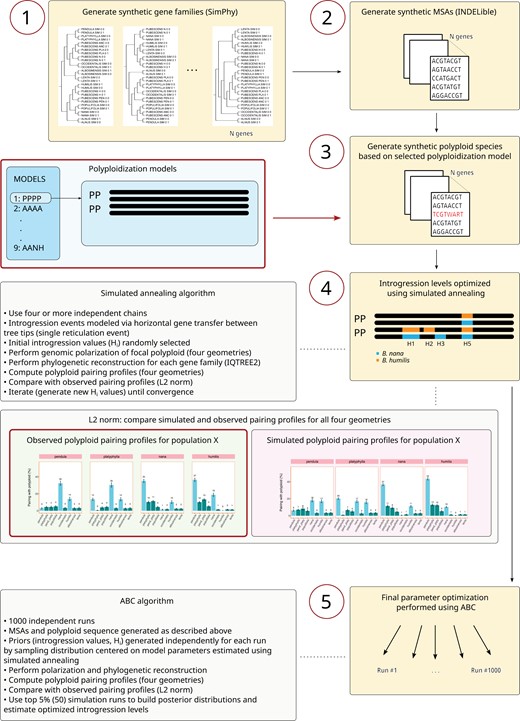
Model testing—Schematic representation of the pipeline used to generate the synthetic data and perform model optimization. Gene families created using SimPhy (step 1) were used to generate synthetic MSAs using INDELible (step 2). The polyploid was generated directly on the MSA by combining nucleotide sequences associated with the hypothetical parental species, based on a polyploidization model selected by the user (step 3). Initial model optimization of introgression levels (Hi) by one or more third species was performed using a simulated annealing algorithm (step 4). Gene flow was modeled through single reticulation events, one for each species with which the synthetic polyploid is assumed to hybridize. The L2 norm distance was used to compare observed and simulated polyploid pairing profiles. Final optimization of model parameters was done using an ABC framework based on 1000 independent simulation runs (step 5), with priors sampled from distributions centered on parameters previously estimated using the simulated annealing algorithm. See text for further details.
We used SimPhy (v 1.0.2) (Mallo et al. 2016), a phylogeny simulator based on the multispecies coalescent model, to generate gene family trees evolving under ILS (based on a species tree provided by the user). Initial simulation conditions were similar to those used by Zhang et al. (2018a) and Leal et al. (2023) to simulate a moderate ILS scenario. A homemade script (link provided at the end of the article) was used to further adjust (reduce) genus-wide levels of ILS. This allows for intermediate ILS scenarios (from “moderate” to no-ILS) to be easily explored during model optimization. When running SimPhy, the initial species-wide phylogeny was kept fixed and mimicked the observed Betulaceae tree for the species of interest, to which 5 extra branches were added: the allopolyploid’s putative ancestral species, and the species with which the allopolyploid can potentially hybridize (Supplementary Fig. S5). Two haploid individuals were created per species. Twenty-five independent replicates were simulated for each of the 5 polyploidization scenarios, each containing 50 gene families, producing a grand total of 1250 gene families per model. Substantially lowering the number of synthetic gene families greatly reduces the accuracy and reproducibility of the simulations, while vastly expanding it incurs a severe penalty in terms of computation time during model optimization.
We generated synthetic MSAs for each gene family using INDELible (v 1.03) (Fletcher and Yang 2009) based on the gene trees created with SimPhy. Mean nucleotide sequence length and standard deviation were set to 1500 and 100 bp, respectively. Sequence lengths above 1000 bp are generally recommended in order to minimize gene tree estimation errors during phylogenetic reconstruction based on synthetic data (Mirarab et al. 2016; Zhang et al. 2018b). For exact simulations conditions, see Leal et al. (2023).
Once the MSAs were generated, the two haploid individuals belonging to the same species were used to create diploid individuals, and the allopolyploid was created using the nucleotide sequences associated with the two hypothetical parental species (e.g., “ANCESTRAL N” and “ANCESTRAL PEN” in Supplementary Fig. S5). For each gene in the tetraploid assumed to have undergone introgressive hybridization (such loci were selected randomly), one of the putative ancestral species was replaced by the sequence associated with the species with which the tetraploid hybridizes. Diverse evolutionary scenarios can therefore be simulated by selecting different parental pairs, the identity of one or more hybridizing species, and hybridization levels. All putative ancestral sequences (H, N, PLA, PEN, and ANC) were dropped from the MSA prior to phylogenetic inference. Genomic polarization of the synthetic B. pubescens sequence and the subsequent phylogenetic analysis of individual gene families with IQ-TREE2 were performed under the same exact conditions used to process the experimental data (described above). This ensures that biases induced during genomic polarization and subsequent steps (if any) would affect the observed and synthetic data in a similar fashion. All genes from all replicates (1250 genes) were used during the analysis of polyploid pairing patterns.
When modeling the allopolyploidization process, it was assumed that alleles obtained through introgression can be shared across subgenomes (as opposed to being confined to a particular subgenome). While bivalent pairing is predominant during meiotic prophase I in B. pubescens (Brown and Al-Dawoody 1979), observation of segregation patterns revealed that this species exhibits polysomic inheritance (Stern 1965), suggesting that genetic recombination can occur between homoeologous chromosomes associated with different subgenomes.
Model evaluation.
Evaluation of each of the 9 base polyploidization models was done in two steps. Initial parameter optimization was performed using simulated annealing. An ABC rejection algorithm (Tavaré et al. 1997; Beaumont et al. 2002; Beaumont 2019) was subsequently used to estimate posterior parameter distributions for each model. Polyploid pairing profiles observed experimentally for four polarization geometries (polarization performed using B. pendula, B. platyphylla, B. nana, and B. humilis as reference sequences) and across different sampling locations were compared with those produced using simulated data, with the aim of identifying the model that best reproduces the experimental observations across the species range (Fig. 2 and Supplementary Fig. S3). Polyploid pairing frequencies obtained for the 4 polarizing geometries used therefore constitute our summary statistics. The number of model parameters varied between 7 and 11, depending on the polyploidization model (Supplementary Fig. S6). Most model parameters (Hi) represent fractions of the genome associated with a specific evolutionary history. Two extra parameters were used to model genus-wide levels of ILS and the level of secondary gene flow and/or ancestral shared polymorphisms between B. pendula and B. platyphylla. Allopolyploid systems (models 3–9) were simulated under two different conditions, either precluding or allowing for the possibility of homoeologous exchange.
Initial optimization of model parameters, performed separately for each of the nine polyploidization models and for different populations, was carried out using a simulated annealing algorithm with 4 independent chains and randomized start model parameters (Fig. 2 and Supplementary Fig. S3). Convergence for each chain was established by initially running 1000 iterations and then stopping the algorithm when the number of steps without any further improvement in the L2 norm distance reaches 500 (generally, no improvement is observed after the initial 1000 iterations). The weighted L2 norm distance was used to evaluate the degree of agreement between simulated (ysim) and observed (yobs) polyploid pairing frequencies:
with weights ωi set to 5 for the highly variable genomic components (pairing with B. pendula, B. platyphylla, the B. pendula/B. platyphylla clade, B. nana, and B. humilis), and to 1 in all other cases. Weights were chosen in order to increase L2 sensibility to the highly variable genomic components while accounting as well for background polyploid-pairing values associated with other birch species or to multiple-species clades (e.g., when the polarized polyploid is an outgroup to the {B. pendula, B. platyphylla, B. populifolia} clade). All 4 polyploid pairing profiles are included when computing the L2 norm distance, each containing 15 spectral components, yielding a grand total of 60 normalized summary statistics.
Final parameter estimation was performed using ABC. Batches of 1000 simulation runs were generated for each model/location with priors sampled from a truncated (2 standard deviations) normal distribution centered on the best model parameters determined using simulated annealing and a 2–4 percentage points standard deviation (depending on the spread between chains after the simulated annealing step). For each model and location, posterior distributions for each model parameter were estimated based on the top 5% (50) simulation runs with the lowest L2 norm distance. Finally, estimates for the levels of introgression (hnana, hhumilis) were produced for each model on the basis of the optimized Hi model parameters. Link to scripts used to perform simulated annealing and ABC is provided at the end of the article. The best polyploidization model was selected by identifying the model that consistently best reproduces observed pairing patterns across the B. pubescens species range by incurring only plausible local adjustments on the level of hybridization with one or more third species.
Demographic Modeling
The speciation time for B. pubescens was estimated using coalescent simulations with fastsimcoal2 (v 2.7.0.9) (Excoffier et al. 2013), based on B. pendula, B. platyphylla, and B. pubescens SNP data. Only B. pubescens loci containing 4 gene copies of either B. pendula or B. platyphylla ancestry were included in the analysis (any locus containing one or more gene copies of B. nana or B. humilis ancestry in any of the B. pubescens samples included was filtered out). This ensured that B. pubescens loci included in the coalescent analysis all derived from B. pendula, B. platyphylla, or their common ancestor. In order to minimize data loss due to locus filtering, we sampled only 4 B. pubescens tetraploids and 8 diploids for each of B. pendula and B. platyphylla. The unfolded multidimensional site frequency spectrum (SFS) contained both intronic and 4-fold degenerate biallelic sites with a minimum sequencing depth of 8× observed in all samples. Four-fold degenerate sites were identified using SnpEff (v 5.0) (Cingolani et al. 2012). Maximum-likelihood inference of the ancestral allele used when building the SFS was performed with est-sfs (v 2.04) (Keightley and Jackson 2018), using B. pendula as the focal species and B. populifolia, B. nana, and B. occidentalis as outgroups. Separate multidimensional SFS were created based on different B. pubescens populations (Central Europe, Southern Sweden, Central Asia, and Spain). The speciation time for B. pubescens was estimated separately for each B. pubescens population. See Supplementary Materials 1 for further details on model selection and optimization.
Geographic Distribution and Functional Analysis of Alleles of B. nana and B. humilis Ancestry
The fraction of B. pubescens individuals in a population containing alleles of B. nana or B. humilis origin was computed separately for each of the 1603 genes included in the analysis. Such allelic variants were identified using the genomic polarization protocol (IQ-TREE2 output), as detailed above. Only MSAs containing at least 100 parsimony-informative sites were included in the analysis (see “Phylogenetic Analysis: Detailed Description” in Supplementary Materials I). For this particular analysis, and in order to minimize local genetic bias (family effects), each (meta-)population includes all individuals from two or more sampling sites within a certain geographic area but located hundreds of kilometers apart. The only exception is the Southwestern European population (ES), which includes samples from a single location. K-means cluster analysis was used to partition B. pubescens loci containing alleles of B. nana or B. humilis ancestry in groups with a similar abundance profile across geographic locations. See Supplementary Materials 1 for further details.
As it is common practice when working with non-model plant species, functional annotation of B. pubescens/B. pendula genes was based on the annotation of homologous genes in the Arabidopsis thaliana model species. We used the association file between A. thaliana and B. pendula genes (based on sequence similarity) released with the B. pendula reference assembly (Salojärvi et al. 2017). Functional annotation for A. thaliana genes was obtained from the Swiss-Prot collection of manually curated (reviewed) genes listed in the Uniprot database (https://www.uniprot.org/uniprotkb?facets=reviewed%3Atrue&query=%28taxonomy_id%3A3701%29, downloaded 27 October 2022).
Results
The Proportion of the Humilis and Nana Genomic Components in B. pubescens Varies Across the Species Range
Analysis of the genomic composition of tetraploid B. pubescens specimens was performed using the genomic polarization framework (see “Materials and Methods” section and Leal et al. (2023)). Observed pairing patterns for the polarized polyploid, evaluated across hundreds of loci, suggest that at least three species have contributed to the B. pubescens genome either as parental species during polyploidization or as a consequence of subsequent introgression: B. pendula, B. nana, and B. humilis (Fig. 3a). The contribution of each of these species varies widely across the B. pubescens distribution range (Fig. 3a and b and Supplementary Fig. S7). The nana genomic component is highest in Arctic regions, decreasing progressively as we move toward lower latitudes (Fig. 3b and Supplementary Fig. S7). The humilis genomic component is more uniform across the B. pubescens range, with a maximum value in Central Asia, and below average values in Southern Europe (Fig. 3b and Supplementary Fig. S7). While the nana and humilis components are both reduced in specimens collected in Southern Europe (Fig. 3b and Supplementary Fig. S7d), they are nonetheless still clearly observed, unlike in tetraploid B. pendula samples where their presence is vestigial and mostly in line with background ILS levels (Supplementary Fig. S8). This suggests that the Southern European population, while unique among the populations included in this study, retains genomic characteristics generally found in other B. pubescens populations. Using the B. pendula chromosome map as a reference, we also checked whether B. pubescens loci containing only alleles of B. pendula origin varied across samples and whether they were concentrated in specific genomic regions. The location of B. pubescens loci fixed for the pendula allele varied from sample to sample and was generally distributed across the whole genome (Supplementary Materials 4).
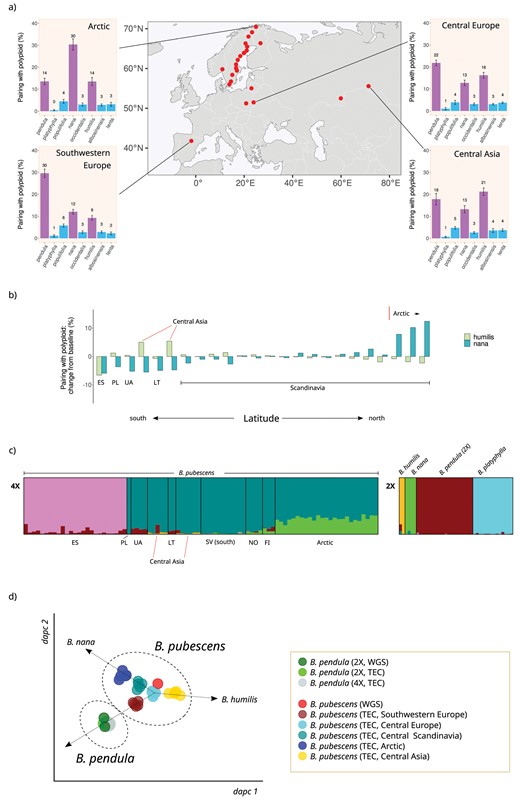
Betula pubescens genomic composition and population structure—(a) Barplots show the frequency with which the polarized B. pubescens sequence pairs with other birch species during phylogenetic inference at 4 different locations across the B. pubescens species range, based on phylogenetic analysis of individual gene families using IQ-TREE2. Betula platyphylla was used as the reference sequence during genomic polarization. Red dots indicate B. pubescens sampling locations. (b) Variation in polyploid pairing frequencies between polarized B. pubescens and B. humilis (light green) or B. nana (dark green) measured across sampling locations, compared to the baseline value, the average pairing frequency across all locations. Betula platyphylla was used as the reference sequence during genomic polarization. (c) Estimated genetic admixture of 126 individuals belonging to 5 Betula species according to STRUCTURE analysis based on 10,000 variant loci and K = 6. Each individual is represented by a vertical column. Data for diploid (2×) and tetraploid samples (4×) are shown separately to facilitate interpretation. Data for tetraploid samples are sorted by latitude from left (south) to right (north). Population identifiers (based on Supplementary Fig. S1): ES (site 1), PL (2), UA (3), CA-west (22), LT (4), CA-east (23), SV-south (7), NO (5), FI (21), Arctic (20). The number of optimal clusters, as determined using the ln Pr(X|K) method, is 6 (Supplementary Fig. S10). (d) DAPC plot for 49 birch accessions based on 50,000 variant loci. Betula pendula and B. pubescens are represented by both whole genome sequencing (WGS) and TEC accessions. Betula pubescens groups are as follows: Southwestern Europe (site 1), Central Europe (2, 3, 4), Central Scandinavia (17), Arctic (20), and Central Asia (22, 23).
Complementing the results presented above, we also performed the analysis of a subset of B. pubescens specimens using STRUCTURE, an approach used in previous studies to evaluate the level of admixture between this polyploid and other birch species (Wang et al. 2014; Eidesen et al. 2015; Zohren et al. 2016; Tsuda et al. 2017). The STRUCTURE analysis differentiates different B. pubescens populations (Fig. 3c and Supplementary Figs. S9 and S10) but, unlike the phylogenetic analysis based on polarized genomic sequences (Fig. 3a and Supplementary Fig. S7), it provides no hint that all B. pubescens specimens across the species range contain large genomic components of B. nana and B. humilis origin. Population structure was also investigated using DAPC. In the resulting plot, individual B. pubescens populations are distributed along a tri-axis (Fig. 3d and Supplementary Fig. S11), with the Central Scandinavian and Arctic populations showing a heightened nana contribution, the Central Asia population being shifted towards B. humilis, and the Southwestern European samples being closer to the B. pendula cluster.
Polyploidization and Hybridization Modeling Gives Support to an Autopolyploid Origin for B. pubescens in the Absence of Homoeologous Exchange
We appraised the ability of nine hypothetical B. pubescens polyploidization models (Table 1) to explain observed polyploid pairing patterns across the species’ range (shown in Fig. 3a and Supplementary Fig. S7) using an ABC rejection algorithm (Fig. 2). We proceeded in two steps. First, we excluded the possibility of full homoeologous replacement in any of the allopolyploid models, namely that gene copies initially found in one of the subgenomes could attain fixation. We then run a second set of simulations where we allowed for homoeologous replacement.
Upon comparison with the observed data for a B. pubescens population in Southern Sweden (Fig. 4 and Supplementary Fig. S12), the best fit (weighted L2 norm distance = 0.49 ± 0.01) was obtained when B. pubescens was assumed to be an autopolyploid which originated via WGD from the common ancestor of B. pendula and its sister species, B. platyphylla (Model 2: AAAA). Optimized levels of introgression for Model 2 were hnana = 0.41 ± 0.03 and hhumilis = 0.34 ± 0.02, suggesting that, post-polyploidization, gene flow from B. nana and B. humilis have replaced at least one gene copy in 41% and 34% of all loci, respectively, in B. pubescens specimens in Southern Sweden. Levels of introgression are predicted to be even higher for B. pendula, whose alleles are present on average in 79% of all loci in the B. pubescens genome.
![Comparison of B. pubescens evolutionary models—Barplots show the frequency with which the polarized B. pubescens sequence pairs with other birch species, for different evolutionary models and polarization settings, based on phylogenetic analysis of individual gene families using IQ-TREE2. P, N, H, Py, and A indicate the hypothetical evolutionary origin of each subgenome component in the tetraploid (B. pendula, B. nana, B. humilis, B. platyphylla, and the common ancestor of B. pendula and B. platyphylla, respectively). Modeling data summarizes optimized results [top 5% simulation runs (50 out of 1000 runs)], obtained using ABC using the observed values in a population from Southern Sweden as a reference (top row). Each simulation run averages results over 25 independent replicates. Cyan bars indicate the level of polyploid-pairing for the 3 key species (see text for details). Bars in red indicate discrepancies between predicted and experimental results higher than 5 percentage points. The weighted L2 norm distance measures the goodness of fit and includes data for all 4 polarizations (lower L2 values denote a better fit). L2 values are based on extended pairing spectra shown in Supplementary Figure S12. pend_platy indicates instances when the polarized polyploid sequence is an outgroup to the pendula–platyphylla clade. See Supplementary Figure S12 for modeling results for Models 6-9.](https://oup.silverchair-cdn.com/oup/backfile/Content_public/Journal/sysbio/73/2/10.1093_sysbio_syae012/2/m_syae012_fig4.jpeg?Expires=1750218180&Signature=hHlUBhiS25bw-GkcdSvLJVFgcVB6Dvy~nX87OeisocNbszWLfx27txuPdLYOKAKPWnT0Myza5CyLJlk0T1P5UUMcu4Lq3fpWX2w6zSMrqpa17pwgQ7cVE3fhn6msOfuOEZp6asBgbo06XGEx09gyrlvnarwtA7aZvl6FZ9xPETOc3dnPSoOhkW7rx~8BmrkLqcklkYKXjItiZn4P5Q60ZhGY2AvWxpEpQBiRjQVhtLEek978VvaTC00T79XG0zrjO5puashUmUf4ttpqRQ0GS-SNeeaL1vvWaRciy8hIn6AGxvLun0AoeG0tYiC~ML0Qoq0iP3YyvILM6AdntQPM5w__&Key-Pair-Id=APKAIE5G5CRDK6RD3PGA)
Comparison of B. pubescens evolutionary models—Barplots show the frequency with which the polarized B. pubescens sequence pairs with other birch species, for different evolutionary models and polarization settings, based on phylogenetic analysis of individual gene families using IQ-TREE2. P, N, H, Py, and A indicate the hypothetical evolutionary origin of each subgenome component in the tetraploid (B. pendula, B. nana, B. humilis, B. platyphylla, and the common ancestor of B. pendula and B. platyphylla, respectively). Modeling data summarizes optimized results [top 5% simulation runs (50 out of 1000 runs)], obtained using ABC using the observed values in a population from Southern Sweden as a reference (top row). Each simulation run averages results over 25 independent replicates. Cyan bars indicate the level of polyploid-pairing for the 3 key species (see text for details). Bars in red indicate discrepancies between predicted and experimental results higher than 5 percentage points. The weighted L2 norm distance measures the goodness of fit and includes data for all 4 polarizations (lower L2 values denote a better fit). L2 values are based on extended pairing spectra shown in Supplementary Figure S12. pend_platy indicates instances when the polarized polyploid sequence is an outgroup to the pendula–platyphylla clade. See Supplementary Figure S12 for modeling results for Models 6-9.
The pendula autopolyploid model (Model 1: PPPP) provided the second-best overall fit (weighted L2 norm distance = 0.74 ± 0.01). The deterioration in the L2 error observed when using this model was due to its inability to properly predict the pendula genomic contribution, which was inflated for one of the polarization geometries (peak highlighted in red in Figure 4). The best 2 models, AAAA and PPPP, contain the lowest number of model parameters (see Supplementary Fig. S6), meaning that, within a comparative model framework, overfitting should not be a major concern. However, as the AAAA model contains more parameters than the second-best model, we performed a separate analysis using demographic modeling (see “Dating of B. pubescens origin” section) that confirmed that B. pubescens is likely to have first emerged in the sequence of a WGD event in the common ancestor of B. pendula and B. platyphylla (AAAA model).
All the allopolyploid models provided much worse fits, with predicted polyploid-pairing profiles for the three key species (B. pendula, B. nana, and B. humilis) showing major discrepancies when contrasted against the observed data (Figs. 4 and 5a and b). Unlike the autopolyploidization models, where the nana and humilis genomic contributions can be adjusted independently, in the B. pendula/B. nana and B. pendula/B. humilis allopolyploid models, the phylogenetic signals from nana and humilis genomic components show an inversely proportional dependency: a progressive reduction in the B. nana peak was observed as hhumilis values are increased, and vice-versa (dashed line in Fig. 5a). A similar dynamic was observed in the remaining allopolyploid models.
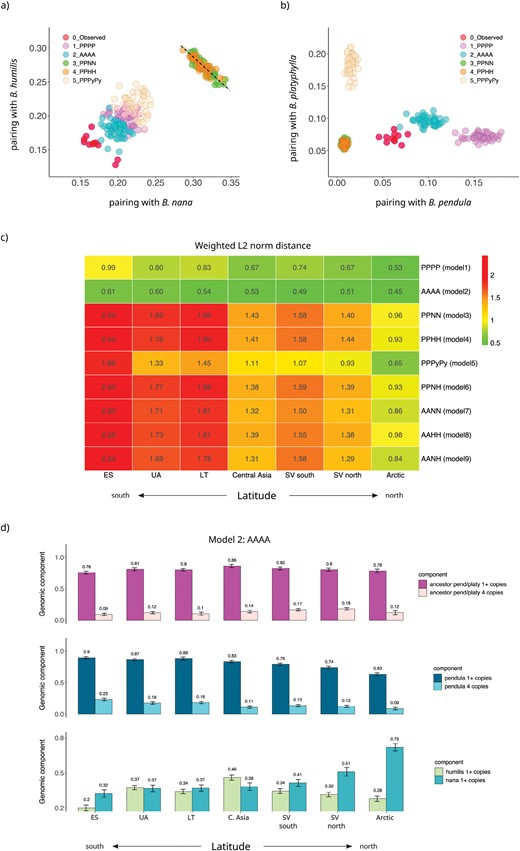
B. pubescens evolutionary models’ predictive power—Frequency with which the polarized B. pubescens sequence pairs with (a) B. nana and B. humilis and (b) B. pendula and B. platyphylla, as predicted by different evolutionary models, based on phylogenetic analysis of individual gene families using IQ-TREE2. Values observed experimentally for a population in Southern Sweden are shown in red. For each model, data are shown for the top 5% simulation runs with the lowest L2 norm distance. Values are based on phylogenies obtained when B. platyphylla (a) or B. pendula (b) was used as the reference sequence during polarization. Each simulated data point summarizes runs for 25 independent replicates. The dashed line is a guide to the eye. (c) Weighted L2 norm distance, averaged over the top 5% simulation run, for different models and sampling locations. Lower L2 values denote a better fit. Betula pubescens population groups are as follows (based on Supplementary Fig. S1): ES (site 1), UA (3), LT (4), Central Asia (23), SV South (7), SV North (17), and Arctic (20). (d) Betula pubescens genomic composition as a function of sampling location estimated using the AAAA autopolyploid model. “1+ copies”: percentage of loci with at least one gene copy originating from the common ancestor of B. pendula and B. platyphylla (top), B. pendula (center), B. humilis, or B. nana (bottom). “4 copies”: percentage of loci where all 4 gene copies originate from the common ancestor of B. pendula and B. platyphylla (top), or B. pendula (center).
The AAAA autopolyploid model outperforms all other models not only when applied to the Southern Sweden B. pubescens population but also in all other populations across the species range (Fig. 5c). Polyploid pairing predictions based on the AAAA autopolyploid model for seven geographic locations covering the B. pubescens range reveal a high degree of accuracy when compared with observed values (Supplementary Fig. S13). The B. pubescens genomic composition estimated using the AAAA model suggests that, depending on geographic location, 63–90% of all loci contain at least one gene copy of B. pendula origin, and that in 9–23% of the genome all 4 gene copies are of B. pendula ancestry (Fig. 5d). Rampant gene flow from parental diploids has been previously observed in other diploid-autotetraploid complexes such as in A. arenosa (Arnold et al. 2015; Monnahan et al. 2019). The simulation results also confirmed that the nana genomic component follows a latitude cline (Fig. 5d), while the percentage of loci in B. pubescens harboring alleles of B. humilis origin is relatively stable along the species range and reaches its highest value in Central Asia (Fig. 5d). In spite of the high levels of gene flow from multiple birch species, modeling results suggest that the B. pubescens genome retains a large fraction of ancestral alleles, with 76–86% of all loci containing alleles inherited from the common ancestor of B. pendula and B. platyphylla (Fig. 5d).
Allotetraploid Models That Include Homoeologous Exchange All Converge Towards the Autopolyploid Hypothesis
To establish whether the presence of homoeologous replacement could allow any of the allopolyploid models to match or surpass the autopolyploid models in their ability to fit the data, we ran a new set of simulations where homoeologous replacement was permitted. When homoeologous replacement was allowed, all 7 allopolyploid models converged toward genomic configurations similar to the ones obtained for the autopolyploid models (Supplementary Table S2). In Models 3–6, the non-pendula subgenome was greatly abridged, first due to homoeologous replacement by the pendula subgenome and, in Models 3–5, by further introgression with a third species. A similar pattern was observed in allopolyploid models where one of the two subgenomes originated from the common ancestor of B. pendula and B. platyphylla (Models 7–9). Under this hypothetical scenario, the extent of homoeologous replacement was estimated to affect between 29% (PPPyPy model) and 39% (PPNH model) of the B. pubescens genome. Predicted levels of homoeologous replacement by the nana, humilis, or platyphylla subgenomes in allopolyploid models were only vestigial and never exceed 3% (Supplementary Table S2).
Dating of B. pubescens Origin
To date the origin of B. pubescens, we used fastsimcoal2 to fit demographic models to SNP data for {B. pubescens, B. pendula, B. platyphylla} population trios. The analysis was carried out separately for 4 different B. pubescens populations in Central Europe, Southern Sweden, Central Asia, and Southwestern Europe. We started by testing simple evolutionary models based on all possible phylogenetic relationships among the three species included. Model comparison based on Akaike weights unanimously identified the ((B. pendula, B. platyphylla), B. pubescens) model as the most likely phylogeny (Supplementary Table S3), providing further evidence that B. pubescens first emerged before B. pendula and B. platyphylla diverged and evolved as distinct species. Next, we optimized the best phylogenetic topology by testing all possible migration combinations (129 models). As before, this analysis was done independently for different B. pubescens populations and Akaike weights were used to identify the model that best fits the data. The same exact migration model was deemed to best fit the data independently of the dataset used (Supplementary Materials 5), with modeling based on the Central European B. pubescens population providing the best overall fit (highest estimated maximum likelihood). Values estimated based on this dataset indicate that B. pendula and B. platyphylla diverged about 100,000 generations ago (Fig. 6), that is, about 2.5 Ma based on a 25-year generation time, in agreement with previous estimates (2.6 Ma; Chen et al. 2021). Gene flow from B. pendula into B. pubescens was estimated to be at least one order of magnitude higher than gene flow from B. platyphylla (Fig. 6). Betula pubescens was estimated to have diverged from the common ancestor of B. pendula and B. platyphylla about 180,000 generations ago (Fig. 6), with parametric bootstrapping indicating a 95% confidence interval between 178,659 and 188,529 generations (Supplementary Table S4).
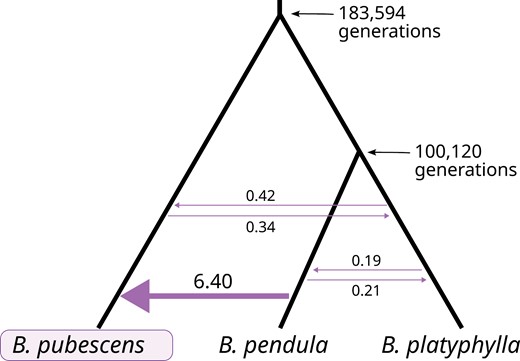
Phylogenetic topology and MLE of model parameters obtained using fastsimcoal2. Mean divergence times (in generations) and number of introgression events (per generation) estimated for migration model with the highest Akaike weight. Only B. pubescens loci containing 4 gene copies of B. pendula and/or B. platyphylla ancestry were included in the analysis (loci containing one or more gene copies originating from B. nana or B. humilis were excluded).
Identification and Functional Analysis of Introgressed Alleles of B. nana and B. humilis Ancestry
The geographic distribution and potential biological role of alleles of B. nana and B. humilis origin were examined separately for each gene. Of the 524 loci included in this study whose associated MSAs contain at least 100 parsimony-informative sites, 425 different genes were tagged as having an allele of B. nana ancestry in at least one B. pubescens individual (457 and 470 genes were tagged as containing alleles of B. humilis and B. pendula origin, respectively). For many of these genes, the fraction of individuals within a population possessing introgressed alleles remained in the low single digits across the B. pubescens geographic range (Fig. 7 and Supplementary Materials 6). On the other hand, there were 105 genes where the fraction of individuals with an allele of B. nana parentage reached 65% or more in at least one population (“highly retained alleles” hereafter). There were 61 and 290 genes with highly retained alleles of B. humilis and B. pendula ancestry, respectively. Among the loci studied, only one contained solely alleles inherited from the common ancestor of B. pendula and B. platyphylla in all the individuals sampled, and only two loci contained exclusively alleles of B. pendula origin (Supplementary Table S5). Many other loci contain alleles originating from B. pendula (Supplementary Materials 6), which have progressively replaced those of ancestral origin, but it is unclear whether their pervasiveness is due to selective pressure or simply a consequence of incessant gene flow between two species with largely overlapping geographic ranges.
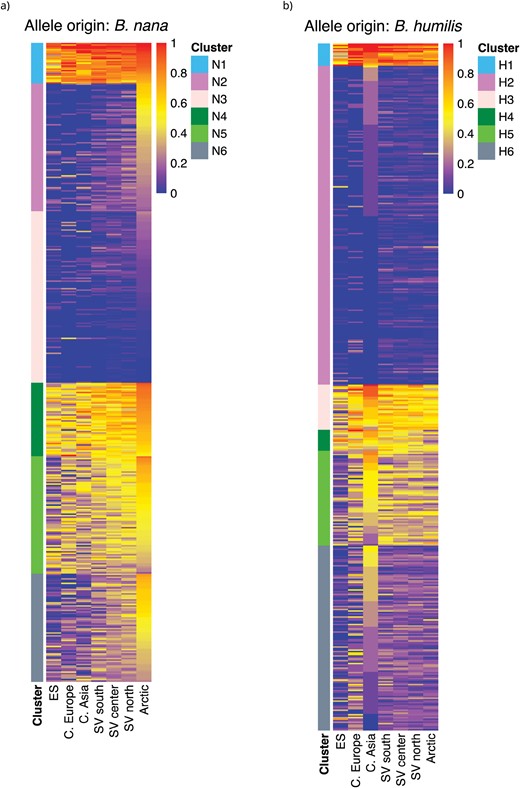
Abundance profiles for B. pubescens allelic variants of B. nana and B. humilis origin—Heatmaps show fraction of B. pubescens individuals in different populations (columns) containing an allele of (a) B. nana or (b) B. humilis origin, for different genes (rows). K-means cluster analysis was used to partition genes in groups with similar abundance profiles across sampling locations. The analysis identified 6 clusters (N1–N6) for alleles of B. nana origin, and 6 clusters (H1–H6) for alleles of B. humilis origin.
Gene flow from B. nana and B. humilis into B. pubescens is generally more geographically localized. Alleles of B. nana or B. humilis origin preserved across the B. pubescens geographic range are, therefore, of particular interest as they are likely candidates for gene variants that provide a fitness advantage. As expected, geographic distributions of introgressed B. nana and B. humilis alleles vary depending on the species of origin. Many highly retained alleles of B. nana ancestry show a clinal or quasi-clinal dependency with the highest prevalence being observed in Arctic regions, but there is a second group of genes where nana alleles are found in most individuals in most populations (Figs. 7a and 8a and c). As for alleles of B. humilis origin, while the largest group consists of alleles mostly found in Central Asia, one can find a sizable number of alleles highly retained across all populations, as well as some showing a clinal dependency (Figs. 7b and 8b and c).
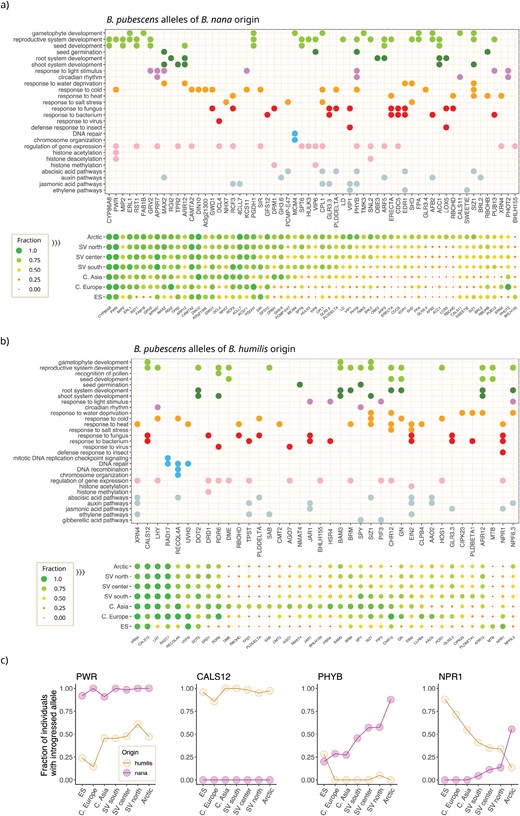
Functional analysis of B. pubescens allelic variants of B. nana and B. humilis origin—Gene ontology (GO) annotation of genes associated with retained allelic variants of (a) B. nana and (b) B. humilis origin. Symbol colors represent broad GO categories (e.g., biotic defense responses are shown in red). The fraction of individuals in a population carrying an introgressed allele is also shown for each gene and geographic location. Data are shown only for genes with a nana and/or humilis allelic fraction ≥0.65 observed in at least one population and for which a GO annotation is available. (c) Fraction of individuals with introgressed alleles observed across different populations for homologs of the following Arabidopsis genes: POWERDRESS (PWR), CALLOSE SYNTHASE 12 (CALS12), Phytochrome B (PhyB), and REGULATORY PROTEIN NPR1 (NPR1). Betula pubescens population identifiers (based on Supplementary Fig. S1): Arctic (sites 18, 19, 20); SV north (14, 15, 16, 17); SV center (9, 10, 11, 12, 13); SV south (6, 7, 8); Central Asia (22, 23); Central Europe (2, 3, 4); and ES (1).
A more striking difference between alleles of B. nana and B. humilis ancestry concerns their purported functional role. Many of the loci containing highly preserved alleles derived from B. nana are believed to code for genes involved in response to cold and/or light stimulus in plants, including homologs of PWR, PRR7, MAX2, CAMT2, DIN10, GWD1, and KCS11 (Fig. 8a and Table 2). Additionally, an allele of B. nana origin in Phytochrome B (PhyB), the primary red-light photoreceptor for circadian control in Arabidopsis and which also functions as a temperature sensor (Somers et al. 1998; Jung et al. 2016; Legris et al. 2016), shows a marked clinal distribution, with its prevalence varying from 20% in Southern Europe to 88% in the Arctic (Fig. 8c). Among highly retained alleles of B. humilis ancestry, we found a gene known to be involved in gametophytic fertility in plants, CALS12 (Fig. 8b and Table 2). A humilis CALS12 allele was detected in 97.0% of all B. pubescens specimens sampled (Fig. 8c), suggesting that this gene is under strong selective pressure. Highly preserved alleles obtained from B. humilis are also found within three genes involved in DNA repair and maintenance of meiotic stability: RECQL4A, UVH3, and RAD17 (Fig. 8b and Table 2).
Selected B. pubescens loci containing highly retained alleles of B. nana or B. humilis origin.
| Gene/protein (A. thaliana nomenclature) | Overall prevalence (% of all B. pubescens specimens sampled) | Function |
|---|---|---|
| Selected alleles of B. nana origin | ||
| CYP86A8 (Cytochrome P450) | 99.3 | Involved in synthesis of lipid-polyester used in the seed coat to prevent embryo aging and ensure seed longevity in A. thaliana (Renard et al. 2020) |
| PWR (Powerdress) | 98.5 | Co-regulates both flowering time and leaf senescence in A. thaliana (Chen et al. 2016; Kim et al. 2016); part of a histone-modifying complex that epigenetically controls freezing tolerance (Lim et al. 2020). |
| CAMTA2 (Calmodulin-binding transcription activator 2) | 92.9 | Regulation of cellular response to cold in Arabidopsis (Kim et al. 2013). |
| KCS11(3-ketoacyl-CoA synthase 11) | 85.5 | Regulation of cellular response to cold in Arabidopsis (Joubès et al. 2008). |
| APRR7(Two-component response regulator-like APRR7) | 91.4 | Involved in phasing of the circadian clock and control of seedling deetiolation (Kaczorowski et al. 2003). |
| MAX2(F-box protein MAX2) | 83.3 | Positive regulator of photomorphogenesis (Shen et al. 2007). |
| DIN10 (Dark inducible 10) | 93.7 | Regulation of cellular response to cold in Arabidopsis (Maruyama et al. 2009). |
| GWD1(Starch excess 1) | 78.1 | Regulation of cellular response to cold in Arabidopsis (Yano et al. 2005). |
| PhyB(Phytochrome B) | Clinal dependency; highly retained in Arctic population (88%) | Primary red-light photoreceptor for circadian control in Arabidopsis (Somers et al. 1998), functions as a temperature sensor (Kim et al. 2002; Jung et al. 2016; Legris et al. 2016), and regulates flowering time and seed germination (Seo et al. 2006; Hajdu et al. 2015). |
| Selected alleles of B. humilis origin | ||
| CALS12(Callose synthase 12) | 97.0 | Plays role in pollen development and fertility in Arabidopsis, being involved in the synthesis of the callose wall separating microspores after meiosis (Enns et al. 2005). |
| XRN4 (Exoribonuclease4) | 94.4 | Part of a mRNA decay pathway involved in plant acclimation to heat stress (Merret et al. 2013) |
| RECQL4A(ATP-dependent DNA helicase Q-like 4A) | 74.5 (100% in Central Asia and Central Europe) | Contributes to the maintenance of genomic stability in A. thaliana by modulating the response to DNA damage, suppressing spontaneous somatic crossovers, and limiting the number of crossovers during meiotic recombination (Bagherieh-Najjar et al. 2005; Hartung et al. 2008; Séguéla-Arnaud et al. 2015). Is also required for dissolving telomeric bridges between non-homologous chromosomes during meiosis (Higgins et al. 2011). |
| RAD17 (Cell cycle checkpoint protein) | 95.5 | Encodes a checkpoint protein that is part of a DNA damage response pathway induced by genotoxic stress in yeast, mammals, and Arabidopsis (Zhou and Elledge 2000; Bao et al. 2001; Heitzeberg et al. 2004). |
| UVH3 (DNA repair protein) | 81.7 (100% in Central and Southwestern Europe) | Encodes an endonuclease involved in the repair of UV-damaged DNA in Arabidopsis (Liu et al. 2001). |
| LHY (Late elongated hypocotyl) | 95.2 | Circadian clock gene involved in the regulation of flowering time and freezing tolerance in Arabidopsis (LHY; Fujiwara et al. 2008; Dong et al. 2011). In Picea abies specimens sampled in Sweden, there is a strong clinal preference for different LHY alleles which matches changes in environmental conditions (Li et al. 2022). |
| NPR1 (Nonexpresser of PR genes 1) | Clinal dependency; highly retained in Southern European population (88%) | Salicylic acid (SA) transducer and a key regulatory gene of the systemic acquired resistance (SAR) pathway activated in plants upon local infection by microbial pathogens (Cao et al. 1994). There is evidence of balancing selection acting on NPR1 to maintain two allelic classes in A. thaliana (Caldwell and Michelmore 2009) and in Capsella grandiflora (Sicard et al. 2015), likely due to functional differences between alleles. |
Discussion
Evidence for an Autopolyploid Origin for B. pubescens
Here, we present a Bayesian framework that can be used to establish the mode of origin of a complex polyploid by disentangling the two key evolutionary mechanisms at play, clarifying whether alleles of diverse origin have been acquired through polyploidization, introgression, or both. Our results suggest that B. pubescens is most likely the offspring of a single parental species, the common ancestor of B. pendula and B. platyphylla, which gave rise to it via WGD, with the newly formed autopolyploid having subsequently undergone extensive introgressive hybridization with B. pendula, B. nana, and B. humilis. This assertion is supported by comparisons of real and simulated polyploid frequency pattern data, with the autopolyploidization model providing the best overall goodness-of-fit and closest match to the observed polyploid-paring patterns across all populations. Demographic modeling using fastsimcoal2 also provided strong support for a phylogeny where B. pubescens speciation occurred prior to B. pendula and B. platyphylla evolved as separate species. Pervasive introgression from B. pendula, B. nana, and B. humilis would provide a plausible explanation for the high levels of allelic richness and genetic diversity observed in B. pubescens, which until now had been interpreted as indirect evidence of allopolyploidization.
Attempts to model the origin of B. pubescens based on a bi-parental allopolyploidization model produced contrasting results depending on whether homoeologous replacement was allowed to occur or not. In the absence of homoeologous replacement, allopolyploid models invariably produced scenarios that failed to replicate the polyploid-pairing patterns observed experimentally, leading to a degradation in L2 values, as they all struggled to accurately predict the genomic contribution of a hypothetical second parental species. When homoeologous replacement was allowed to occur between subgenomes, the performance of allopolyploid models was in line with their autoploid counterparts, but the level of structural dominance required (affecting up to ~39% of the B. pubescens genome) is unheard-of in established allopolyploids. This is discussed in more detail in the next section.
A Hypothetical Allopolyploid Origin for B. pubescens Would Require Massive Levels of Homoeologous Replacement
Modeling results shown in this paper suggest that a hypothetical allopolyploid origin for B. pubescens would be possible—though unlikely—if it had been followed by subsequent homoeologous exchanges resulting in B. pendula (or the ancestral B. pendula/B. platyphylla allele) dominating both subgenomes in about 35% of all protein-coding regions (with all gene copies from the second subgenome having been lost). While frequently observed in allopolyploid species, homoeologous replacement usually affects a relatively small fraction of genes in naturally formed polyploids. In the Gossypium hirsutum “TM-1” cotton cultivar, an allotetraploid estimated to first have emerged 1.5 Ma, Li et al. (2015) identified 1790 out of 35,056 genes (~5%) present in the At subgenome that were transferred from the Dt subgenome. In the allotriploid “FenJiao” banana cultivar (Musa ssp.), homoeologous exchanges from the A to the B subgenome were identified in 39 genomic segments containing 2579 genes (out of 35,148 ~ 7%; Wang et al. 2019). In B. napus, a recent (7500–12,500 years BP; Chalhoub et al. 2014) allotetraploid and model organism for the study of genome restructuring and homoeologous exchange in neo-polyploids (Gaeta and Pires 2010; Chalhoub et al. 2014; Sun et al. 2017; Lloyd et al. 2018; Xiong et al. 2021), expression analysis of the “Yudal” cultivar showed that 1076 (2%) out of the ~49,000 coding genes present in the Cn subgenome have been replaced by their homoeologous An subgenome duplicates (Lloyd et al. 2018). Similar levels of Cn to An homoeologous replacement (1032 genes ~ 2%) have been observed in the “ZS11” B. napus cultivar (Sun et al. 2017). In the allotetraploid Coffee arabica, homoeologous loss was detected in less than 2% of the genome (Lashermes et al. 2016; Salojärvi et al. 2023). Levels of homoeologous replacement in the neo-allotetraploid A. suecica (~16,000 years BP; Novikova et al. 2017) are also rather subdued, involving at most a few hundred genes (Burns et al. 2021; Jiang et al. 2021), likely because the two parental species, A. thaliana and A. arenosa, are divergent enough (~6 Ma) to prevent homoeologous exchange.
To our knowledge, rampant homoeologous replacement has only been observed in newly resynthesized allopolyploids (Chalhoub et al. 2014; Wu et al. 2021; Xiong et al. 2021) and in (very) recently formed natural allopolyploids such as the Tragopogon miscellus salsify, a biennial plant whose origin dates to the early 1900s after both diploid progenitors were introduced in North America from Europe (Chester et al. 2012). Here, we estimated that B. pubescens first emerged about 180,000 generation ago (4.5 Ma, assuming a 25-year generation time), therefore, ruling out the possibility of it being a polyploid of recent origin. In short, while we cannot fully rule out an allopolyploid origin for B. pubescens, such a possibility seems very unlikely as it would require levels of homoeologous replacement that far exceed values so far observed in natural allotetraploid populations.
Ecogeographical Variation in B. nana and B. humilis Introgression Levels
There is evidence that introgression into B. pubescens is both an ancestral and on-going phenomenon, occurring whenever the species involved coexist in the same geographic area. Evidence gathered from genetic, morphological, and compatibility studies point to the presence of on-going gene flow from B. humilis, B. nana, and B. pendula into B. pubescens in Western Eurasia and from B. ermanii in East Asia (Jeffers 1971; Anamthawat-Jónsson and Tomasson 1990; Atkinson 1992; Thórsson et al. 2001; Anamthawat-Jónsson and Thórsson 2003; Palmé et al. 2004; Jadwiszczak et al. 2012; Ashburner and McAllister 2013; p. 68; Wang et al. 2014; Eidesen et al. 2015; Zohren et al. 2016; Tsuda et al. 2017). This is supported by our study showing that, although average introgression levels are very high across the species’ range, the identity of most introgressed alleles varies across individuals, even within the same local population, implying that many of them are likely being acquired stochastically via de novo introgression. Concurrently, we identified a small set of alleles of B. nana and B. humilis origin whose presence is widespread across one or more B. pubescens populations. These highly retained introgressed alleles are located on different B. pubescens chromosomes, and may have been acquired during or soon after speciation, either because they themselves provided a selective advantage and hence were driven to high frequencies by selective sweeps, or alternatively because they are in linkage with other genes under selective pressure, or due to genetic drift acting in a small budding population.
Our results further suggest that, at the present time, B. pubescens populations located in two distinct zones, the Arctic and Central Asia, serve as the species’ major reservoirs for alleles of B. nana and B. humilis origin, respectively, arguably because these are locations where the species involved are abundant and live in sympatry (Ashburner and McAllister 2013, pp. 27–28). However, many of the birch species that hybridize with B. pubescens can also hybridize among themselves, as well as with several other birch species (Jeffers 1971; Atkinson 1992; Palmé et al. 2004; Jadwiszczak et al. 2012; Ashburner and McAllister 2013; pp. 62–71; Koropachinskii 2013; Tsuda et al. 2017), implying that each of them can act as a genetic bridge or conduit (McDonald et al. 2008; Grant and Grant 2020) for many of the others. It is, therefore, possible that some of the introgressed alleles of B. nana or B. humilis origin found today in B. pubescens might have been obtained via a bridge species, and not directly from B. nana or B. humilis, altogether sidestepping the sympatry requirement.
Betula pubescens Loci Containing Alleles of B. nana Origin Are Involved in Climate Adaptation in Plants
One of the benefits of introgression is that it expands the pool of alleles available in a population upon which natural selection can act, often leading to phenotypic novelty and potentially facilitating adaptation to new environments (Rieseberg et al. 1999; Whitney et al. 2006; Dasmahapatra et al. 2012; Pardo-Diaz et al. 2012; Rius and Darling 2014; Arnold et al. 2016; Schmickl et al. 2017). Introgression of biotic resistance traits from a congener is believed to have enabled the southward range expansion of Helianthus annuus, a sunflower found in North America (Whitney et al. 2006). Interspecific genetic admixture has also been associated with a sudden increase in cold tolerance in the wasp spider Argiope bruennichi (Krehenwinkel and Tautz 2013), with the spread of the autotetraploid A. arenosa into more extreme habitats characterized by frequent drought and phytotoxic levels of metals (Arnold et al. 2016), and the expansion of the poplar Populus trichocarpa into colder and drier climates (Suarez-Gonzalez et al. 2018).
Here, we identified several regulatory genes associated with abiotic stress in plants that contained alleles of B. nana origin obtained via introgression. These include homologs of PWR, CAMTA2, DIN10, GWD1, and KCS11. While we can only speculate whether such derived alleles contribute to local adaptation and range expansion in B. pubescens, their retention by most individuals sampled across the species range suggests that they could be located in genomic regions under selective pressure, warranting further investigation. PWR is known to co-regulate both flowering time and leaf senescence in A. thaliana (Chen et al. 2016; Kim et al. 2016) and to be part of a histone-modifying complex that epigenetically controls freezing tolerance (Lim et al. 2020), while CAMTA2, DIN10, GWD1, and KCS11 are all involved in the regulation of cellular response to cold in Arabidopsis (Yano et al. 2005; Joubès et al. 2008; Maruyama et al. 2009; Kim et al. 2013). In northern Eurasia, B. pubescens and B. nana have geographic ranges that extend further north than that of B. pendula (Atkinson 1992; de Groot et al. 1997), and the acquisition and retention of new alleles associated with cold acclimatization from B. nana could be one of the factors contributing to the cold tolerance of northern populations of B. pubescens.
We also found a cline in the frequency of the PhyB nana allele in B. pubescens, with the allele decreasing in frequency from 88% in the Arctic to 20% in Southwestern Europe. This gene is located in a region of low relative genomic diversity in B. pendula, which was associated with a selective sweep (Salojärvi et al. 2017). PhyB is known to modulate flowering time in A. thaliana (Hajdu et al. 2015) and has been shown to regulate bud set and seasonal growth in Populus (Ingvarsson et al. 2008; Ding et al. 2021). Changes in the PhyB amino acid sequence can lead to differential plant responses to light (Filiault et al. 2008), and it has been speculated that intraspecific diversification among phytochromes might allow a species to adjust its life cycle to different climates (Jung et al. 2016). The presence of introgressed allelic variants of B. nana origin showing a clinal dependency, while congruent with an adaptive role, could also be caused by the stochastic loss of neutral alleles diffusing away from the contact zone (Barton and Hewitt 1989), or by changes in the spatial range for any of the species involved (Excoffier et al. 2009; Zohren et al. 2016). While the high prevalence of the PhyB nana allele in Arctic regions is a strong indication that it is located in a genomic region under strong selective pressure, further studies are required to elucidate whether changes in allelic frequency for this and other introgressed alleles in birch are the outcome of selection, drift, or both.
Betula pubescens Loci Containing Alleles of B. humilis Origin Are Known to Regulate Meiotic Stability and Pollen Viability in Plant Species
How new polyploids regulate meiotic chromosomal segregation is one of the key issues hinging over their long-term genomic stability and gamete viability (Comai 2005; Cifuentes et al. 2010; Bomblies et al. 2015; Lloyd and Bomblies 2016; Baduel et al. 2018; Morgan et al. 2021; Bomblies 2023). Recent results suggest that some plant species attain this competence by co-opting adaptive alleles obtained via introgression from one or more third species. There is evidence that bidirectional gene flow between the autotetraploids, A. arenosa and A. lyrata, provided the latter with a set of pre-adapted alleles in genes that regulate the synaptonemal complex between homologous chromosomes during meiosis, favoring a reduction in multivalent formation, and which are located in loci that had previously been found to be under strong selection in both species (Yant et al. 2013; Marburger et al. 2019; Seear et al. 2020). Likewise, in the allotetraploid A. suecica, which has A. thaliana and the autotetraploid A. arenosa as parental species, there is evidence that key meiotic genes harbor allelic variants acquired from diploid A. arenosa (Nibau et al. 2022).
In this paper, we identified two meiosis genes in the tetraploid B. pubescens, RECQL4A and RAD17, that contain alleles acquired from B. humilis. Additionally, we identified another locus associated with gametophyte development, CALS12, which appears to be under strong selection in B. pubescens as specimens sampled across the species range all contained an allele of B. humilis origin. In Arabidopsis, CALS12 is part of a pathway that synthesizes the tetrad callose wall separating the 4 microspores during cytokinesis (Enns et al. 2005) and silencing or misregulation of this gene has been shown to negatively impact male fertility in both Arabidopsis and rice (Oryza sativa) mutant lines (Enns et al. 2005; Shi et al. 2015; Li et al. 2018b). In rice and maize, loss of RAD17 in pollen mother cells often causes sterility as it leads to non-homologous chromosome entanglement and chromosomal fragmentation (Hu et al. 2018; Zhang et al. 2021). In A. thaliana, RECQL4A is part of one of the 3 anti-crossover pathways that strictly limits the number of crossovers during meiotic recombination (Séguéla-Arnaud et al. 2015; Serra et al. 2018) and is required for resolving and dissolving telomeric bridges between non-homologous chromosomes during meiosis (Higgins et al. 2011). Reduction in crossover rates helps to limit multivalent prevalence during meiosis, which may have implications for the long-term viability of a species as high rates of multivalent formation are often associated with low fertility and aneuploidy in neo-autopolyploids (Ramsey and Schemske 2002; Bomblies et al. 2015; Lloyd and Bomblies 2016). Bivalent formation with random partner choice (tetrasomic inheritance) is prevalent in B. pubescens (Stern 1965; Brown and Al-Dawoody 1979), with the rate of multivalent formation reported to be lower than that observed in diploid B. pendula (Brown and Al-Dawoody 1979). While further research will be required to fully elucidate the specific impact of introgressed alleles on development and fitness, the results here presented raise the enticing possibility that the acquisition of new adaptive alleles from B. humilis assisted B. pubescens in decreasing rates of multivalent formation, improving meiotic stability and gametophytic fertility.
A Step Towards Solving the Origin-Introgression Riddle in Polyploid Species
In this article, we used genomic polarization and a Bayesian framework to address an old phylogenetics problem, namely, how to untangle polyploidization from introgression in order to determine the mode of origin and genomic composition of a complex polyploid. The results here presented also showcase the method’s ability to unearth the identity and provenience of introgressed alleles, which in conjugation with known information about their functional role, can be used to chart future research directions. The methodology here described can be easily extended to other polyploid species whose reticulate history remains debatable—often due to the confluence of polyploidization and introgression—in the birch (Wang et al. 2021), Asteraceae (Mandel et al. 2017), Salix (Wagner et al. 2020), Senecio (Kim et al. 2008), and Cardamine (Lihová et al. 2007) genera of flowering plants, among other.
A Model-Based Approach to Phylogenomics: A Few Considerations
While the framework here presented opens a new venue for exploring the origins of highly hybridized polyploids, there remains space for development and improvement. At the present time, the phasing approach here employed, genomic polarization, has only been used on tetraploids (Leal et al. 2023), and further testing and modeling might be required before it can be applied to higher ploidy levels.
In the current implementation, introgression events are modeled via horizontal gene flow among tree tips. This approach seemingly overlooks the possibility of ancient gene flow, including events that might have occurred across internal branches (prior to speciation for any of the species included in the analysis). While ancient genetic admixture was not explicitly included in the model here employed, this should be implemented in cases where previous observations hint at its presence. One way to assess whether ancient gene flow plays an important role in the evolutionary history of a species or genus is to perform demographic modeling, for instance using composite likelihood (e.g., fastsimcoal2 (Excoffier et al. 2013)) or ABC (e.g., DILS (Fraïsse et al. 2021)). Such complementary modeling can also act as an umpire when deciding between competing hypotheses with almost similar explanatory power, as done in this paper.
In the modeling approach here employed, levels of ILS are assumed to be relatively uniform across the genus of interest. There are cases, however, where this approach may not suffice. For example, in the A. arenosa group, which includes diploid and autotetraploid A. arenosa, there is evidence of large-scale ancient shared polymorphisms involving a more basal species, A. croatica (Koch and Matschinger 2007; Hohmann et al. 2014; Koch 2019). If not modeled properly, localized high levels of incongruence between gene trees and the species tree could act as a confounding factor during phylogenetic reconstruction (Blischak et al. 2018).
In the polyploidization model discussed in this article, we discounted the possibility of any of the diploid species included in the analysis being the offspring of an ancient polyploidization event followed by diploidization, as there is no evidence of these having occurred in birch since the gamma paleohexaploid event (Salojärvi et al. 2017). More sophisticated modeling simulators, such as the AlloDT simulator associated with AlloppNET (Jones et al. 2013), can be used to explore scenarios that could include, for instance, the possibility of ancient polyploidization followed by one or more speciation events.
Within the framework described here, the set of polyploidization models being tested is defined by the user. This is a common approach in population genetics. For instance, demographic modeling using ABC (Beaumont et al. 2002), ∂a∂i (Gutenkunst et al. 2009), fastsimcoal2 (Excoffier et al. 2013), or momi2 (Kamm et al. 2020) is performed by testing one or more evolutionary models that must be pre-defined. An inherent risk of a model-based approach is that it may fail to fully capture the evolutionary path of the system under study. In the case-study discussed in this article, we tested all evolutionary hypotheses mentioned in the literature and included a few more that seemed plausible to us. It cannot be ruled out that the origins of B. pubescens entailed a more complex set of evolutionary steps, for instance involving the formation of a homoploid hybrid, prior to polyploidization, with a species with no extant representatives. However, the best polyploidization model found through our algorithm (an autopolyploidization event in the common ancestor of B. pendula and B. platyphylla) fits well the observed data for all populations tested, is congruent with levels of introgression reported previously between this species and B. nana and B. humilis, and provides a convincing explanation for additional observations that had in the past been used to justify an allopolyploid origin for B. pubescens, such as the high levels of genetic diversity observed in this polyploid species. It is our opinion that, unless there are new observations that contravene a simple autopolyploid origin for B. pubescens, parsimony dictates that between hypotheses of identical explanatory power, a simple model is preferable to a more complex one, everything else being equal.
supplementary material
Data available from the Dryad Digital Repository: https://doi.org/10.5061/dryad.5tb2rbp9f
Acknowledgments
The computations were performed on resources provided by the Swedish National Infrastructure for Computing (SNIC) at the Uppsala Multidisciplinary Center for Advanced Computational Science (UPPMAX) under Project # SNIC 2017/7-149 and at the High Performance Computing Center North (HPC2N) under Project # SNIC 2020/9-84.
Conflict of Interest
None declared.
Funding
This work was supported by the Swedish Research Council for Sustainable Development (FORMAS) (grant numbers 2016-00780, 2020-01456) to M.L. and by the European Union’s Horizon 2020 Research and Innovation Programme under grant agreement no. 676876 (Project GenTree).
