


Abstract
Growing evidence linked inflammation with sleep. This study aimed to evaluate the associations and causal effects of sleep traits including insomnia, excessive daytime sleepiness (EDS), and sleep duration (short: <7 h; normal: 7–9 h; long: ≥9 h), with levels of C-reactive protein (CRP), tumor necrosis factor-alpha (TNF-α), and interleukins.
Standard procedures of quantitative analysis were applied to estimate the expression differences for each protein in compared groups. Then, a two-sample Mendelian randomization (MR) analysis was performed to explore their causal relationships with published genome-wide association study summary statistics. The inverse-variance weighted was used as the primary method, followed by several complementary approaches as sensitivity analyses.
A total of 44 publications with 51 879 participants were included in the quantitative analysis. Our results showed that the levels of CRP, interleukin-1β (IL-1β), IL-6, and TNF-α were higher from 0.36 to 0.58 (after standardization) in insomnia compared with controls, while there was no significant difference between participants with EDS and controls. Besides, there was a U/J-shaped expression of CRP and IL-6 with sleep durations. In MR analysis, the primary results demonstrated the causal effects of CRP on sleep duration (estimate: 0.017; 95% confidence intervals [CI], [0.003, 0.031]) and short sleep duration (estimate: −0.006; 95% CI, [−0.011, −0.001]). Also, IL-6 was found to be associated with long sleep duration (estimate: 0.006; 95% CI, [0.000, 0.013]). These results were consistent in sensitivity analyses.
There are high inflammatory profiles in insomnia and extremes of sleep duration. Meanwhile, elevated CRP and IL-6 have causal effects on longer sleep duration. Further studies can focus on related upstream and downstream mechanisms.
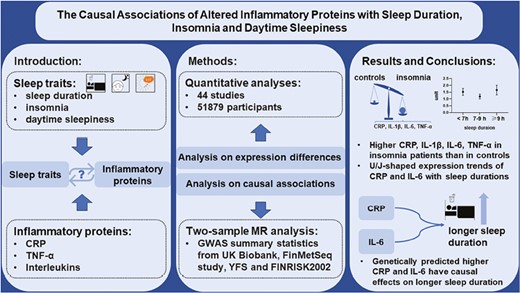
The relationships between several sleep traits and high inflammation conditions are elusive. Here, we combined the methods of quantitative analysis and Mendelian randomization analysis to explore the associations and causal effects of sleep traits of insomnia, sleepiness, and sleep duration with 11 inflammatory proteins. We demonstrated higher C-reactive protein (CRP), interleukin-1β (IL-1β), IL-6, tumor necrosis factor-alpha (TNF-α) in insomnia patients, and U/J-shaped expression trends of CRP and IL-6 with sleep durations. Besides, we found genetically predicted higher CRP and IL-6 have causal effects on longer sleep duration probably through different mechanisms. These findings could provide potential research directions for future inflammatory mechanisms in sleep.
Introduction
Sleep occupies nearly one-third of life and relates to several human systems including the immune [1], endocrine [2], and circulatory systems [3], etc. Insomnia, excessive daytime sleepiness (EDS), and extreme sleep duration show high prevalence and affect about 10%–20% [4], 8.5%–22% [5], and 55% [6] of the general population, respectively. Insomnia is a common sleep disorder defined as difficulty in initiating or maintaining sleep with associated symptoms [4]. EDS is a key symptom of some sleep disorders such as obstructive sleep apnea, insomnia, and central hypersomnolence disorder [7]. Whereas sleep duration is a sleep health issue, which can be used to assess the quantity of sleep [8]. These sleep traits show good representativeness among various sleep domains [9, 10]. Once these sleep traits are established, it is associated with cardiometabolic diseases [11–14], cognitive impairment [15], diabetes [16] and all-cause mortality [17, 18]. Identifying risk factors and understanding potential mechanisms for these traits show significance in improving both sleep and relevant healthy outcome.
Emerging studies have strongly suggested that abnormal inflammation conditions may be an underrecognized factor in these sleep traits. In teenagers, a healthy immune profile is linked to moderate sleep duration [19], while an increase in circulating inflammation markers such as interleukins, C-reactive protein (CRP), and tumor necrosis factor-alpha (TNF-α) have been found in extremes of sleep duration [19]. Also, high levels of CRP, interleukins, and TNF-α are associated with EDS [20] and insomnia [21]. Moreover, in response to long-term stress such as inflammatory disease states, the originally normal sleep function may be adapted into a dysfunctional status like longer sleep duration [22, 23]. On the other hand, some experimental models of acute sleep deprivation can result in high-level inflammation conditions [24–26]. Insufficient sleep was also mentioned in the prior longitudinal research as a potential risk factor for increased inflammatory proteins [27]. Although the previous research revealed links between various inflammatory proteins and several sleep traits, the altered directions for the expression of inflammatory proteins in sleep traits are not consistent [9]. Moreover, the causality underlying these observational associations is also worth further exploration, which is beneficial for future mechanism research. However, due to the potential confounding biases and reverse causation in previous observational studies [28], it is difficult to explore causality through observational evidence alone.
Mendelian randomization (MR) uses genetic variants as the instrumental variable (IV) to assure causality between given exposure and outcome [29]. There are three assumptions for the selection of genetic variants [30]: (1) the genetic variants are strongly associated with the exposure (sleep traits or inflammatory proteins), (2) the genetic variants are not affected by confounding factors that influence exposure and outcome, and (3) the only way that genetic variants affect the outcome is through exposure. Due to the genetic variants being randomly assigned to offspring during conception, MR can avoid potential confounding biases and reverse causation that exist in observational studies. Similar methods have been successfully used in related areas such as causality between obstructive sleep apnea and inflammation [31, 32].
To disentangle the associations and causality between insomnia, EDS, and different sleep durations and inflammatory proteins including interleukins, TNF-α, and CRP, we first performed a meta-analysis with large sample sizes to compare the expression differences of inflammatory proteins between the analyzed sleep traits and those unaffected controls. Then, a two-sample MR analysis with powerful genome-wide association study (GWAS) summary statistics was used to explore causal relationships between them.
Materials and Methods
As presented in Figure 1, we combined meta-analysis and MR analysis to study two questions. The first one is “Are there different levels of inflammatory proteins between patients with EDS, insomnia, extreme sleep duration and those unaffected controls respectively.” The second one is “Is there any causal relationship between inflammatory proteins and these sleep traits.”

Flow diagram. This study aimed to explore the associations between three sleep traits (EDS, insomnia, and sleep duration) and inflammatory proteins. The total procedure can be divided into two steps: (1) analyses for expression differences by quantitative analysis (left side of the figure); (2) analyses of causal relationships by MR design (right side of the figure). Finally, our results confirmed the close associations between inflammation and studied sleep traits.
Quantitative analysis of the associations between inflammatory proteins and sleep traits
We followed the guidelines of the Preferred Reporting Items for Systematic Reviews and Meta-Analysis [33] to conduct this quantitative analysis carefully.
Data sources and search strategy
This comprehensive search was performed by two authors independently using databases of PubMed, Embase, Web of Science, and Cochrane Library. We connected the search terms of each sleep trait (daytime sleepiness, insomnia, and sleep duration) with all listed inflammatory proteins (TNF OR tumor necrosis factor OR C-reactive protein OR CRP OR interleukin OR IL) by “AND” in turn, and then combined each group by “OR” up to March 27, 2022. The references of the enrolled studies were manually evaluated by two researchers independently and disagreements were resolved through discussion.
Inclusion and exclusion criteria
Based on the PICOS (Participants [P], intervention [I], control [C], outcome [O], and studies [S]), we defined the inclusion criteria as follows: P: participants with EDS or insomnia were clearly reported in included publications according to widely used questionnaires like Epworth Sleepiness Scale (ESS) with scores ≥9 for EDS [34], Pittsburg Sleep Quality Index (PSQI) with score ≥5 as insomnia [35, 36], accepted diagnostic criteria such as Diagnostic and Statistical Manual of Mental Disorders [37] or International Classification of Sleep Disorders [38], etc. Besides, there were no restrictions for age, sex, body mass index (BMI), and comorbidity for all included participants. I: any accepted approaches to quantify the inflammatory protein levels, like Enzyme-Linked Immunosorbent Assay, multiplex assays, and other accepted methods. C: corresponding unaffected EDS or unaffected insomnia participants. O: studies must report sufficient data about inflammatory protein levels. S: studies with available data including case-control studies or others.
For the part of sleep duration, P: short, normal, and long sleepers were classified from self-reported or objectively measured sleep duration (such as polysomnography), i.e., the cutoff of sleep duration for short sleepers was <7 h, 7–9 h for normal sleepers, and ≥9 h for long sleepers. I and O: same as described above. C: since we used a single-arm meta-analysis, there was no control group. S: studies with available data such as the prospective study or cross-section study.
And the exclusion criteria were: (1) not in English or Chinese; (2) not original research (reviews, letters, editorials, and conference abstract); (3) not relevant disease; (4) without healthy control.
Data extraction and quality assessments
The data were extracted by two investigators. Basic information involved the first author’s name, year of publication, PMID, region, age, BMI, gender distribution and ESS/PSQI of both case and control groups (Tables 1–3). Secondary information involved the sample sources, type of subjects, and diagnosis methods (Supplementary Tables 1–3). The analyzed data involved the number of subjects, protein levels, and protein measurement formats (Supplementary Tables 4–6). Finally, we used the Newcastle-Ottawa Scale (NOS) to assess the quality of the studies included in this analysis [39].
Characteristics of the included studies about protein levels in patients with EDS and controls
| Study ID | PMID | Country | Researched proteins | Case/Control counts | Age, years | BMI, kg/m2 | Sex (M/F) | ESS | NOS | ||||
|---|---|---|---|---|---|---|---|---|---|---|---|---|---|
| Case | Control | Case | Control | Case | Control | Case | Control | ||||||
| Andaku, Daniela Kuguimoto 2015 | 25586501 | Brazil | hsCRP | 14/11 | 45.43 ± 10.06 | 42.36 ± 9.48 | 27.39 ± 2.05 | 26.65 ± 2.38 | 14/0 | 11/0 | 15.93 ± 4.44 | 6.55 ± 2.11 | 6 |
| Behboudi, A. 2021 | 34362196 | Sweden | TNF-α | 100/156 | / | / | / | / | / | / | / | / | 5 |
| de la Pena Bravo, Monica 2007* | 17279423 | Spain | TNF-α, IL-6 | 28/22 | 51.3 ± 1.4 | 52.3 ± 2.4 | 33.3 ± 1.0 | 30.9 ± 1.4 | 28/0 | 22/0 | 16.8 ± 0.5 | 5.3 ± 0.8 | 7 |
| El-Solh, Ali A. 2010 | 20572418 | United States | CRP, TNF-α, IL-6 | 12/12 | 41.5 ± 10.4 | 43.7 ± 12.8 | 30.5 ± 3.6 | 31.4 ± 3.1 | 12/0 | 12/0 | 12.7 ± 1.5 | 7.1 ± 1.7 | 6 |
| Hu, Yang 2021 | 34188474 | China | TNF-α | 16/53 | / | / | / | / | / | / | / | / | 5 |
| Nena, Evangelia 2012 | 21207173 | Greece | hsCRP | 25/25 | 43.2 ± 9.5 | 46.3 ± 10.5 | 37.1 ± 6.3 | 34.8 ± 6.5 | 22/3 | 21/4 | 16.4 ± 3.7 | 6.2 ± 2.9 | 8 |
| Vgontzas, A. N. 1997* | 9141509 | United States | TNF-α, IL-6 | 8/10 | 38.4 ± 3.2 | 24.1 ± 0.8 | 28.5 ± 2.7 | 24.6 ± 0.7 | 3/5 | 10/0 | / | / | 7 |
| Yao, Su-mei 2008 | / | China | TNF-α | 26/24 | 46.80 ± 12.03 | 44.42 ± 11.60 | 27.4 ± 1.37 | 28.02 ± 0.93 | / | / | / | / | 6 |
All the data were expressed as mean ± SD unless specifically labeled.
*Expressed as mean ± SE.
NOS: Newcastle-Ottawa Scale. The details about protein levels are presented in Supplementary Table 4.
Characteristics of the included studies about protein levels in patients with insomnia and controls
| Study ID | PMID | Country | Researched proteins | Case/Control counts | Age, years | BMI, kg/m2 | Sex (M/F) | PSQI | NOS | ||||
|---|---|---|---|---|---|---|---|---|---|---|---|---|---|
| Case | Control | Case | Control | Case | Control | Case | Control | ||||||
| Boyle, Chloe C. 2020 | 32544926 | United States | CRP | 31/73 | 65.71 ± 4.25 | 65.92 ± 4.51 | 25.06 ± 3.13 | 24.76 ± 3.13 | 10/21 | 42/31 | 11.35 ± 5.52‡ | 1.24 ± 1.62‡ | 6 |
| Chiu, Y. L. 2009 | 18664587 | China | hsCRP, IL-1β, IL-6, TNF-α | 91/23 | 57.3 ± 12.0 | 55.1 ± 11.0 | / | / | 47/44 | 13/10 | 10.4 ± 3.2 | 3.5 ± 1.4 | 5 |
| Fernandez-Mendoza, Julio 2017 | 28041986 | United States | CRP, IL-6, TNF-α | 137/241 | 17.2 ± 2.3 | 16.9 ± 2.3 | / | / | 58/79 | 150/91 | / | / | 6 |
| Floam, Samantha 2015 | 25524529 | United States | CRP, IL-6 | 29/19 | 25.3 ± 1.6 | 25.4 ± 1.4 | 23.2 ± 0.5 | 23.2 ± 0.8 | 19/10 | 13/6 | 11.2 ± 0.7 | 1.9 ± 0.3 | 7 |
| He, Shuo 2021 | 34234602 | China | IL-10 | 63/42 | 41.3 ± 12.3 | 41.4 ± 14.1 | 21.7 ± 2.6 | / | 20/43 | 22/20 | 15.0 (13.0, 17.0)† | 2.0 (0.0, 3.3)† | 6 |
| Heffner, Kathi L. 2012 | 22327621 | United States | IL-6 | 22/61 | 60.81 ± 10.25 | 61.28 ± 8.27 | 27.71 ± 4.26 | 26.51 ± 4.30 | 7/15 | 31/30 | 9.45 ± 2.52 | 3.43 ± 1.36 | 8 |
| Huang, Y. 2019 | / | China | TNF-α | 30/30 | 42.4 ± 10.5 | 37.8 ± 11.2 | / | / | 9/21 | 10/20 | 17.5 (15.0, 19.0)† | 2.0 (1.0, 4.0)† | 5 |
| Irwin, M. 2003 | 12946658 | United States | IL-2 | 17/31 | 49.8 ± 12.7 | 44.4 ± 11.4 | / | / | 17/0 | 31/0 | / | / | 6 |
| Jin, Qi-Hui 2012 | 22883333 | China | hsCRP | 78/52 | 77 ± 11 | 76 ± 11 | 23.14 ± 4.07 | 24.18 ± 4.49 | 43/35 | 34/18 | / | / | 6 |
| Li, H. 2019 | 30651860 | China | IL-1β | 182/86 | 54.9 ± 4.55 | 53.5 ± 4.15 | / | / | 0/182 | 0/86 | 11.15 ± 1.33 | 5.32 ± 1.11 | 6 |
| Li, Yan 2012 | 23058191 | China | CRP | 111/203 | 29.70 ± 8.59 | 26.83 ± 8.03 | / | / | / | / | / | / | 5 |
| Li, Yuanyuan 2020 | 33177907 | China | IL-1β, IL-6, TNF-α | 38/38 | 43.47 ± 6.86 | 38.50 ± 7.05 | 22.21 ± 2.43 | 22.82 ± 1.97 | 13/25 | 20/18 | 16.26 ± 3.68 | 3.00 ± 1.41 | 7 |
| Lu, Yonghua 2018 | 30568156 | China | CRP, IL-1β, IL-6, TNF-α | 124/124 | 60.2 ± 10.7 | 57.8 ± 13.1 | / | / | 80/44 | 83/41 | 26.9 ± 11.2 | 16.9 ± 9.6 | 6 |
| Miller, Brian J. 2021 | 34481199 | United States | CRP, IL-6 | 19/377 | 43.9 ± 9.2 | 39.9 ± 11.2 | 34.3 ± 9.1 | 29.0 ± 6.9 | 6/13 | 297/80 | / | / | 7 |
| Okun, Michele L. 2011 | 21097658 | United States | IL-6, TNF-α | 52/76 | 71.1 ± 7.0 | 76.5 ± 6.3 | 26.3 ± 4.5 | 25.8 ± 3.4 | 18/34 | 36/40 | / | / | 6 |
| Orasan, Olga Hilda 2017 | 28534129 | Romania | CRP | 47/80 | / | / | / | / | 19/28 | 47/33 | / | / | 6 |
| Ren, Chong-Yang 2021 | 33636543 | China | IL-1β, IL-6, IL-10, TNF-α | 55/55 | 46.0 ± 12.5 | 46.2 ± 10.9 | / | / | 18/37 | 18/37 | 13.9 ± 2.2 | 3.8 ± 0.8 | 7 |
| Savard, J. 2003 | 12651988 | Canada | IL-1β, IL-2 | 16/18 | / | / | / | / | / | / | / | / | 6 |
| Slavish, Danica C. 2022 | 34988862 | United States | CRP, IL-6 | 44/315 | 41.43 ± 11.51 | 39.63 ± 11.08 | / | / | 4/40 | 26/289 | 10.63 ± 4.63‡ | 4.75 ± 3.93‡ | 6 |
| Slavish, Danica C. 2018 | 30358412 | United States | CRP, IL-6 | 19/33 | / | / | / | / | / | / | 12.84 ± 3.84‡ | 3.24 ± 2.00‡ | 5 |
| Taraz, M. 2013 | 23490309 | Iran | hsCRP, IL-10, IL-6, TNF-α | 54/18 | 56.80 ± 14.27 | 56.33 ± 20.17 | 23.26 ± 3.71 | 24.21 ± 2.91 | 33/21 | 9/9 | 10.98 ± 4.16 | 2.11 ± 1.74 | 6 |
| Tavakoli, Atefeh 2021 | 34760255 | Iran | hsCRP, IL-1β | 218/86 | 36.05 ± 8.86 | 36.56 ± 8.45 | 30.77 ± 4.47 | 31.11 ± 4.29 | 0/218 | 0/86 | / | / | 7 |
| Tsai, C. F. 2016 | 27518472 | China | IL-6, TNF-α | 56/42 | 59.5 ± 9.9 | 58.6 ± 8.4 | / | / | 27/29 | 29/13 | 10.0 ± 3.3 | 3.4 ± 1.2 | 7 |
| Wang, Jihui 2020 | 32104118 | China | IL-1β, IL-6, TNF-α | 44/32 | 59.4 ± 7.8 | 61.3 ± 7.4 | 24.3 ± 3.8 | 24.8 ± 3.4 | 21/23 | 17/15 | 9.7 ± 4.1 | 5.2 ± 2.4 | 7 |
| Xia, Lan 2021 | 34413689 | China | TNF-α | 65/39 | 41.37 ± 12.12 | 42.15 ± 14.28 | / | / | 43/22 | 20/19 | 14.97 ± 2.90 | 2.0 (1.0, 3.0)† | 6 |
| Yu, S. Y. 2013 | 24376607 | China | IL-1β, TNF-α | 31/64 | / | / | / | / | / | / | / | / | 5 |
| Zhang, Hongyan 2021 | 34941184 | China | CRP | 105/112 | 49.87 ± 5.48 | 47.02 ± 5.04 | 22.46 ± 2.21 | 21.89 ± 2.63 | 0/105 | 0/112 | / | / | 6 |
All the data were expressed as mean ± SD unless specifically labeled.
†Expressed as median (IQR).
‡Insomnia symptom severity.
NOS: Newcastle-Ottawa Scale. The details about protein levels are presented in Supplementary Table 5.
Characteristics of the included studies about protein levels in different sleep durations
| Study ID | PMID | Country | Proteins | Source | Sleep duration (h) | Group | n_case | Age | BMI | Sex (M/F) |
|---|---|---|---|---|---|---|---|---|---|---|
| Wirth, Michael D. 2020 | 32406919 | United States | CRP, IL-6, | Blood | / | <6 h | 25 | / | / | / |
| 6–7 h | 35 | / | / | / | ||||||
| >7 h | 32 | / | / | / | ||||||
| Patel, Sanjay R. 2009 | 19238807 | United States | CRP, IL-6 | Blood | 5.9 ± 1.1 | <7 h | 189 | 46.1 ± 14.4 | 34.9 ± 9.7 | 90/99 |
| 7.5 ± 0.3 | 7–8 h | 218 | 47.5 ± 17.4 | 32.1 ± 8.7 | 99/119 | |||||
| 9.3 ± 1.1 | >8 h | 202 | 41.3 ± 18.4 | 33.9 ± 9.1 | 86/116 | |||||
| Perez de Heredia, Fatima 2014 | 25156749 | United Kingdom | CRP | Blood | / | <8 h | 274 | / | / | / |
| 8–9 h | 358 | / | / | / | ||||||
| >9 h | 237 | / | / | / | ||||||
| Fernandez-Mendoza, Julio 2017 | 28041986 | United States | CRP, IL-6 | Blood | 372.1 ± 55.6 | <7 h | 96 | 17.1 ± 2.2 | / | 61/35 |
| 454.3 ± 18.0 | 7–8 h | 170 | 17.2 ± 2.4 | / | 97/73 | |||||
| 496.6 ± 10.7 | >8 h | 112 | 16.7 ± 2.2 | / | 50/62 | |||||
| Tuomilehto, H. 2009 | 19651919 | Finland | CRP, IL-6 | Blood | 5.7 ± 1.0 | <6.5 h | 47 | 52.5 ± 7.4 | 31.9 ± 4.9 | 16/21 |
| 7.9 ± 0.5 | 7.0–8.5 h | 222 | 54.1 ± 7.0 | 31.2 ± 4.6 | 75/147 | |||||
| 9.3 ± 0.3 | 9.0–9.5 h | 115 | 56.0 ± 7.2 | 31.8 ± 4.9 | 34/81 | |||||
| 11.0 ± 1.4 | >10 h | 131 | 57.2 ± 6.7 | 30.5 ± 3.9 | 45/86 | |||||
| Miller, Michelle A. 2009—male | 19639748 | United Kingdom | hsCRP, IL-6 | Blood | / | <5 h | 103 | 48.7 ± 5.8 | 25.7 ± 3.5 | 103/0 |
| 6 h | 698 | 48.7 ± 5.7 | 25.4 ± 3.3 | 698/0 | ||||||
| 7 h | 1650 | 49.0 ± 5.9 | 24.9 ± 2.9 | 1650/0 | ||||||
| 8 h | 845 | 49.5 ± 6.2 | 24.8 ± 3.0 | 845/0 | ||||||
| >9 h | 86 | 50.7 ± 6.5 | 25.9 ± 4.0 | 86/0 | ||||||
| Miller, Michelle A. 2009—female | 19639748 | United Kingdom | hsCRP, IL-6 | Blood | / | <5 h | 56 | 51.5 ± 6.0 | 26.0 ± 6.2 | 0/56 |
| 6 h | 274 | 49.9 ± 6.0 | 25.6 ± 4.6 | 0/274 | ||||||
| 7 h | 583 | 49.5 ± 5.9 | 24.9 ± 4.4 | 0/583 | ||||||
| 8 h | 304 | 49.1 ± 6.3 | 25.3 ± 4.3 | 0/304 | ||||||
| >9 h | 43 | 48.9 ± 6.2 | 26.0 ± 5.5 | 0/43 | ||||||
| Jackowska, Marta 2015—male | 25934538 | United Kingdom | CRP | Blood | / | <5 h | 172 | / | / | 172/0 |
| >5–6 h | 318 | 318/0 | ||||||||
| >6–7 h | 594 | / | / | 594/0 | ||||||
| >7–8 h | 501 | 501/0 | ||||||||
| >8 h | 92 | / | / | 92/0 | ||||||
| Jackowska, Marta 2015—female | 25934538 | United Kingdom | CRP | Blood | / | <5 h | 313 | / | / | 0/313 |
| >5–6 h | 420 | 0/420 | ||||||||
| >6–7 h | 636 | / | / | 0/636 | ||||||
| >7–8 h | 564 | 0/564 | ||||||||
| > 8 h | 150 | / | / | 0/150 | ||||||
| Lee, Yea-Chan 2020* | 32294936 | Korea | hsCRP | Serum | / | <6 h | 840 | 52.7 ± 0.8 | 24.3 ± 0.2 | 0/840 |
| 6–7 h | 1471 | 48.9 ± 0.6 | 23.4 ± 0.1 | 0/1471 | ||||||
| 7–8 h | 1939 | 47.1 ± 0.5 | 23.3 ± 0.1 | 0/1939 | ||||||
| 8-9 h | 1289 | 46.4 ± 0.6 | 23.1 ± 0.1 | 0/1289 | ||||||
| >9 h | 612 | 48.7 ± 1.1 | 23.3 ± 0.2 | 0/612 | ||||||
| Gupta, Kartik 2021† | 34485966 | United States | CRP | Blood | / | <6 h | 2755 | 48 (34, 62) | 28.8 (24.9, 33.5) | 1365/1390 |
| 6–7 h | 8714 | 46 (31, 61) | 27.7 (24.1, 32.0) | 4334/4380 | ||||||
| >7 h | 6166 | 47 (29, 67) | 27.3 (23.7, 31.7) | 2884/3282 | ||||||
| He, Liyun 2020 | 33235480 | China | hsCRP | Blood | / | <6 h | 831 | 57.1 ± 13.9 | 23.5 ± 3.5 | 459/372 |
| 7 h | 1575 | 51.4 ± 13.7 | 23.6 ± 3.5 | 842/733 | ||||||
| 8 h | 3893 | 47.8 ± 14.1 | 23.4 ± 3.4 | 2082/1811 | ||||||
| >9 h | 1871 | 50.4 ± 17.0 | 23.1 ± 3.4 | 986/885 |
All the data were expressed as mean ± SD unless specifically labeled. The unit of sleep duration in study Fernandez-Mendoza, Julio 2017 was minute.
*Expressed as mean ± SE.
†Expressed as median (IQR).
NOS: Newcastle-Ottawa Scale. The details about protein levels are presented in Supplementary Table 6.
Statistical analysis
For analysis of EDS and insomnia, the data were analyzed in the Review Manager 5.3 (The Nordic Cochrane Centre, The Cochrane Collaboration, London, United Kingdom). The Standard Mean Difference (SMD) and 95% confidence interval (CI) were used as measures of effect between the two groups in this study. Measurement formats of data were unified into mean ± standard deviation (SD). In detail, standard error (SE) was transformed with the formula of SD = SE∙√N (N = the number of individuals). Median (interquartile range, IQR) was converted by the relevant mathematical method [40, 41], and the Mean (95% CI) was converted to mean ± SD by SD = √N* (upper limit − lower limit)/3.92. We calculated an I² statistic to estimate heterogeneity. If I2 >50%, the data were pooled by the random effect model, otherwise by the fixed effect model. We also performed sensitivity analyses by removing articles one by one to see its effect on the p value. Moreover, a funnel diagram was conducted to evaluate publication bias [42].
For the analysis of sleep duration, we performed a continuous single-arm meta-analysis to quantitatively calculate concentrations of inflammatory proteins for different groups of sleep behaviors separately. The conversion procedures of proteins’ measurement formats were the same as the above. Besides, to incorporate more data presented with different measurement units, the measurement unit of protein levels was standardized. For CRP, the unit was converted to mg/L; and for interleukins, the unit was converted to pg/mL. The data were analyzed in the Stata/SE 15.1 for Mac (64-bit Intel) Revision November 21, 2017.
Cause-and-effect relationships between inflammatory proteins and sleep traits
GWAS summary statistics sources
We performed a two-sample MR analysis to evaluate the causal associations between inflammatory proteins and sleep traits of EDS, insomnia, and sleep duration, respectively. The GWAS summary statistics for these sleep traits were from UK Biobank [43–45]. The definitions of these sleep traits were all self-reported questionnaires. For sleep duration, the definition was based on the question: “About how many hours of sleep do you get in every 24 h? (include naps), with responses in hour increments” for participants. Furthermore, sleep duration <7 h was defined as short sleep duration, while sleep duration ≥9 h was defined as long sleep duration. For EDS, the participants were asked “How likely are you to dose off or fall asleep during the daytime when you don’t mean to” and the groups were then categorized into case or control by different answers. In addition, the definition of insomnia symptoms was based on the responses to the question: “Do you have trouble falling asleep at night or do you wake up in the middle of the night?.”
Moreover, the data about inflammatory proteins including CRP, interleukins, and TNF-α were obtained from two relevant GWASs. CRP summary statistics were from the FinMetSeq study which aimed to discover rare variants through exome sequencing in 19 292 individuals from two related cohorts of FINRISK and METSIM [46]. Summary statistics for TNF-α and interleukins were identified from a GWAS using YFS and FINRISK2002 including 8293 individuals from Finland [47].
IV selection
The two-sample MR analysis usually uses relevant genetic variants as IV to explore the causal effect of exposure on outcome. Here, we chose the relevant single-nucleotide polymorphisms (SNPs) as follows: when using sleep traits as exposures and inflammatory proteins as outcomes, the threshold for associated SNPs was p < 5 × 10⁻⁸ except for CRP as outcome with p < 5 × 10⁻⁶ because none of the SNPs reached genome-wide significance. Because the used GWASs of inflammatory proteins included smaller sample sizes, when using inflammatory proteins as exposures and sleep traits as outcomes, more liberal threshold was used to select the associated SNPs with p < 5 × 10⁻⁶ except for exposures of IL-10 and IL-18 with p < 5 × 10⁻⁷. All included SNPs were in different genomic regions and not in linkage disequilibrium with the criteria of distance = 1000 kb and r2 = 0.1. The F-statistics values >10 for all pairs confirmed strong associations between the IVs of used genetic variants and each exposure (Supplementary Tables 7 and 8). Furthermore, to test possible effect of the genetic variants on the outcome through confounding factors, known as horizontal pleiotropy, we have added PhenoScanner analysis to screen whether any selected SNP was strongly associated with other traits at a threshold of 5 × 10⁻⁸ [48, 49]. The parameters of the associated trait, effect size (β), SE, p value, and sample size (n) for each matched SNP were extracted and shown in Supplementary eTables.
Data analysis
In the primary analysis, we used inverse-variance weighted (IVW) as the main approach which assumes that all SNPs are valid instruments. In addition, heterogeneity was analyzed by Cochran’s Q test of IVW and MR-Egger, and pleiotropy was tested by the intercept of MR-Egger analysis. In sensitivity analyses, we also performed several other MR methods including MR-Egger, Weighted median, and MR-Robust Adjusted Profile Score (RAPS) to correct any potential violations of the assumptions [50, 51]. Additionally, if any pleiotropic SNP was found through the PhennoScanner analysis for causality-associated pairs, we removed each possible variant separately and conducted the primary method of IVW again. Furthermore, we carried out multivariable MR analysis (MVMR) [52] to estimate the direct causal effect of genetically predicted exposure on outcome adjusted for potential confounders of late onset Alzheimer’s disease (LOAD) [53] and coronary heart disease (CHD) [54].
Results
Associations between inflammatory protein levels and sleep traits
A total of 44 papers with 51 879 participants were included in our analysis to compare level differences of inflammatory proteins between sleep traits and their controls. Among them, 8, 27, and 10 publications were related to sleep traits of EDS, insomnia, and different sleep durations, respectively. The definitions of EDS and insomnia were all based on subjective criteria. While for the definitions of sleep duration, 8 studies were based on subjective criteria and 2 were based on objective methods. The diagram of the selection process is displayed in Supplementary Figure 1 and the details of each article are shown in Tables 1–3. Each literature obtained a NOS score of at least 5.
Higher levels of inflammatory proteins were associated with insomnia but not with EDS
First, we compared the concentrations of CRP, TNF-α, and IL-6 between patients with EDS and controls in three, six, and three articles individually. However, there was no evident difference in protein levels between them (Figure 2A and Supplementary Figure 2). Sensitivity analyses suggested that the results were robust. The funnel plot results indicated no apparent publication bias (Supplementary Figure 3).
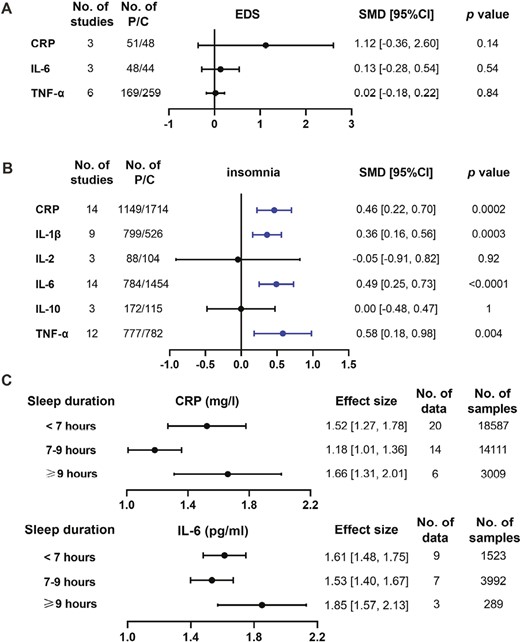
Comparisons about the levels of inflammatory proteins in different sleep traits. A and B: concentration differences of inflammatory proteins were compared between sleep traits of EDS (A) and insomnia (B) and controls, respectively. Data were presented as SMD and 95% CI. C: the absolute protein levels in short sleep duration (<7 h), normal sleep duration (7–9 h), and long sleep duration (≥9 h) were calculated by continuous single-arm meta-analysis. Abbreviations: No. of studies: number of studies included for analysis in each group. No. of P/C: the number of affected patients (P) and controls (C) included for each group. The statistically different results with p < 0.05 were shown in blue point.
Next, we compared the expression of six inflammatory proteins between patients with insomnia and controls. We found that four proteins including CRP, IL-1β, IL-6, and TNF-α were elevated ranging from 0.36 to 0.58 (after standardization) in patients with insomnia compared with controls (Figure 2B and Supplementary Figure 4). However, there was no significant difference in the expressions of IL-2 and IL-10 between them. All results were stable by sensitivity analyses. The funnel plot did not illustrate the publication bias (Supplementary Figure 5).
U/J-shaped expression of CRP and IL-6 in sleep duration
Finally, we computed the absolute concentrations of CRP and IL-6 in people with extremes of sleep duration (<7 h and ≥9 h) and normal sleep duration (7–9 h) (Figure 2C and Supplementary Figures 6 and 7). We found that the level of CRP was higher in short and long sleepers than in normal sleepers, which showed a U-shaped trend with sleep duration. As for IL-6, long sleepers had the highest value, followed by short sleepers then normal sleepers, suggesting a J-shaped trend with sleep duration. The funnel plot did not illustrate the publication bias (Supplementary Figures 8 and 9). Furthermore, subgroup analyses were performed based on different types of measurement (subjective or objective) and types of sleep duration (nighttime or not restricted to nighttime) (Supplementary Table 9). Finally, the U/J-shaped expression of CRP and IL-6 in subgroup analyses was still consistent.
Analysis of causal relationships between inflammatory proteins and sleep traits
No causal relationships between inflammatory proteins and sleep traits of insomnia and EDS
First, we tested the causal relationships for the elevated proteins of CRP, TNF-α, IL-1β, and IL-6 and insomnia. When using insomnia as exposure and above inflammatory proteins as the outcome, the IVW showed that there was no causal effect of insomnia on inflammatory proteins. Besides, the reverse directions of these inflammatory proteins on insomnia also showed null results (Figure 3). The causal associations between other inflammatory proteins (IL-2, IL-4, IL-5, IL-8, IL-10, IL-17, IL-18) and insomnia were also absent, such as causality from insomnia on IL-2 (estimate: −0.459; 95% CI, [−1.254, 0.336]; p = 0.258) (Supplementary Figure 10). All results were confirmed by MR-Egger, Weighted median, and MR RAPS (Supplementary Tables 10 and 11).
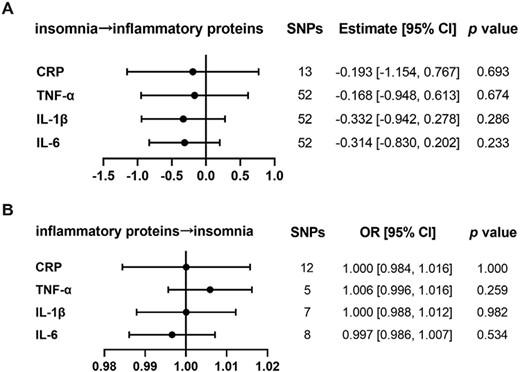
The analysis of causal relationships between insomnia and inflammatory proteins. (A) Causality was analyzed with insomnia as exposure, and each elevated inflammatory protein as outcome by MR. (B) Causality was analyzed with increased inflammatory proteins, respectively as exposure and insomnia as outcome by MR. The presented results were obtained using the IVW method. The statistical threshold was p < 0.05.
Also, we did not find any significant causal relations between EDS and inflammatory proteins of IL-1β, IL-2, IL-4, IL-5, IL-6, IL-8, IL-10, IL-17, IL-18, CRP, and TNF-α by the primary method of IVW (Supplementary Figure 11). These null results were also confirmed by MR-Egger, Weighted median, and MR RAPS. Also, MR-Egger regression showed no evidence of directional pleiotropy across all the included genetic variants. The results with heterogeneity are presented in Supplementary Tables 12 and 13.
CRP and IL-6 may be the risk factors for sleep duration
First, we explored the causality between inflammatory proteins and the continuous variable of sleep duration. We found that CRP had a weak causal effect on sleep duration by IVW (estimate: 0.017; 95% CI, [0.003, 0.031]; p = 0.015). Similar results were observed using MR-Egger (estimate: 0.040; 95% CI, [0.012, 0.069]; p = 0.020) and MR RAPS (estimate: 0.013; 95% CI, [0.001, 0.025]; p = 0.040) except for Weighted median (estimate: 0.009; 95% CI, [−0.010, 0.009]; p = 0.362) (Figure 4 and Supplementary Tables 14 and 15).
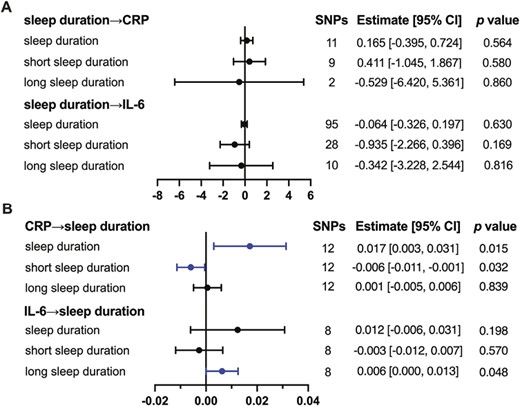
The causal relationships between sleep duration and inflammatory proteins. (A) Causality was analyzed with sleep duration as exposure, and each inflammatory protein as outcome by MR. (B) Causality was analyzed with inflammatory proteins, respectively as exposure and sleep duration as outcome by MR. The presented results are obtained by IVW. The statistical threshold was p < 0.05.
Besides, we explored the causality between inflammatory proteins and short sleep duration. The methods of IVW supported the causal effect of CRP on short sleep duration (estimate: −0.006; 95% CI, [−0.011, −0.001]; p = 0.032). Similar results were observed using MR RAPS (estimate: −0.006; 95% CI, [−0.011, −0.001]; p = 0.029) but not in MR-Egger (estimate: −0.001; 95% CI, [−0.013, 0.011]; p = 0.863) and Weighted median (estimate: −0.005; 95% CI, [−0.013, 0.002]; p = 0.154) (Figure 4 and Supplementary Tables 16 and 17).
Then, we explored the causality between inflammatory proteins and long sleep duration. The only positive result was the weak causal effect of IL-6 on long sleep duration by IVW (estimate: 0.006; 95% CI, [0.000, 0.013]; p = 0.048) and MR RAPS (estimate: 0.007; 95% CI, [0.001, 0.012]; p = 0.022) but not in MR-Egger and Weighted median (Figure 4 and Supplementary Tables 18 and 19).
For all above, there was no heterogeneity in the IVW analysis. And the MR-Egger regression showed no evidence of directional pleiotropy. Also, based on the results of PhenoScanner analysis, we removed the possible pleiotropic SNPs associated with LOAD or CHD in turn and the results for the remaining SNPs as IVs were comparable to those of original MR results (Supplementary Table 20). Furthermore, MVMR results showed that the causal effects of CRP on sleep duration and short sleep duration were robust after adjustment for CHD instead of LOAD, also the effect of IL-6 on long sleep duration was eliminated upon adjustment for CHD although the effect size showing the same direction as the original effect size (Supplementary Table 21). Taken together, our MR results above suggested that the presence of pleiotropic SNPs was minimal and supported a causal factor for CRP and IL-6 on sleep duration.
Discussion
The relationship between sleep and inflammation has been a hot but unclear topic. In this study, we combined meta-analysis and MR analysis to discuss the associations and causal effects between 3 sleep traits and 11 different inflammatory proteins. According to our findings, there were increased levels of CRP, IL-1β, IL-6, and TNF-α in insomnia, while CRP and IL-6 expression showed U/J-shape with sleep durations. Additionally, causal relationships were observed for CRP and IL-6 on longer sleep duration, but we did not find causality between other pairs. These findings confirm the potential causal connections between inflammation and sleep traits and provide fresh perspectives on potential mechanisms.
According to our results, there was a high inflammatory expression in insomnia patients. A substantial body of prior research was consistent with our meta-analysis results. Increasing catecholamines during sleep deprivation may lead to potential inflammation responses [55]. Some inflammatory genetic variants participate in the modulation of the association between IL-6 levels and self-reported sleep duration [56]. Experimental sleep loss and deprivation also showed a robust increase of inflammatory proteins including CRP [57], IL-6 [58], TNF-α [59], and IL-1β [25]. Thus, the high inflammation in insomnia seems reasonable. However, the subsequent MR supported the absence of causal effects between these inflammatory proteins and insomnia. These seemingly contradictory results in insomnia can be partly explained by insomnia complications such as depression, hypertension, and obstructive sleep apnea [60, 61]. Due to the common limitation of observational studies, we were unable to select patients who simply had sleep traits without any other relevant complications. Each of these complications can be individually linked to high inflammation and thus may be the actual direct source of high inflammation in patients with sleep disturbances [62–64]. In addition, sex differences may be another confounder of inflammation in insomnia, which may be associated with menopausal transition or hormonal fluctuation [65].
For the associations between sleep duration and inflammation, the results of our meta-analysis indicated that there were elevated inflammation levels in both short sleepers and long sleepers, which was consistent with previous cross-section studies that showed U/J-shaped trends of CRP and IL-6 in sleep duration [56, 66–68]. The high inflammation level in abnormal sleep may partly be attributed to the dysfunction of the hypothalamus-pituitary-adrenal (HPA) axis and the sympathetic nervous system, which influence the inflammation expression of inflammation pathways such as nuclear factor-kappa B (NF-κB) [69, 70]. A recent study reported that a kind of variation encoding glucocorticoid, a hormone regulated by the HPA axis, can strengthen the associations between IL-6 and sleep duration which indicated the intermediary role of the HPA axis [56]. Except for the dysfunction of the release of hormones, the change in blood pressure also seemed a crucial participant in abnormal inflammation in sleep. During normal sleep, the vessel will be soft, and the blood pressure can be relatively low. While during abnormal sleep, the blood pressure will be higher than it should be, which injures the vascular endothelial cells and activates inflammation [55].
Additionally, with the method of MR, we found that CRP and IL-6 may be the risk factors for sleep duration. Especially, the effect of increased CRP on longer sleep duration was through reducing the short sleep duration, while IL-6 was via extending the long sleep duration. It indicates that different pathways are being activated through the interactions between sleep duration and altered inflammatory proteins. Previous studies have demonstrated that high inflammation or expression of cytokines may result in a propensity to sleep probably through the effects on sleep regulation regions in the brain [1]. For example, IL-1β, IL-6, and TNF-α have been reported for non-rapid eye movement sleep-promoting actions [71–73]. One explanation for this communication between sleep and inflammation might be conducted through the vagus nerve. Some cytokines perform on binding sites on the vagus nerve and transmit information to the nucleus of the solitary tract [74]. Given the existence of a probable association between CRP and functions of the vagus nerve [75, 76], more experimental research can be conducted to explore the direct effect of CRP on sleep. In fact, the interaction of inflammation with sleep duration may be more complex. In addition to the direct effect on sleep duration, inflammation can also be associated with several sleep-related malfunctions. People with chronic long sleep duration tend to suffer from poorer cognitive function [15, 77], and are more likely to have cardiovascular diseases [78]. Interestingly, these malfunctions are also related to dysfunctional inflammation. Thus, it seems that there is a crosstalk among inflammation, long sleep duration, and relevant complications.
Though some enlightening findings, there are even some limitations. First, most definitions of sleep traits were based on self-reported questionnaires and were not objectively measured, which may result in some bias. Second, all included samples in our MR analysis contained only European ancestry. Thus, there may be some limitations to the generalizability of our findings to other ethnicities. Third, due to the limited number of included studies, the power for some results in the meta-analysis was not sufficiently reliable (such as EDS). Fourth, the sleep duration in the meta-analysis was not only restricted to nighttime sleep but also may include daytime sleep or daily nap. These differences may influence our results. Fifth, the sample size of TNF-α GWAS was relatively small which may be the reason why we did not find causal relationships between TNF-α and sleep traits. Finally, we only included Chinese and English studies in the meta-analysis which may result in missing related studies published in other languages.
Conclusions
In conclusion, our results confirmed high inflammatory protein profiles in insomnia and extremes of sleep duration. Furthermore, elevated CRP and IL-6 had causal effects on longer sleep duration. These findings give evidence for the connection between inflammation and abnormal sleep condition, and further research is needed to verify these findings and explain related mechanisms.
Funding
This research was supported by the National Natural Science Foundation of China (Nos. 82001357 and 31500999), the Hunan Provincial Natural Science Foundation of China (Nos. 2023JJ20098 and 2021JJ80079) and the Fundamental Research Funds for the Central Universities of Central South University (No. 2023ZZTS0994).
Disclosure Statement
The authors declare no conflicts of interest.
Data Availability
All data generated or analyzed during this study are included in this published article and its supplementary files. The data underlying this article will be shared on reasonable request to the corresponding author.
References
Author notes
Yuan Zhang and Wangcheng Zhao contributed equally to this work.


Comments