


Abstract
Evaluate wrist-placed accelerometry predicted heartrate compared to electrocardiogram (ECG) heartrate in children during sleep.
Children (n = 82, 61% male, 43.9% black) wore a wrist-placed Apple Watch Series 7 (AWS7) and ActiGraph GT9X during a polysomnogram. Three-Axis accelerometry data was extracted from AWS7 and the GT9X. Accelerometry heartrate estimates were derived from jerk (the rate of acceleration change), computed using the peak magnitude frequency in short time Fourier Transforms of Hilbert transformed jerk computed from acceleration magnitude. Heartrates from ECG traces were estimated from R-R intervals using R-pulse detection. Lin’s concordance correlation coefficient (CCC), mean absolute error (MAE), and mean absolute percent error (MAPE) assessed agreement with ECG estimated heart rate. Secondary analyses explored agreement by polysomnography sleep stage and a signal quality metric.
The developed scripts are available on Github. For the GT9X, CCC was poor at −0.11 and MAE and MAPE were high at 16.8 (SD = 14.2) beats/minute and 20.4% (SD = 18.5%). For AWS7, CCC was moderate at 0.61 while MAE and MAPE were lower at 6.4 (SD = 9.9) beats/minute and 7.3% (SD = 10.3%). Accelerometry estimated heartrate for AWS7 was more closely related to ECG heartrate during N2, N3 and REM sleep than lights on, wake, and N1 and when signal quality was high. These patterns were not evident for the GT9X.
Raw accelerometry data extracted from AWS7, but not the GT9X, can be used to estimate heartrate in children while they sleep. Future work is needed to explore the sources (i.e. hardware, software, etc.) of the GT9X’s poor performance.
Research has consistently shown that the addition of heart rate to actigraphy enhances the ability of wearable monitors to detect free-living sleep. However, actigraphy alone is typically used to monitor free-living sleep because heart rate is expensive to collect and drains battery life quickly. Accelerometer estimated pulse rate could be a cost-effective and battery-saving strategy in free-living sleep detection. This study builds on past work in this area by extending findings to children, comparing findings to a criterion, making the developed scripts available online, and introducing a criterion independent metric of the quality of actigraphy-estimated heartrate.
Within the research/clinical setting, the most common approach for measuring free-living sleep is wrist-based actigraphy. However, wrist-based actigraphy is limited because sleep estimates are based on movement, or the lack thereof, alone. Because of this, wake time with little movement and sleep with relatively large amounts of movement tends to be misclassified, leading to relatively low specificity (i.e. < 50% accurate detection of wake) when compared to a gold standard (i.e. polysomnography [PSG] wake detection) [1, 2]. Furthermore, traditional wrist-based actigraphy cannot measure sleep architecture (i.e. sleep stages) [1, 3–5]. This is a major limitation as sleep architecture is an important construct that is related to health outcomes and disorders [6–9].
Within the wearable sleep technology field, improvement in sleep assessments, and particularly the ability to stage sleep, recently has been achieved by combining photoplethysmography-based features such as heart rate and its variability with accelerometry data [2]. Sleep estimates produced by these multisensory devices show an overall greater ability to correctly classify wake, as compared to the performance of traditional actigraphy [1, 4, 5, 10–12]. Furthermore, the addition of HR allows for the classification of sleep stages [13, 14]. However, HR is still rarely incorporated into research grade actigraphy devices because it requires an additional sensor to collect. The addition of a second sensor requires greater power and reduces the effective run time of wearable accelerometers from weeks to days [1]. Furthermore, research grade devices that include a second sensor are expensive. For instance, the ActiGraph Leap and the Empatica EmbracePlus wristband both include an accelerometer in addition to photoplethysmography [15, 16]. However, the ActiGraph Leap costs $600–$800 per device, while the Empatica costs $2000 per device and has a battery life of less than 32 hours. An alternative approach is to collect a HR-like signal from the actigraphy data, negating the need to add a second power-hungry and costly sensor.
There are well established techniques for extracting HR from actigraphy. For example, ballistocardiography leverages movement sensors such as accelerometers to measure body recoil forces due to cardiac ejection of blood [17] while seismocardiography estimates HR by identifying vibrations of the chest wall due to the heartbeat [18]. However, ballistocardiography is limited because it requires the placement of sensors on a physical structure (i.e. bed) where a person sleeps. This is a limitation because it will fail to collect data should the person sleep elsewhere, and the data may be polluted if there is another person in the bed. Seismocardiography requires chest mounted sensors. This limits wear compliance as these sensors can become cumbersome and uncomfortable, which is a major concern when attempting to quantify free-living sleep especially when participants are small (e.g. children). One of the simplest ways to assess HR is to take someone’s pulse on the wrist. Previous work [19–21] has explored the ability of wrist-placed accelerometers to detect pulse by sensing the changes in acceleration (i.e. jerk) generated by blood flowing through the wrist when the heart beats. However, none of these studies have included children. Previous work has also been confined to one device per study. For example, one study used a custom-built accelerometer that is not widely available [21], and the two other studies used the same research grade device [19, 20]. No studies have explored the ability of the underlying actigraphy data from different devices, research grade or consumer wearable, to detect HR in a single study. Furthermore, none of the previous studies have provided the underlying data or data processing scripts used to calculate actigraphy-estimated HR. Making these underlying data and scripts open source will potentially allow for others to adopt and refine the techniques described herein. Finally, none of the other papers provided criterion independent signal quality metrics to assess the reliability of HR estimates from accelerometry, a crucial requirement for broad adoption of wearables in research. Thus, the purpose of this study was to evaluate the potential of estimating children’s wrist pulse (i.e. HR) by computing jerk from wrist-based monitors. Estimates of sleeping HR are compared to electrocardiogram data, a criterion measure of HR that measures electrical activity of the heart.
Materials and Methods
Participants
Table 1 presents participant characteristics. This study was an opportunistic analysis of a larger study that aimed to validate the underlying data collected from consumer wearable devices to measure children’s sleep. For the current study, participants were recruited from a sleep clinic at a children’s hospital located in a large metropolitan area in the southeastern United States. Children were referred for an overnight sleep study by their pediatrician because of suspected disrupted sleep due to snoring, enlarged tonsils, or restless sleep. From March of 2022 to March of 2023, parents and children (5–12 years old) were presented with the opportunity to participate in the current study after an intake appointment at the sleep clinic. Parents that were interested were instructed to complete an informed consent document. The child was then asked to provide verbal assent. Each family received a $40 gift card for participating in the study. All study procedures were approved by the first author’s institutional review board prior to enrollment of the first participant.
Demographics of Participants
| Sex | n | % |
|---|---|---|
| Female | 32 | 39.0 |
| Male | 50 | 61.0 |
| Race | ||
| Black | 36 | 43.9 |
| White | 34 | 41.5 |
| Mixed races | 11 | 13.1 |
| Asian | 1 | 1.5 |
| Ethnicity | ||
| Not Hispanic or Latino | 74 | 90.2 |
| Hispanic or Latino | 8 | 9.8 |
| Diagnosis | ||
| Mild OSA | 41 | 50.0 |
| Moderate OSA | 13 | 15.9 |
| None | 28 | 34.1 |
| Weight status | ||
| Underweight | 2 | 2.4 |
| Normal weight | 34 | 41.5 |
| Overweight | 7 | 8.5 |
| Obese | 39 | 47.6 |
| Mean | SD | |
| Age | 8.4 | 2.2 |
| BMI z-score | 1.1 | 1.4 |
OSA, obstructive sleep apnea.
Measures
Research grade and consumer wearable actigraphy.
Children participating in the study wore an ActiGraph GT9X Link (ActiGraph; ActiGraph LLC, Pensacola, FL), and two of the three consumer wearables included in the larger study on their non-dominant wrist. The consumer wearables included were the Apple Watch Series 7 (AWS7; Apple Technology Company, Cupertino, CA), Garmin Vivoactive 4 (Garmin; Garmin Ltd., Olathe, KS), and Fitbit Sense (Fitbit; Google LLC, San Francisco, CA). In order to explore the ability of a widely available research grade and a consumer wearable device the GT9X and AWS7 data were included in the current analyses. GT9X devices were initialized to collect data at 100 Hz. Actigraphy data was extracted from the GT9X device via the Actilife software (v6.13.5, ActiGraph LLC, Pensacola, FL). For AWS7, raw actigraphy data were extracted via a custom app that utilized device-specific application programming interfaces. The process of accessing the raw actigraphy data from the AWS7 Watch has been described in detail elsewhere [22, 23]. AWS7 devices were set to collect accelerometer data at 50 Hz. For AWS7, data were recorded via the SensorLog (version 5.2) application and exported into comma-separated values files via Health Auto Export (version 6.3).
Electrocardiogram.
Electrocardiogram measured HR was collected as part of a Nihon Kohden PSG-1100 system with Polysmith software (Tokyo, Japan) PSG set up. The Nihon Kohden includes a three-lead electrocardiogram in addition to two electrooculograms, two leg electromyography (EMG), chin EMG, four electroencephalogram, oxygen saturation, snoring microphone, abdominal respiratory movement, oronasal flow thermistor, nasal pressure transducer, chest respiratory movement, plethysmography, and end-tidal CO2 in the monitored channels. Per best practice, a certified pediatric sleep specialist observed the child throughout the night and monitored the sensor signals for quality [24, 25]. The same specialist then scored the data for sleep staging in 30 second epochs according to the American Academy of Sleep Medicine pediatric scoring rules [24, 25]. The raw signal from the electrocardiogram was processed through Kubios HRV Scientific (version 4.0.2, Kuopio, Finland) to extract estimates from HR beats per minute [26]. The Kubios software was set to a medium automatic signal quality detection setting, with a 5% acceptance threshold, a 4 Hz interpolation rate, and a smoothing parameter of 500 [26]. Thus, if Kubios’ automatic signal quality detection algorithm determined that the signal was not of sufficient quality, it would not provide a HR beats per minute estimate for that epoch.
Design, study setting, and procedures
Trained sleep technicians performed an overnight PSG on participants in the sleep clinic from March of 2022 to March of 2023. Children were admitted at 8 pm and discharged following wake. Children self-selected bedtime and wakeup time. A total of 85 children participated in the study. However, three children were excluded because they had no sufficient quality ECG data according to Kubios’ automatic signal quality detection algorithm. Thus, the final sample included 82 children with PSG electrocardiogram, GT9X, and AWS7 data concordantly. The steps for isolating HR in the accelerometer signal described below were optimized in five randomly selected children; these steps were then applied to the other 77 children.
Pulse wave detection from wrist actigraphy
Key Matlab (version R2023b, The MathWorks Inc., Portola Vally, CA) scripts for pulse wave detection are available at https://github.com/ACOI-UofSC/Manuscript/tree/main/Scripts_Supplementary. The AWS7 and GT9X sample rates were computed from the total number of accelerometer samples collected and divided by the total elapsed time for the duration of overlap for AWS7, GT9X, and PSG. Figure 1 shows typical raw vector magnitude of acceleration measured on the AWS7 at a nominal 50 Hz sample rate during sleep. Vector magnitude was calculated via the formula: vector magnitude . While spikes ostensibly corresponding to the heartbeat are visible, they are close in amplitude to the noise floor, the minimum level of unwanted or random signals that can be detected by the accelerometer sensor. In a 13-bit digital accelerometer, similar to the accelerometers used herein, the noise floor is approximately 3milli-g (i.e. three 1 thousandths of the force of gravity on Earth’s surface) for high-resolution data [27], making it challenging to isolate the signal itself. An additional uncertainty making it challenging to detect HR is the potential for offset due to Earth’s gravity, which can drift by approximately 0.25 g (i.e. the force of gravity on Earth’s surface) over time due to power supply tolerances [28]. These issues were accounted for through two different strategies. First, jerk (i.e. change in acceleration) was calculated to eliminate any slow potential drifts in Earth’s gravity due to power supply tolerances, the numerical time derivative was calculated using formula 1 found in Supplementary Files. This is consistent with past work [21], where is the sample rate, which is fixed, and a is vector magnitude. To simplify the computation and avoid potential rounding errors from division operations, or the difference in a as a function of time was plotted (Figure 1B).
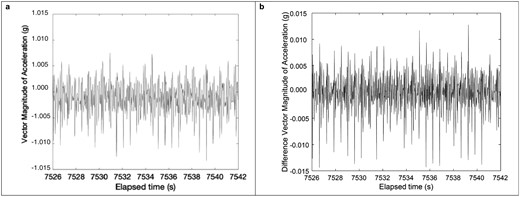
(A) Vector Magnitude (B) Difference in Vector Magnitude for Apple at a nominal 50 Hz sample rate.
Second, to account for the fact that the HR signal being measured is close to the sensor’s noise-floor, a strategy to reduce the noise floor was adopted. This can be accomplished by averaging over several samples [27]. Since can be both positive and negative, the root mean square (rms) of this signal was smoothed [19] over a certain sample count m (see Formula 2 in Supplementary Files). If the signal is smoothed over too many samples, that is if m is too large, the amplitude of the desired HR signal itself (Figure 2A) may be reduced as the averaging operation may span more than 1-2 beats causing bleed-through. This bleed-through manifests itself in the frequency domain as a repeated copy of the desired signal (Figure 2B, spectrogram described further below) at a frequency difference corresponding to the duration of the sample count m. A physically meaningful range of HR is from 30–210 bpm which corresponds to 0.5–3.5 Hz. A resting HR for children is typically between 60 and 120 Bpm or 1–2 Hz [29], which corresponds to a spacing of heartbeats of no less than 3.5–1Hz = 2.5 Hz for the artefacted copy in Figure 2B, or a sample average count of no more than = 20 samples. Given that the measured AWS7 sampling rate was as low as 49 Hz, we chose m = 18 samples, the closest even integer below 20, for minimization of artefacted copies. This optimization for m is consistent with the fact that the moving average filter has a sinc function Fourier transform with nodes given by the sample duration m [30]. For the GT9X, we chose the same sample time duration that is 36 samples for a sampling rate of 100 Hz.
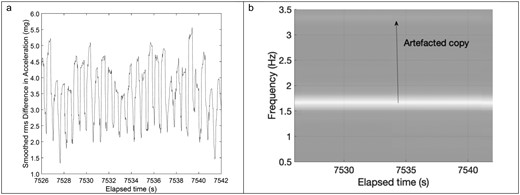
(A) Smoother rms difference in acceleration (B) Short time fourier transform i.e. spectrogram illustrating artefacted copy arising from moving average operation. In this example, the copy was far enough removed from the original t and low enough in amplitude that it would not lead to false estimates of heartrate (HR).
In principle, this step is sufficient to isolate the HR signal. However, given the wide variability in HR signal amplitude between participants, small baseline drifts may not be removed by computing even over the course of a single participant’s trial. Thus, the phase of the Hilbert transform of , denoted by was computed. This phase can only vary between and radians, so it is less susceptible to variations in HR signal amplitude over the course of the trial. This Hilbert transform procedure also pulls out time-varying periodic features (Figure 3A) as used for encoding/decoding frequency modulation radio signals [31]. FM radio signals are analogous to small HR variations, that is small frequency variations over the course of the trial. At this point, the HR signal still contained artifacts during participant waking/arousal as well as from respiration. These were removed using a time-domain high-pass filter over 0.8 seconds as previously demonstrated for photoplethysmography (PPG) signals [28] (see formula 3 in Supplementary Files).
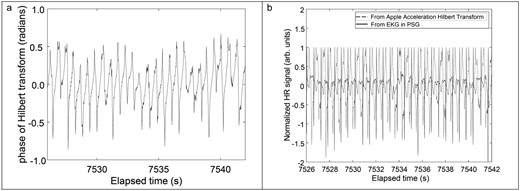
(A) Phase of Hilbert transformed jerk signal (B) Normalized phase of Hilbert transformed jerk signal and polysomnography electrocardiogram signal with slow motion artifacts removed using a time-domain high-pass filter with a 0.8 seconds window.
For visualization, this signal is normalized and overlaid with the normalized criterion electrocardiogram signal obtained during the same time window (Figure 3B). The short-time Fourier transform (STFT) of was computed using a 30 seconds moving window (for ease of comparison with Kubios’ 30 seconds window) via the spectrogram function in Matlab to identify the peak intensity frequency. This frequency is then multiplied by 60 to produce the estimate of HR (Figure 4). This HR reading is produced every 7.3 seconds. We restricted the STFT to 0.5 to 3.5 Hz (corresponding 30–210 bpm) to bound the physiologically meaningful range of HR for children [32]. This STFT procedure is identical to that previously demonstrated for HR estimation from PPG signals shown to be equivalent to standard electrocardiogram techniques [28].
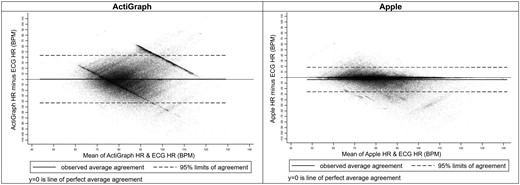
Bland-Altman plots for accelerometry predicted heart rate beats per minute for actigraph and apple.
Signal quality
A criterion-independent metric from the peak frequency detection used in previous work with chest placed PPG [28] was applied as an indicator of the quality of the HR obtained from wrist-based actigraphy in this study. The metric is given by the moving standard deviation of peak width for the highest intensity peak [28] over a specified number of STFT steps, which in this study was chosen arbitrarily to be 20 steps, or 145 seconds for subsequent statistical analysis. This poor signal quality is demonstrated by the blurring of colors producing a “streaky” appearance [28].
Statistical analyses
Analyses were completed in Stata (version 16.1, StataCorp LLC, College Station, Texas) and, consistent with best practice [33–35], HR estimates from the wrist actigraphy were compared with criterion estimates of beats per minute from the PSG electrocardiogram. We used Pearson’s correlation (r) to examine the relationship between the variance in actigraphy-derived HR and PSG electrocardiogram-derived HR. Lin’s concordance correlation coefficient (CCC) [36] explored the absolute agreement between the proxy and criterion estimated beats per minute. Bland-Altman plots were constructed to allow for visual inspection of the bias, limits of agreement, and trends in the agreement [37]. Mean absolute error (MAE) and mean absolute percent error (MAPE) were also calculated [33]. Analyses were completed overall and by signal quality metric. Signal quality was broken into quartiles as an indicator of quality. MAE was also calculated by demographics and sleep diagnosis as a sensitivity analysis.
Results
Demographics of the included children are presented in Table 1. Table 2 presents the metrics of agreement between PSG electrocardiogram and actigraphy-derived HR. For the GT9X, agreement metrics were weak: r = −0.12, CCC = −0.11, MAE = 16.8 (SD = 14.2), and MAPE = 20.4 (SD = 18.5). The GT9X’s performance was equally poor across PSG estimated sleep stages and signal quality.
Table of the Validity Statistics for the Accelerometer Predicted Heartrate Beats Per Minute From ActiGraph and Apple Watch
| Epochs | Pearson r | Lin’s CCC | Mean bias* | SD* | LOA* | MAE* | SD* | MAPE | SD | |||
|---|---|---|---|---|---|---|---|---|---|---|---|---|
| ActiGraph | Overall | 193 059 | −0.12 | −0.11 | 0.4 | (22.0) | (−42.6, 43.5) | 16.8 | (14.2) | 20.4 | (18.5) | |
| Signal quality | Highest | 45 185 | −0.08 | −0.07 | 5.2 | (24.6) | (−43.0, 53.5) | 19.1 | (16.4) | 23.8 | (23.0) | |
| High | 43 571 | −0.13 | −0.13 | 0.0 | (21.1) | (−41.3, 41.3) | 16.1 | (13.6) | 19.5 | (17.3) | ||
| Low | 43 614 | −0.15 | −0.15 | −0.8 | (21.1) | (−42.2, 40.6) | 16.1 | (13.7) | 19.4 | (17.0) | ||
| Lowest | 42 288 | −0.13 | −0.12 | −1.6 | (20.5) | (−41.9, 38.6) | 16.2 | (12.8) | 19.5 | (15.8) | ||
| Sleep stage | Lights on | 2825 | −0.18 | −0.13 | −12.0 | (21.9) | (−55.0, 31.0) | 19.6 | (15.5) | 22.6 | (23.7) | |
| Wake | 24 996 | 0.00 | 0.00 | −16.0 | (19.4) | (−54.0, 22.0) | 20.1 | (15.1) | 20.9 | (13.6) | ||
| N1 | 5573 | −0.10 | −0.10 | −5.8 | (21.3) | (−47.5, 35.8) | 16.8 | (14.2) | 19.4 | (16.7) | ||
| N2 | 73 370 | −0.07 | −0.07 | 4.9 | (20.7) | (−35.6, 45.4) | 16.1 | (13.8) | 20.9 | (20.1) | ||
| N3 | 58 013 | −0.11 | −0.11 | 4.1 | (20.6) | (−36.3, 44.4) | 16.0 | (13.6) | 20.0 | (18.8) | ||
| REM | 24 079 | 0.02 | 0.02 | −0.2 | (18.5) | (−36.5, 36.1) | 14.1 | (12.0) | 16.8 | (15.3) | ||
| Apple | Overall | 193 072 | 0.65 | 0.61 | −3.7 | (11.2) | (−25.7, 18.3) | 6.4 | (9.9) | 7.3 | (10.3) | |
| Signal quality | Highest | 50 176 | 0.88 | 0.88 | −1.5 | (6.5) | (−14.3, 11.2) | 2.3 | (6.3) | 2.6 | (6.5) | |
| High | 49 189 | 0.74 | 0.71 | −3.0 | (9.5) | (−21.6, 15.6) | 5.2 | (8.5) | 6.1 | (9.5) | ||
| Low | 47 064 | 0.55 | 0.48 | −4.7 | (12.5) | (−29.1, 19.7) | 8.2 | (10.5) | 9.4 | (10.8) | ||
| Lowest | 46 017 | 0.42 | 0.34 | −5.9 | (14.5) | (−34.4, 22.6) | 10.2 | (11.9) | 11.4 | (11.7) | ||
| Sleep stage | Lights on | 2819 | 0.16 | 0.11 | −10.0 | (16.5) | (−42.3, 22.3) | 13.4 | (13.9) | 15.4 | (20.4) | |
| Wake | 24 999 | 0.33 | 0.22 | −12.9 | (15.7) | (−43.7, 17.9) | 14.6 | (14.1) | 15.0 | (12.7) | ||
| N1 | 5573 | 0.47 | 0.38 | −7.8 | (13.1) | (−33.5, 17.9) | 10.0 | (11.5) | 10.9 | (10.9) | ||
| N2 | 73 377 | 0.78 | 0.77 | −1.3 | (8.1) | (−17.2, 14.6) | 4.5 | (6.8) | 5.7 | (8.4) | ||
| N3 | 58 017 | 0.81 | 0.80 | −1.8 | (7.5) | (−16.6, 13.0) | 4.0 | (6.7) | 4.8 | (7.8) | ||
| REM | 24 082 | 0.78 | 0.76 | −2.9 | (7.7) | (−18.0, 12.1) | 5.0 | (6.6) | 5.8 | (7.2) |
*Metric in beats per minute, one heartrate estimate produced every 7.3 seconds.
Abbreviations: SD: standard deviation; MAE: mean absolute error; MAPE: mean absolute percent error; REM: rapid eye movement.
Conversely, AWS7 agreement metrics were moderate to strong with r = 0.65, CCC = 0.61, MAE = 6.4 (SD = 9.9), and MAPE = 7.3 (SD = 10.3). For AWS7, there was a clear pattern of agreement by sleep stage with stronger agreement between accelerometer estimated HR and PSG electrocardiogram in stage N2 (r = 0.78, CCC = 0.77, MAE = 4.5 SD = 6.8, MAPE = 5.7 SD = 8.4), N3 (r = 0.81, CCC = 0.80, MAE = 4.0 SD = 6.7, MAPE = 4.8 SD = 7.8), and REM (r = 0.78, CCC = 0.76, MAE = 5.0 SD = 6.6, MAPE = 5.8 SD = 7.2) than during sleep stage N1 (r = 0.47, CCC = 0.38, MAE = 10.0 SD = 11.5, MAPE = 10.9 SD = 10.9) or time awake (r = 0.33, CCC = 0.22, MAE = 14.6 SD = 14.1, MAPE = 15.0 SD = 12.7) when children were likely moving more.
Predictably, there was also a clear pattern of agreement by the signal quality metric for AWS7 with stronger agreement in the highest- (r = 0.88, CCC = 0.88, MAE = 2.3 SD = 6.3, MAPE = 2.6 SD = 6.5) and high-quality (r = 0.74, CCC = 0.71, MAE = 5.2 SD = 8.5, MAPE = 6.1 SD = 9.5) data when compared to low- (r = 0.55, CCC = 0.48, MAE = 8.2 SD = 10.5, MAPE = 9.4 SD = 10.8) and lowest-quality (r = 0.42, CCC = 0.34, MAE = 10.2 SD = 11.9, MAPE = 11.4 SD = 11.7) data.
Bland-Altman plots for the GT9X and AWS7 are presented in Figure 4. Figures 5 and 6 present Bland-Altman plots by signal quality and sleep stage. Figure 7 presents the number of readings within 5 beats per minute, between 5 and 10 beats per minute, and ≥ 10 beats per minute different than PSG electrocardiogram HR overall, by signal quality, and by sleep stage.
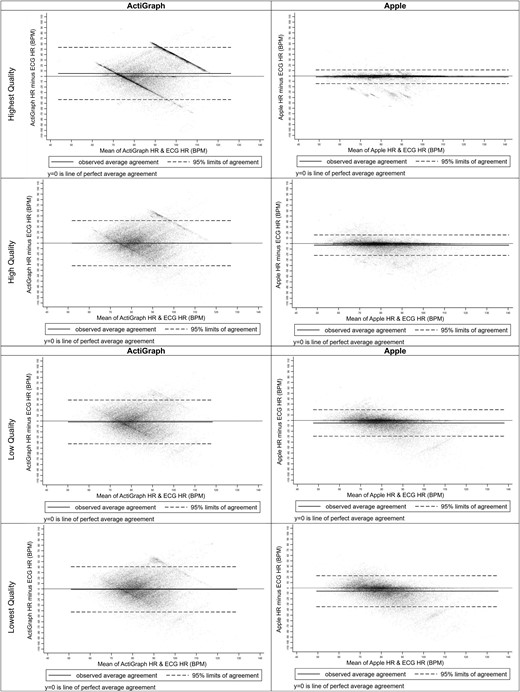
Bland-Altman plots for accelerometry predicted heart rate beats per minute for actigraph and apple by signal quality. Abbreviations: BPM, beats per minute; ECG, electrocardiogram; HR, heart rate.


Bland-Altman plots for accelerometry predicted heart rate beats per minute for actigraph and apple by sleep stage. Abbreviations: BPM, beats per minute; ECG, electrocardiogram; HR, heart rate; REM, rapid eye movement.
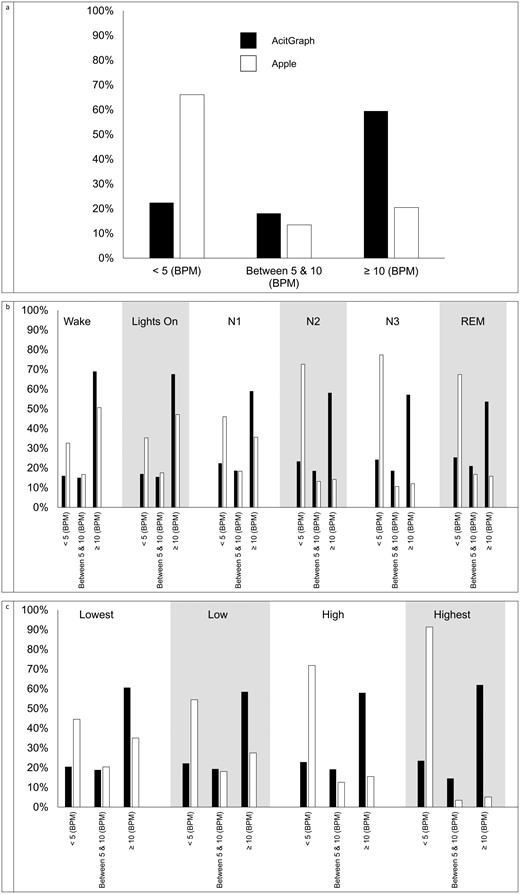
Percent of HR estimates < 5 BPM, between 5 and 10 BPM, and ≥ 10 BPM different than ECG for actigraph and Apple (A) overall, (B) by sleep stage, and (C) by signal quality. Abbreviations: BPM, beats per minute; ECG, electrocardiogram; HR, heart rate; REM, rapid eye movement.
Sensitivity analyses are presented in Supplementary Table S1. No statistically significant differences were detected by demographics for the GT9X. For AWS7 children with obesity had higher MAE (difference = 4.1 bpm, 95% CI = 0.9, 7.3 bpm) compared to children classified as normal weight. There was also a clear pattern of lower MAE for children without a sleep diagnosis. However, the only difference to reach statistical significance was for children with a diagnosis of mild obstructive sleep apnea (difference = 3.2 bpm, 95% CI = 0.0, 6.4 bpm).
Discussion
This study explored the ability of wrist-placed actigraphy to detect children’s pulse in the wrist during sleep, much like feeling for a person’s pulse in their arm. Two devices, the GT9X and AWS7, were used to detect HR from low-frequency vibrations in the wrists of children who were participating in an overnight sleep study, and the scripts for how this was done are made available here:https://github.com/ACOI-UofSC/Manuscript/tree/main/ScriptsSupplementary. AWS7, the consumer wearable, performed dramatically better than the GT9X, the research-grade device. Actigraphy-estimated HR has several practical applications for the measurement of movement behaviors in children. One of the practical implications is the ability to increase the specificity of free-living sleep estimation and the ability to estimate sleep architecture, without sacrificing battery life or increasing cost. However, these applications cannot be realized if actigraphy collected via research grade monitors cannot estimate HR. Thus, it is critical that the reason behind the GT9X’s inability to estimate HR and different research-grade accelerometer’s ability to estimate HR be explored in future studies.
At least three previous studies have explored the ability of wrist-placed actigraphy to detect HR during sleep [19–21]. However, this study is unique because it was conducted with a widely available research grade and consumer wearable device and was conducted with children. Similar to the current study bias, previous studies identified variable bias ranging from < 5 to ≥ 120 bpm. These studies also found that large movements that are characteristic of wakefulness and lighter sleep stages were related to larger bias in the HR detection from actigraphy compared to PSG electrocardiogram. This is likely because the low amplitude of the HR signal (~6 milli-g) is overwhelmed by larger movements. In our approach, we introduce a smoothing operation (equation 2) to further reduce the noise floor, extending applicability to a larger number of participants, as well as other devices beyond those in this study. Another significant contribution of this paper is the introduction of a criterion independent metric of signal quality. One previous study produced a metric of signal quality but that metric was dependent on having both the criterion ECG data in addition to the proxy accelerometry signal used for estimating HR [20], although this defeats the goal of using wearables for free-living assessment of sleep where ECG may not be available. The signal quality metric produced herein is not reliant upon the criterion ECG data and thus can be used in the field to identify lower and higher quality data. This metric in and of itself may also be an important indicator of sleep stage, as sleep stage and signal quality appear to be related.
In this study, actigraphy data collected via AWS7 consistently outperformed data collected via the GT9X. It’s important to note that the underlying “raw” signal (i.e. x, y, and z data) were collected from both the AWS7 and GT9X. Presumably, they should be measuring the same thing. Thus, it is surprising that the GT9X data fails to detect HR signal. However, given that the typical acceleration signal corresponding to HR is close to the accelerometer’s noise floor, any additional noise from suboptimal device or circuit design can pollute this signal. This noise pollution could be responsible for the GT9X’s poor performance in this study. A comparison of the GT9X and AWS7 signals in the frequency domain (Supplementary Figure S1) reveals a clear periodic artifact well above the noise floor in the GT9X signal not present in the AWS7 signal. This is also evident in the Bland Altman plots and is represented by the two parallel diagonal lines. These periodic spikes are separated by 2 Hz with minor spikes between these larger spikes at 1 Hz spacings. Given that the Fourier transform of a pulse train in frequency is a pulse train in time [38], this means that the GT9X’s design leads to a large signal artifact twice in a second, indicating some large power usage twice a second, possibly due to data writing to memory, or other routine function in the operation of the device. There are many potential reasons for these spikes to occur, although two common design shortcomings in electrical systems could be responsible [39]. First, undersized smoothing capacitance leading to power spikes during periods of large power usage could be responsible. For example, data writing to memory, which represents a large power draw, could pollute accelerometer operation. Second, poor electrical shielding could lead to pollution of the accelerometer sensor signal from radiated noise during power spikes. Ideally, such power spikes do not occur, and the success of our approach on AWS7 devices supports the use of accelerometry as a proxy for HR during sleep. This finding has implications for “device-agnostic” algorithms for sleep detection, that seek to predict sleep from the raw actigraphy output no matter the device from which it was collected. It is well documented that differences in the range, resolution, and sampling rate of different actigraphy devices can lead to different raw actigraphy output [40–42]. These findings have led to work to harmonize actigraphy output from devices with varying range, resolution, and sampling rates [43]. However, further work may be needed when the acceleration signal of interest approaches the accelerometer’s noise floor (i.e. like during sleep or when exploring the ability of actigraphy to estimate HR). Furthermore, these artifacts, such as the one observed in the GT9X, may not be persistently present or absent. It is conceivable that an artifact could be fixed in devices and models that previously displayed an artifact via software updates or hardware changes. Furthermore, artifacts could be introduced in devices or models that did not previously exist when updates are made. Therefore, researchers must stay vigilant as periodic artifacts, may be present in other devices and devices introduced in the future.
Collecting HR estimates has practical implications for the measurement of free-living sleep with children. Wrist-based actigraphy is a common method of measuring free-living sleep but demonstrates limited performance in wake classification [44–46] and cannot measure sleep architecture [47, 48]. While adding a measure of HR to actigraphy can address both these issues [13, 14, 44], a second sensor is costly and drains a device’s battery very quickly essentially shrinking the measurement window from weeks to days [15]. The method of measuring HR from wrist-placed actigraphy has the potential to improve wake classification and allow for the detection of sleep architecture without adding another data collection sensor. This approach may allow for the measure of these metrics without draining the battery of wrist-placed wearable devices or adding cost. This paper describes a significant step towards achieving these goals and overcoming these limitations demonstrating the ability to detect HR in the accelerometer signal and the utility of a signal quality metric.
The current study has several strengths. First, this study filled a gap in previous literature by including children. Second, the utility of a simple and criterion-independent metric of signal quality was applied to actigraphy data to gauge the confidence one should have in the estimated HR. Third, the study used an accepted criterion of HR with which to compare actigraphy-estimated HR. However, the findings of the current study should also be considered in light of its limitations. These limitations include the use of a single night of sleep recording from PSG electrocardiogram as criterion. While we were able to collect HR estimates during periods of low movement in sleep it remains to be tested if the same methodology could be applied to periods of low movement while children are awake. Furthermore, the children included in this study were referred to the pediatric sleep clinic by their primary care physician due to suspected sleep disruptions, and 65% of the participants were diagnosed with mild or moderate obstructive sleep apnea. Thus, it is unclear if the findings herein would be applicable in a population of children that did not experience sleep disruptions.
The current study described a method of estimating HR in children during sleep using low-frequency vibrations detected by wrist-placed actigraphy. Actigraphy data collected via AWS7, but not the GT9X, shows promise for detecting HR. This study also demonstrated the utility of a signal quality metric by showing that HRs extracted with higher quality signals were more accurate.
Supplementary material
Supplementary material is available at SLEEP online.
Funding
Research reported in this publication was supported in part by the National Institute of Diabetes and Digestive and Kidney Diseases Award Number R01DK129215. Olivia Finnegan was supported by National Institute of General Medical Sciences Award Number T32GM081740 and T32GM145226 while James White was supported by National Institute of Diabetes and Digestive and Kidney Diseases Award Number F31DK136205. Elizabeth Adams and Sarah Burkart were supported in part by National Institute of General Medical Sciences Award Number P20GM130420. The content is solely the responsibility of the authors and does not necessarily represent the official views of the National Institutes of Health. MVS Chandrashekhar gratefully acknowledges support from the National Science Foundation (award ECCS2246582), Air Force Office of Scientific Research (award FA9550-23-1-0506), Office of Naval Research (award MURI N00014-18-1-2429), National Institutes of Health (Award R01HL171295), as well as the USC Research Institute for Extreme Chips and Entrepreneurship.
Disclosure statement
Financial disclosure: Dr. de Zambotti has received research funding unrelated to this work from Noctrix Health Inc. and Verily Life Science LLC and Honda Motor Co., Ltd. Nonfinancial disclosure: Unrelated to this work Dr. Weaver and Dr. Armstrong report board membership and ownership shares in Trackster LLC. MdZ is a co-founder and Chief Scientific Officer at Lisa Health Inc. MdZ has ownership of shares in Lisa Health Inc.
Data availability
The scripts and data underlying this article are available here: https://github.com/ACOI-UofSC/Manuscript/tree/main/Scripts_Supplementary.


Comments