


Abstract
Patients with Parkinson’s disease and multiple system atrophy may be subject to sleep state dissociation. Motivated by the fortuitous observation of prominent facial muscle activity during video-polysomnography in patients with multiple system atrophy, we assessed facial motor activity and chin muscle tone during sleep in multiple system atrophy compared to Parkinson’s disease and controls.
A sleep expert blinded to pathology and sleep stage retrospectively analyzed facial activity in 62 video-polysomnography (11 multiple system atrophy, 38 Parkinson’s disease, and 13 controls). Facial movements were classified into six categories: “Eyes closing/opening,” “Eyebrows frowning,” “Raising eyebrows,” “Smiling,” “Other mouth movements,” and “Strained face,” an expression involving both the superior and inferior parts of the face. Chin electromyography activity was quantified during Rapid Eye Movement (REM) and Non-Rapid Eye Movement (NREM) sleep using the atonia index, a validated algorithm.
Multiple system atrophy patients had an increased number of all facial movements compared to controls during NREM. “Strained face” was significantly more frequent in multiple system atrophy compared to Parkinson’s disease, even after adjusting for the presence of REM sleep behavior disorder (RBD). Atonia index was lower in multiple system atrophy compared to controls and Parkinson’s disease during REM and NREM sleep. This difference remained significant compared to Parkinson’s disease in NREM sleep during N1 and N2 after adjusting for the presence of RBD.
Facial movements during sleep are frequent in multiple system atrophy, “strained face” appears to be a hallmark of this condition. The presence of increased facial activity and elevated muscle tone during all stages of sleep in multiple system atrophy may be a manifestation of sleep state dissociation, reflecting more severe neurodegeneration.

Sleep state dissociation is the simultaneous presence of characteristics from different states of being during sleep and it is frequently found in neurodegenerative diseases. We reported increased muscle facial activity in multiple system atrophy (MSA), namely a contraction of both the upper and lower parts of the face that we called “strained face,” compared to patients with Parkinson’s Disease and controls, and which appears to be a hallmark of this condition. We also found increased chin muscle tone in patients with MSA during both NREM sleep, particularly during N1 and N2, and REM sleep, reflecting a more severe neurodegenerative process in MSA.
Introduction
Muscle tone during sleep varies according to the different stages of sleep, ranging from sustained muscle tone during stages of light sleep to muscle atonia during REM sleep [1]. During physiological REM sleep, twitches or phasic muscle activity can also be observed superimposed on muscle atonia.
Some studies have assessed the presence of facial muscle activity during REM sleep, especially in relationship to dreaming and its emotional content. In premature children, smiling has been described during active sleep, which is the precursor of REM sleep, and smiling activity continues randomly during sleep throughout the first months, to disappear after the first year of life. However, only very few studies have explored facial activity during sleep in adults.
A study carried out on healthy volunteers using both visual analyses of facial expressions during video-polysomnography (vPSG) and electromyography (EMG) of mimic muscles (zygomatic, orbicularis, and corrugator), showed the presence of activity of these muscles during all sleep stages. EMG activity was significantly higher during REM sleep, low during NREM sleep stages N1 and N2 and almost absent during N3 (slow-wave sleep) [2]. The duration of muscle activation was longer during REM sleep and stage N2 than during the other stages.
Cle et al. [3] analyzed the occurrence of smiling expression during sleep in 174 subjects with REM and NREM parasomnias and healthy controls. Smiling during NREM sleep was very rare and occurred mostly in patients with parasomnia and only one healthy control.
Maranci and colleagues [4] studied the EMG activity of the corrugator muscle and the occurrence of negative facial expressions such as “frowning” during all sleep stages, to explore the possible link between facial expressions and emotions during sleep. They found that frowning can be observed in adults during both normal and disordered sleep and that EMG activity of the corrugator muscle was present in healthy subjects, especially during REM sleep, but also during all NREM sleep stages.
REM sleep behavior disorder is a parasomnia characterized by loss of normal muscle atonia during REM sleep associated with dream-enacting behavior [5]. This condition can be isolated or associated with neurodegenerative disorders mostly belonging to the alpha-synucleinopathies, including Parkinson’s disease (PD) and multiple system atrophy (MSA) [6]. In particular, RBD is observed in about 50% of PD and more than 80% of MSA patients [7].
In advanced PD and MSA, sleep state dissociation, which consists of the simultaneous presence of characteristics from different states of being, may be observed [8]. Loss of normal atonia during REM sleep and its behavioral correlate of RBD is an example of a dissociated state arising from REM sleep, with an admixture of features from different states, namely an intrusion of elements of wakefulness into REM sleep [9]. Furthermore, the occurrence of motor behavioral episodes associated with an intrusion of REM sleep phasic activity and rapid eye movements during NREM sleep has been anecdotally described in PD patients. The presence of movements, such as sudden trunk or limb jerks during NREM sleep in MSA patients, associated with an increased index of periodic limb movements during sleep (PLMS) has also been observed as an expression of altered motor control during sleep in this condition [10].
Our study has been driven by the fortuitous observation of prominent facial activity during nocturnal vPSG during both NREM and REM sleep in patients affected by MSA, with or without RBD. We then hypothesized that the presence of facial activity during NREM sleep might be found in both MSA and PD but not in controls, as a manifestation of sleep state dissociation related to the neurodegenerative process. Furthermore, we hypothesized that this facial activity may be higher in MSA compared to PD patients. Finally, we also hypothesized that muscle tone during both NREM and REM sleep may be impaired in MSA as well as in PD, representing a further expression of sleep state dissociation.
The aim of this study was to assess the presence of facial activity and to quantify chin muscle activity during both NREM and REM sleep in MSA and PD, compared to controls.
Methods
Subjects
vPSG recordings of 54 consecutive PD patients and 12 consecutive MSA patients performed at the Sleep Center of the University Hospital in Clermont-Ferrand, France, together with recordings of three MSA patients performed at the Sleep Medicine Centre of the University of Cagliari (Italy), and of 18 control subjects were retrospectively analyzed.
Patients with PD were diagnosed according to MDS criteria [11] and MSA diagnosis was performed according to the criteria proposed by the American Academy of Neurology consensus [12]. Control subjects were selected from a pool of consecutive individuals, age-matched with PD and MSA patients, who underwent vPSG at the University Hospital, Clermont-Ferrand. They were addressed for sleep complaints such as insomnia, suspected sleep apnea, or hypersomnia, not confirmed by vPSG, and were free of neurological disease or history of NREM or REM parasomnia.
Patients and controls who showed insufficient REM sleep (<5 min) during their vPSG (n = 5 PD), or whose faces were not clearly visible during more than 30% of the video-recording time (n = 11 PD, n = 3 MSA, n = 5 controls) were excluded.
As the main focus of this study was facial activity during NREM sleep, and because MSA is a rare disease, for the purpose of the analysis of facial muscle activity in MSA we decided not to exclude one MSA patient who did not have REM sleep during the recording. Therefore, the analysis was performed on 11 MSA (9 Parkinson-predominant subtypes [MSA-P] and 2 cerebellar-predominant subtypes [MSA-C]).
Clinical and demographic data including disease duration, levodopa equivalent daily dose (LEDD), and history of RBD at the time of the recording, were gathered from clinical recordings.
The study was conducted accordingly to the principles outlined by the Declaration of Helsinki.
Polysomnographic recording
All the subjects underwent one full-night attended vPSG in the sleep laboratory. vPSG was performed with digitally synchronized videography and the following montage was employed: electroencephalographic leads (F3-A2, F4-A1, C3-A2, C4-A1, O1-A2, O2-A1), left and right electrooculography (EOG) channels, bilateral surface submentalis EMG, and electrocardiography. The respiratory analysis included nasal airflow, which was recorded by both thermistor and nasal pressure sensor, thoracic and abdominal respiratory effort, oxygen saturation recorded by cutaneous finger pulse-oxymeter and microphone. Patients were asked to sleep uncovered to improve the detection of motor activity, but a light sheet could be allowed for their comfort. Sleep staging was performed by a Neurologist, board certified in sleep medicine, according to the AASM criteria [13]. The following sleep data were collected for descriptive purposes: total bedtime (TIB), total sleep time (TST), sleep efficiency (SE), sleep latency (SL), wakefulness after sleep onset (WASO), percentage of time in each sleep stage (N1, N2, N3, R), arousal index, periodic limb movements during sleep index (PLMSi), apnea-hypopnea index (AHI).
Analysis of facial activity
All the recordings were anonymized. Videos were extracted from vPSG and examined by a sleep expert (RL) who was blinded to the clinical condition and sleep staging. To detect movements, full-night video was viewed beforehand at augmented speed (10×), which was believed to be the maximum speed at which all small movements were detectable. Then, every episode was analyzed at normal speed. Some recordings (n = 18) were performed using a supplementary camera dedicated to the face, the others were analyzed by carefully zooming in on the images of the face.
Each facial movement detected was classified according to six main categories: (1) “Eyes closing/opening,” including squinting movements and definite opening/closing of eyelids; (2) “Eyebrows frowning”; (3) “Raising of eyebrows”; (4) “Smiling,” including every movement of lip corners raising similar to smiling, both bilateral and unilateral; (5) other “mouth movements” including complex movements such as chewing or lip smacking, and excluding movements related to the normal respiratory activity; (6) “Strained face” consisting of a particular expression involving both the superior and inferior parts of the face, resulting in a scrunched up and tensed expression.
After the analysis of all the videos, PSG recording scorings were unblinded to the examinator who noted down in which stage of sleep the detected movements had occurred. We considered a single facial movement when there was a well-defined movement of a part of the face (e.g. raising the brow) that clearly stood out from the previous resting expression and was followed by at least 2 seconds of facial inactivity.
The total number of each type of facial movement during REM and NREM sleep was assessed. Furthermore, an hourly index of detected facial movements was calculated for all types of movements. However, since the indexes for each single type of facial movement were too small, only an index of the total movements was considered for statistical purposes,
Muscle tone analysis
Automatic quantification of the chin EMG activity was performed according to a validated automatic scoring algorithm, by means of the HypnoLab software (SWS-Soft, Italy). The atonia index (AI) was computed for all sleep stages and could vary from 0 to 1. An AI value of 1 indicates complete atonia, whereas an AI value of 0 indicates the complete absence of EMG atonia [14]. This method has been validated for the quantification of REM sleep without atonia (RSWA) in RBD and normal controls and has shown a good correlation with manual scoring methods [15, 16], but it may also be employed to assess muscle tone in NREM sleep [17]. We computed AI during N1, N2, N3, and REM sleep stages.
Statistical analysis
Statistical analysis was performed using Stata software (version 15, StataCorp, College Station, Texas, USA). Data were presented as mean and standard deviation and as median and interquartile range. The Shapiro-Wilk test was used to test the assumption of distribution normality for quantitative parameters. When the inflate of zeros was too high, it was decided to report results with mean and standard deviation. The comparisons between pathology groups were performed using Analysis of Variance (ANOVA) or the Kruskal–Wallis test when the assumptions of ANOVA were not met. Homoscedasticity was analyzed using the Bartlett test. When appropriate (omnibus p-value less than .05), post hoc test for two-by-two multiple comparisons were carried out taking into account correction of the type I error, i.e., Tukey–Kramer after ANOVA and Dunn after Kruskal–Wallis. Then, multivariable analyses were carried out adjusting univariate results for age and REM or NREM sleep duration. More precisely, a linear multiple regression was performed, applying a Sidak type I error correction for multiple comparisons between pathology groups. The results were expressed as Hedges’ effect size (ES) and 95% confidence intervals estimated according to multivariable results, and were interpreted according to Cohen’s rules of thumb which define effect-size bounds as small (ES ≈ 0.2), medium (ES ≈ 0.5), and large (ES ≈ 0.8 and higher: grossly perceptible and therefore large). Furthermore, comparisons between groups for categorical data were performed using Chi-squared or Fisher’s exact tests followed, when appropriate, by the Marascuilo post hoc test. The statistical tests were two-sided, with the type I error at 0.05. As these analyses could be considered as exploratory, individual p-values were reported without applying any mathematical correction but paying specific attention to the magnitude of differences (i.e., ES), according to several works reported in the literature, such as those discussed by Bender and Lange [18].
Results
Clinical and demographic data of patients and controls are shown in Table 1. The three groups did not differ in terms of age and sex distribution. Patients with MSA and PD had comparable mean LEDD. Disease duration was shorter in MSA patients compared to the PD group.
Clinical and Demographic Data of Patients With MSA and PD and Controls
| MSA | PD | Controls | P-value | |
|---|---|---|---|---|
| Age, years | 60.8 ± 8.34 | 66.9 ± 9.05 | 67.5 ± 6.4 | 0.18 |
| Men (n, %) | 4 (36.6%) | 25 (65.8%) | 7 (53.8%) | 0.31 |
| LEDD, mg | 554.2 ± 479.24 | 696.4 ± 460.07 | NA | 0.46 |
| Disease duration, years | 1.9 ± 2.1 | 7.6 ± 5.5 | NA | 0.13 |
MSA, multiple system atrophy; PD, Parkinson’s disease; LEDD, levodopa equivalent daily dose; NA, not applicable. Data are expressed as mean ± standard deviation or number (percentage of total).
PSG features are shown in Table 2. TST, SE, and WASO were similar between groups. No differences were found in the percentages of NREM and REM sleep stages, while REM sleep duration was reduced in PD, compared to the other groups. No significant difference was observed in AHI. PLMSi was significantly different between the three groups, with the highest rate in MSA patients, followed by the PD group, and the lowest value found in controls. Twenty-five out of 38 (63%) PD patients and 10/11 (90%) of MSA patients had been diagnosed with RBD according to ICSD-3 criteria [19].
Polysomnographic Features in Patients With MSA and PD and Controls
| MSA (n = 11) | PD (n = 38) | Controls (n = 13) | P-value | |
|---|---|---|---|---|
| Total sleep time, min | 349.1 ± 117.31 | 345.5 ± 61.59 | 377.1 ± 60.72 | NS |
| Sleep efficiency, % | 69.0 ± 23.74 | 75.0 ± 13.10 | 80.9 ± 10.88 | NS |
| Awakenings, number | 19.5 ± 12.57 | 29.5 ± 19.62 | 18.4 ± 8.83 | NS |
| Arousal index, number/hour of TST | 10.5 ± 7.58 | 7.8 ± 4.96 | 2.8 ± 2.62 | NS |
| Wakefulness after sleep onset, min | 99.8 ± 59.15 | 87.1 ± 67.07 | 69.7 ± 40.49 | NS |
| Sleep stage N1, % | 7.5 ± 2.64 | 9.2 ± 7.40 | 7.1 ± 5.52 | NS |
| Sleep stage N2, % | 57.4 ± 10.92 | 59.1 ± 13.94 | 47.0 ± 5.63 | NS |
| Sleep stage N3, % | 22.5 ± 11.99 | 21.1 ± 10.49 | 26.2 ± 12.26 | NS |
| NREM sleep duration, min | 297.5 ± 103.4 | 308.8 ± 57 | 320.4 ± 42.76 | NS |
| Sleep stage R, % | 13.0 ± 8.5 | 10.5 ± 6.3 | 19.4 ± 12.55 | NS |
| REM sleep duration, min | 51.6 ± 42.88 | 36.7 ± 23.12 | 56.7 ± 29.70 | 0.011* |
| AHI, number/h | 11.7 ± 12.6 | 6.0 ± 10.5 | 5.3 ± 5.0 | NS |
| PLMS, number/h | 51.1 ± 48.35 | 23.3 ± 28.99 | 9.6 ± 20.01 | 0.028* |
| RBD episodes, number (%) | 10 (90%) | 25 (63%) | 0 (0%) |
MSA, multiple system atrophy; PD, Parkinson’s disease; TST, total sleep time, AHI, apnea-hypopnea index, PLMS, periodic limb movements during sleep, RBD, REM sleep behavior disorder. Data are expressed as mean ± standard deviation or number (percentage of total). *α<0.05
The total facial movements index during NREM sleep was 8.25 ± 16.70 in MSA, 2.10 ± 2.13 in PD, 0.02 ± 0.29 in controls, and it was significantly higher in PD patients compared to controls (p < .001). During REM sleep, the total facial movement index was 18.28 ± 17.54 for the MSA group, 7.41 ± 11.09 for PD and 0.27 ± 0.60 in the control group, with a significant difference between each of the two patient groups compared to controls (PD vs. controls: p = .01; MSA vs. controls: p = .04).
The results of the analysis of each type of facial movements during NREM sleep are shown in Table 3. In most controls, no facial movements were detected during NREM sleep, therefore the mean number for each category was <1. The mean total number of facial movements was significantly different between the three groups. Pairwise comparison showed a higher number of facial movements in both PD patients vs. controls, and MSA patients vs. controls, but no difference between PD and MSA patients.
Number of Episodes of Facial Movements During NREM Sleep
| Univariate analysis | Multivariate analysis A = PD vs. HC B = MSA vs. HC C = PD vs. MSA D = PD vs. MSA, adjusted for RBD | ||||
|---|---|---|---|---|---|
| Type of facial movements | MSA (n = 11) | PD (n = 38) | HC (n = 13) | P-value | Effect size, [CI 95%], P value |
| Eyes closing | 5.82 ± 10.79 | 2.53 ± 2.81 | 0.69 ± 1.31 | .0359* | A: ES = 0.36, [0.39; 0.69], p = .029* B: ES = 0.66, [0.06; 1.27], p = .032* C: ES = 0.10, [−0.42; 0.23], p = .556 D: ES = 0, [0.33; 0.33], p = .996 |
| Frowning eyebrows | 0.82 ± 0.87 | 0.62 ± 1.03 | 0 | .0190* | A: ES = 0.37, [0; 0.70], p = .026* B: ES = 0.73, [0.13; 1.33], p = .019* C: ES = 0.13, [−0.46; 1.19], p = .418 D: ES = 0.21, [0.04; 0.96], p = .229 |
| Raising eyebrows | 5.27 ± 4.63 | 5.24 ± 8.47 | 0.30 ± 0.48 | .0007** | A: ES = 0.61, [0.28; 0.93], p = .000* B: ES = 0.82, [0.21; 1.42], p = .001* C: ES = 0.10, [−0.42; 0.23], p = .559 D: ES = 0.01, [−0.33; 0.32], p = .09 |
| Smiling | 2.89 ± 5.09 | 0.62 ± 1.634 | 0.08 ± 0.28 | .0291* | A: ES = 0.19, [−0.52; 0.52], p = .24 B: ES = 0.82, [0.21; 1.42], p = .009* C: ES = −0.55, [−0.68; −0.03], p = .035* D: ES = 0.19, [0.04; 1.0], p = .38 |
| Mouth movements | 3.09 ± 5.26 | 1.13 ± 2.34 | 0.08 ± 0.27 | .0534 | A: ES = 0.24, [−0.08; 0.57], p = .083 B: ES = 1.11, [0.50; 1.71], p = .019* C: ES = 0.43, [−0.82; 0.17], p = .20 D: ES = 0.31, [−0.59; −0.03], p = .496 |
| Strained face | 8.36 ± 20.30 | 0.87 ± 1.80 | 0.07 ± 0.28 | .0051* | A: ES = 0.24, [−0.08; 0.57], p = .144 B: ES = 1.11, [0.50; 1.71], p = .001* C: ES = 0.49, [−0.82; −0.17], p = .004** D: ES = 0.36, [−0.59; −0.03], p = .031* |
| Total | 26.27 ± 37.01 | 11.053 ± 12.63 | 1.23 ± 1.64 | .0001** | A: ES = 1.23, [0.70; 1.75], p < .0001** B: ES = 1.37, [0.76; 1.97], p < .0001** C: ES = 0.19, [−0.51; 0.14], p = .248 D: ES = 0.09, [0.042; 0.23], p = .56 |
Results of the univariate analysis and multivariate analysis. Results of univariate analysis are expressed as mean ± standard deviation. Results of the multivariate analysis are expressed in terms of effect size, 95% confidence interval (CI), and p value. Comparisons between the three groups were adjusted for age and duration of NREM sleep. A and B represent comparison between PD and MSA vs. Healthy Controls, C represents comparison between PD group vs. MSA group, and D represents the same comparison adjusted for the presence of RBD.*α<0.05; **α<0.005
For each movement category during NREM sleep, pairwise comparison showed that MSA patients had an increased number of all types of movements compared to controls. No differences were found between MSA and PD patients with regard to movements such as “eyes closing,” “eyebrows raising,” “eyebrows frowning,” and movements of the mouth. However, facial movements such as “strained face” and “smiling” were significantly more frequent in MSA patients compared to PD. Also, after adjusting for the presence of RBD, movements such as “strained face” were still more frequent in MSA than PD, while “smiling” was not.
Similar to NREM sleep, most controls did not manifest any facial movement during REM sleep as well; therefore, the mean number for each movement category was below 1. The results of the analysis of facial movements during REM sleep are shown in Table 4. Pairwise comparison showed that MSA patients had a higher number of all types of movements during REM sleep than controls, except for “eyebrows frowning.” PD and MSA patients did not show significant difference in eye closing, eyebrow raising, eyebrow frowning, and movements of the mouth. However, similarly to NREM sleep, during REM sleep facial movements such as “strained face” and “smiling” were significantly more frequent in MSA compared to the PD group, and the difference was still significant after adjusting for the presence of RBD.
Univariate and Multivariate Analyses of the Number of Episodes of Facial Movements During REM Sleep
| Univariate analysis | Multivariate analysis A= PD vs. HC B= MSA vs. HC C= PD vs. MSA D= PD vs. MSA adjusted for RBD | ||||
|---|---|---|---|---|---|
| Type of activity | MSA (n = 10) A | PD (n = 38) B | HC (n = 13) C | P-value | Effect size, [CI 95%], P value |
| Eyes Closing | 1.7 ± 2.41 | 1.18 ± 2.06 | 0.15 ± 0.38 | .09 | A: ES = 0.53 [0.21; 0.86], p = .002** B: ES = 0.72 [0.9; 1.36], p = .03* C: ES = 0.04 [−0.28; 0.37], p = .79 D: ES = 0.07 [−0.26; 0.39], p = .69 |
| Eyebrows frowning | 0.8 ± 1.88 | 0.5 ± 1.47 | 0 | .14 | A: ES = 0.29 [−0.04; −0.61], p = .08 B: ES = 0.57 [0.06; 1.21], p = .075 C: ES = −0.82 [−0.41; 0.24], p = .62 D: ES = 0.01 [−0,33; 0,32], p = .9 |
| Eyebrows rising | 9.8 ± 17.84 | 2.39 ± 4.86 | 0 | .005* | A: ES = 0.57, [0.24; 0.89], p = .001** B: ES = 1.33, [0.69; 1.96], p < .0001** C: ES = 0.28, [−0.61; 0.04], p = .09 D: ES = 0.12, [0.45; 0.21], p = .45 |
| Smiling | 2.5 ± 3.95 | 0.26 ± 0.75 | 0 | .0003** | A: ES = 0.35, [0.28; 0.68], p = .034* B: ES = 1.57, [0.94–2.21], p = <.0001** C: ES = 0.61, [−0.94; −0.29], p = <.0001** D: ES = 0.44, [−0.76; −0.11], p = .01* |
| Mouth movements | 1.4 ± 2.01 | 0.32 ± 1.07 | 0.08 ± 0.28 | .0119* | A: ES = 0.08, [−0.24; 0.41], p = .602 B: ES= 0.85, [0.22–1.49], p = .01* C: ES = 0.43, [0.75; 0.10], p = .01* D: ES = 0.31, [−0.63; −0.02], p = .066 |
| Strained Face | 2.79 ± 4.24 | 0.57 ± 1.67 | 0 | 0.0001** | A: ES = 0.35, [0.02–0.67], p = .04* B: ES = 1.36, [0.72; 1.99], p < . 0001** C: ES = −0.49, [−0.82; 0.17], p = .004** D: ES = 0.34, [−0.67; −0.02], p = .04* |
| Total | 20.89 ± 24.62 | 5.24 ± 9.34 | 0.23 ± 0.44 | <.0001** | A: ES = 0.68, [0.35; 1.00], p = <.0001** B: ES = 1.61, [0.97; 2.24], p < .0001** C: ES = 0.36, [−0.50; −0.03], p = .03* D: ES = 0.22, [−0.44; 0.11], p = .18 |
Results are expressed as mean± standard deviation. Results of the univariate analysis and multivariate analysis. Results of the multivariate analysis are expressed in term of Effect Size, 95% Confidence interval (CI), and p value. Comparisons between the three groups were adjusted for age and duration of REM sleep. A and B represent comparisons between PD and MSA vs. Healthy Controls, C represents comparison between PD group vs. MSA group, and D represents the same comparison adjusted for the presence of RBD. *α<0.05; *α<0.05; **α<0.005
AI was significantly lower in MSA compared to controls during all sleep stages. No significant differences in AI between PD and controls were found, although a trend for a reduced AI was observed in PD during REM sleep (Figure 1). AI in MSA was significantly lower than PD in stages N1, N2, and REM sleep; this difference remained significant during N1 and N2 after adjusting for the presence of RBD, but did not remain after adjustment during N3 and REM sleep. Results of atonia index analysis in all sleep stages are shown in Table 5.
Univariate and Multivariate Analyses of Atonia Index in MSA, PD, and Healthy Controls
| Univariate analysis | Multivariate analysis A = PD vs. HC B = MSA vs. HC C = PD vs. MSA D = PD vs. MSA, adjusted for RBD | ||||
|---|---|---|---|---|---|
| Sleep stage | MSA (n = 12) | PD (n = 38) | HC (n = 10) | P-value | Effect size, [CI 95%], p |
| N1 | 0.26 ± 0.22 | 0.43 ± 0.24 | 0.51 ± 0.19 | .030* | A: ES = 0.19, [−0.51; 0.14], p = .25 B: ES = 1.07, [−1.63; −0.1.36], p = .003** C: ES = 0.43, [0.13; 0.78], p = <.001** D: ES = 0.39, [0.06; 0.72], p = .02 |
| N2 | 0.33 ± 0.21 | 0.61 ± 0.21 | 0.73 ± 0.15 | .0007* | A: ES = 0.29, [−0.62; 0.12], 0.077 B: ES = 1.8, [−2.44; −1.17], p < .0001** C: ES = 0.87 [0.54; 1.19], p < .0001** D: ES = 0.76, [0.44; 1.09], p = .02 |
| N3 | 0.58 ± 0.26 | 0.75 ± 0.21 | 0.89 ± 0.08 | .06 | A: ES = 0.29, [−0.61; 0.04], p = 0.08 B: ES = 1.13, [−1.76; 0.50], p = .011* C: ES = 0.87, [0.10; 0.75], p = .012* D: ES = 0.32, [−0.01; 0.65], p = .054 |
| REM | 0.44 ± 0.27 | 0.67 ± 0.28 | 0.84 ± 0.14 | .024* | A: ES = 0.31, [−0.64; 0.022], p = .065 B: ES = 1.04, [−1.85; −0.55], p = <.0001** C: ES = 0.45, [−0.48; 0.78], p = .007* D: ES = 0.28, [−0.05; 0.61], p = .09 |
Results of the univariate analysis are expressed in term of Effect Size, 95% Confidence interval (CI), and p value. Contrasts between groups were adjusted for age and duration of NREM sleep. Group Comparison: A: PD vs. Healthy Controls; B: MSA vs. HC; C represents comparison of PD group vs. MSA, and D represents the same comparison adjusted for the presence of RBD. *α<0.05; *α<0.05; **α<0.005
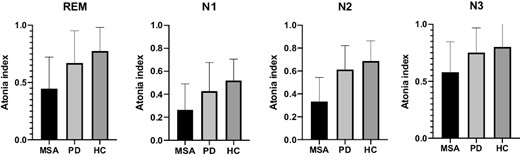
Distribution of atonia index in different sleep stages, column express mean, whiskers SD. A gradient of muscular activation was observed within the three groups, with the highest muscle activity, (corresponding to the lowest AI), observed in MSA, and the lowest activation (i.e., higher AI) in controls, in all sleep stages.
Three out of 11 MSA patients and five out of 38 PD patients showed an AHI > 15/h. Separate analysis adjusting for the presence of AHI ≥ 15/h led to similar results.
Discussion
To the best of our knowledge, this is the first study to assess facial movements during sleep and muscle tone during both REM and NREM sleep in patients with MSA and PD. Our results show the presence of increased facial activity in MSA patients compared to controls in both REM and NREM sleep. Furthermore, the peculiar expression of “strained face,” with the simultaneous contraction of both upper and lower parts of the face, appears to be a distinctive feature of MSA, being more frequent during both NREM and REM sleep in MSA compared to PD. Of interest, this facial activity was still significantly higher in MSA compared to PD, after controlling for the presence of RBD.
Oro-facial dystonia may be commonly seen in atypical parkinsonism [20] and is considered a typical feature of MSA patients [12]. A common appearance is the combination of oromandibular dystonia, and upper facial dystonia [21]. Sometimes, this peculiar expression can resemble the contraction observed in tetanus and is therefore named “MSA risus sardonicus” [22]. During sleep, dystonic movements tend to diminish in frequency and duration but do not completely disappear; however, only a few data are available for dystonic movements in PD and MSA during sleep [23]. The presence of facial movements during both NREM and REM sleep might be a nocturnal expression of dystonia, although in our study the presence of diurnal oro-facial dystonia was not assessed.
MSA patients also showed a higher frequency of “smiling” during REM sleep; however, this difference was not significant after adjusting for the presence of RBD. Smiling during sleep has been poorly investigated in normal adults. One study found an increased frequency of smiling during both REM and NREM sleep in patients with RBD compared to patients with NREM sleep parasomnia and subjects without parasomnia [3]. In our study, during both NREM and REM sleep, facial movements such as “eye closing,” “eyebrows raising” and “eyebrows frowning” were observed in both MSA and PD (with no differences between the two groups) compared to controls who almost never showed facial movements. On the other hand, a recent study assessing facial muscle activity through EMG found the presence of frowning movements and EMG activity during all sleep stages particularly in patients with RBD but also in NREM sleep parasomnia and controls [4]. In our study, these movements may be related to the presence of RBD, given its higher prevalence in both groups of patients.
The analysis of muscle tone during a whole night’s sleep showed that the physiological gradient of muscular activity which gradually decreased from the waking state throughout the deepening of the stages (from NREM1 to NREM3) until REM atonia [24] was maintained in controls, but not in MSA and PD patients, in whom muscle tone was increased during REM sleep. Although not significant, a trend for a more severe loss of muscle atonia during REM sleep was observed in MSA compared to PD patients, with a lower AI in the latter. The same was also observed in another cohort of MSA patients, where a lower AI during REM sleep was observed compared to patients with isolated RBD (iRBD), resulting from a higher sustained muscle tone besides the excessive phasic EMG activation, as a possible marker of a more severe neurodegeneration [17].
Interestingly, in our study, a decrease of AI was also observed during NREM sleep, with MSA patients presenting the lowest degree of muscle atonia throughout all the sleep stages compared to PD patients and controls, and PD patients showing intermediate values of AI during NREM, between MSA and controls. Few studies have explored muscle activity during NREM sleep in neurodegenerative conditions. Shenck et al. [25] in their description of 96 cases of RBD observed an excess of aperiodic and periodic limb movements during both NREM and REM sleep compared to controls, suggesting altered motor control in both NREM and REM sleep in RBD. One study using phasic electromyographic metrics (PEM) to assess chin and limb muscle activity in patients with PD, found an increased PEM in both REM and NREM sleep, although no difference was found between PD patients with and without RBD [26]. Muscle activity during NREM sleep was also studied by Hanif et al. [27] who found that both PD and iRBD patients have higher chin and anterior tibialis muscle activity during NREM than controls, with the highest rate found in iRBD patients in all NREM sleep stages. A very recent study confirms the presence of a pervasive and diffuse muscle activity recorded in both axial and limb muscles in MSA patient with RBD during both REM and NREM sleep compared to PD patients [28].
In our study, both facial movements and increased muscle tone were observed during NREM sleep in MSA and PD patients compared to controls. After adjusting for the presence of RBD, both the facial activity of “strained face” and muscle tone during all NREM sleep stages were still significantly higher in MSA compared to PD. These results suggest that these abnormalities may be specifically related to MSA, rather than to the concomitant RBD. Future studies should confirm this finding. However, it must be taken into account that the vast majority of patients with MSA also have RBD, therefore the inclusion of MSA patients without RBD would be extremely difficult [7].
On the other hand, in our study, all facial muscle activities during NREM sleep, particularly the that pertaining to the upper face and including “eye closing,” “eyebrows raising” and “frowning,” were very frequent in both MSA and PD (who share the comorbidity with RBD), although almost absent in controls, suggesting that this activity, observed in both MSA and PD, may be modulated by the common neurodegenerative process underlying these diseases. Indeed, RBD might play a role in the dysregulation of muscle tone not only during REM but also during NREM sleep. Mechanisms underlying the regulation of muscle activity during NREM sleep have not been studied as extensively as those of REM sleep. It has been observed that, during NREM, muscle atonia may appear five minutes before the onset of REM sleep, and can be observed during 20 minutes of the subsequent NREM sleep episode [29]. On the other hand, the presence of episodes of REM muscle atonia during NREM sleep is enhanced after selective REM sleep deprivation [30]. These observations support the hypothesis of a fluid control of NREM and REM rather than rigid separate mechanisms, as illustrated by Nelsen with the concept of covert-REM [31]. Therefore, it is conceivable that impairment in REM sleep atonia observed in alpha-synucleinopathies such as PD and MSA, might also be paralleled by muscle tone abnormalities during NREM sleep.
It should be admitted, however, that the regulation of muscle tone during sleep is quite complex and other factors, as yet unknown, may play an important role; for example, it has been reported that AI is decreased in iRBD during REM sleep, compared to controls, but it is tendentially higher than that of controls during NREM sleep. In the same study, it was shown also that this differential stage distribution of AI in iRBD is not modified by the chronic use of clonazepam, in contrast to RBD episodes that tended to be reduced. This indicates the need to carefully consider separately the muscle tone regulation during sleep from the control of complex behaviors. Interestingly, the same study also showed that AI was reduced in all sleep stages in narcoleptic patients with RBD, indicating the additional need to consider the neurochemical, neuropathological, and neurophysiological state of each condition when trying to interpret these data [32].
The presence of both facial activity and muscle activation during NREM sleep may also be seen as a manifestation of sleep state dissociation which is described in neurodegenerative disorders, including MSA and PD. Sleep state dissociation consists of the simultaneous presence of features of different states of being. For example, RBD is characterized by an intrusion of elements of wakefulness such as motor behaviors into REM sleep [8, 9]. Indeed, an evolution from RBD to overt status dissociatus, with motor activity observed during all sleep stages, has been described during the course of MSA and PD [8, 33]. Therefore, in our MSA and PD patients, the presence of a higher number of facial movements during both REM and NREM sleep may represent an early or mild manifestation of state dissociation. A longitudinal analysis of facial movements and muscle tone during NREM will provide information on the evolution of the sleep state dissociation in these neurodegenerative conditions.
There are some limitations in this study that could be addressed in future research.
First, the study was conducted retrospectively, therefore facial activity was analyzed only through the examination of videos, so subtle or brief muscle activations may have been gone unnoticed. Not all videos were recorded using a specifically dedicated camera for the observation of the face, therefore resolution of the video might be impaired by using the zoom. EMG recording of selected facial muscles such as the corrugator or zygomatic muscles, as done in previous studies [3, 4], would have led to a more objective characterization of muscle activation. Nevertheless, in our experience, particularly in this type of patient, the use of adjunctive EMG electrodes may cause discomfort which can contribute to a poor night’s sleep, thus jeopardizing the entire sleep exam.
Secondly, it would have been interesting to assess whether clinical data on diurnal dyskinesia correlate with the presence of nocturnal facial activity, to assess the hypothesis that the strained face observed during sleep might be a nocturnal expression of facial dyskinesia, rather than only a marker of sleep dissociation. Unfortunately, these data were available only for a limited number of patients, insufficient to carry out such an analysis.
Moreover, the sample size of our patient groups was small: the recruitment of patients with MSA can be difficult due to the rarity of this pathology, and we were unable to assess a number of PSG from PD patients and controls because their face was not clearly visible throughout the night.
Future multicenter studies should include larger samples of MSA patients and record/analyze the face frame in their vPSG because it may prove useful for the assessment of facial activity in patients who undergo this exam.
Conclusion
The present study showed a significant increase in facial movements during all sleep stages in patients affected by MSA. A particular expression, consisting of a simultaneous contraction of both the upper and lower parts of the face, which we refer to as “strained face,” appears to be strongly associated with this condition.
In addition, the presence of an increased chin muscle tone measured by means of the AI during all sleep stages, compared to PD and controls, may represent a marker of sleep dissociation severity in this alpha synucleinopathy.
Therefore, increased facial movements during sleep and the assessment of EMG muscle tone during REM and NREM sleep could be useful for distinguishing MSA from PD patients, especially at the beginning of the symptoms, when the diagnosis may be challenging.
Further investigations are needed to confirm these findings in a larger sample. Longitudinal studies could characterize the evolution of these particular abnormalities of motor control during sleep in alpha-synucleinopathies, particularly in MSA, and establish whether they parallel the progression of the neurodegenerative process.
Disclosure Statement
The authors have no financial arrangements or connections and no financial interests that could be relevant to the manuscript submitted. The data underlying this article will be shared on reasonable request to the corresponding author.


Comments