


Abstract
Healthy aging and many disorders show reduced sleep-dependent memory consolidation and corresponding alterations in non-rapid eye movement sleep oscillations. Yet sleep physiology remains a relatively neglected target for improving memory. We evaluated the effects of closed-loop auditory stimulation during sleep (CLASS) on slow oscillations (SOs), sleep spindles, and their coupling, all in relation to motor procedural memory consolidation.
Twenty healthy young adults had two afternoon naps: one with auditory stimulation during SO upstates and another with no stimulation. Twelve returned for a third nap with stimulation at variable times in relation to SO upstates. In all sessions, participants trained on the motor sequence task prior to napping and were tested afterward.
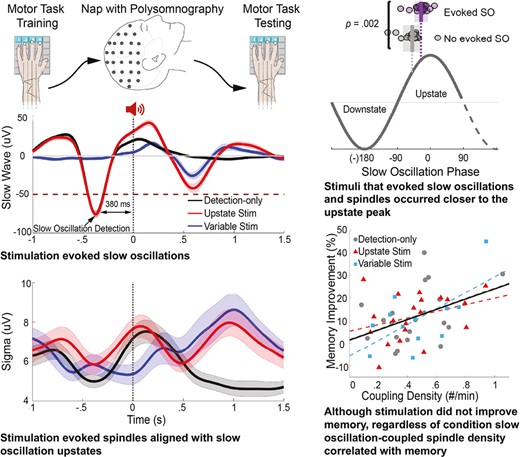
Relative to epochs with no stimulation, upstate stimuli disrupted sleep and evoked SOs, spindles, and SO-coupled spindles. Stimuli that successfully evoked oscillations were delivered closer to the peak of the SO upstate and when spindle power was lower than stimuli that failed to evoke oscillations. Across conditions, participants showed similar significant post-nap performance improvement that correlated with the density of SO-coupled spindles.
Despite its strong effects on sleep physiology, CLASS failed to enhance motor procedural memory. Our findings suggest methods to overcome this failure, including better sound calibration to preserve sleep continuity and the use of real-time predictive algorithms to more precisely target SO upstates and to avoid disrupting endogenous SO-coupled spindles and their mnemonic function. They motivate continued development of CLASS as an intervention to manipulate sleep oscillatory dynamics and improve memory.
Healthy aging and many disorders show reduced sleep-dependent memory consolidation and corresponding alterations in sleep oscillations, yet there is a dearth of effective interventions. We evaluated the efficacy of closed-loop auditory stimulation during sleep (CLASS) in evoking slow oscillations, sleep spindles, and their coupling, all in relation to motor procedural memory consolidation. CLASS evoked slow oscillation-coupled spindles, which correlated with enhanced motor procedural memory, but failed to enhance memory per se. Our findings suggest methods to overcome this failure. They motivate continued research to optimize CLASS as an intervention to manipulate sleep oscillatory dynamics to improve memory. Given the toll of memory impairment, the impact of CLASS as an effective, safe, and scalable treatment would be substantial.
Introduction
Although memory loss accompanies healthy aging and is a disabling feature of a wide range of disorders, we lack effective treatments. There is a wealth of evidence that sleep plays an evolutionarily conserved role in memory [1]. During the sleep that follows learning, memory consolidation relies on the precisely timed coupling of the three cardinal rhythms of non-rapid eye movement (NREM) sleep: cortical slow oscillations (SOs: 0.5–1.5 Hz), which include K-complexes, thalamic sleep spindles (12–15 Hz), and hippocampal sharp-wave ripples (80–140 Hz). SOs coordinate these faster rhythms (i.e. spindles and ripples) to transfer memories from temporary indexing in the hippocampus to more distributed, lasting representations in the cortex [2, 3]. The coupling of SOs with spindles breaks down in normal aging [4] and in a number of neurodevelopmental and neurodegenerative disorders characterized by impaired sleep-dependent memory consolidation (e.g. [5–7]). Yet sleep physiology has been relatively neglected as a target to improve memory in disorders. Medications are one approach but are seldom specific in their actions and may have undesirable side effects (e.g. the sleep drug eszopiclone increases spindles but impairs their coupling with SO in humans [7] and suppresses hippocampal ripples in rodents [8]). The advent of noninvasive brain stimulation as a treatment modality offers novel alternative approaches to modifying oscillatory dynamics during sleep to improve memory [9]. In the present study, we evaluated the efficacy of closed-loop auditory stimulation during sleep (CLASS) in inducing SOs, spindles, and their coupling, all in relation to sleep-dependent memory consolidation in healthy young adults.
CLASS is a safe technique that can enhance endogenous oscillations. It involves presenting brief bursts of quiet noise precisely timed to a specific brain state as measured by EEG. As in prior work, we attempted to improve memory consolidation by presenting stimuli during the SO upstate [10–13]. SOs arise from the rhythmic simultaneous hyperpolarization (inhibited downstate) and depolarization (excitable upstate) of large populations of cortical pyramidal neurons [14]. The downstate of the SO sets a time window for synaptic plasticity and information transfer during the following upstate [15]. The SO upstate drives the thalamus to generate spindles, which are propagated to the cortex where, in pyramidal neurons, they trigger intracellular mechanisms of plasticity that lead to long-term potentiation [16]. In multiple studies, compared with sham stimulation, CLASS is associated with increased SO or spindle activity and improved declarative memory consolidation in healthy participants [10–13]. In individuals with amnestic mild cognitive impairment, CLASS increased slow wave activity, which correlated with improved declarative memory, but on a group level, memory improvement was not significant [17]. In schizophrenia, CLASS increased SO activity and spindle activity that was phase-locked to the SO upstate but failed to improve declarative memory [18]. Both the memory and physiological effects of CLASS are relatively robust to methodological differences [19], but the timing of stimulation matters. Open-loop stimulation, stimulation during the SO downstate, and stimulation at spindle frequency have variable effects on sleep physiology across studies and have not been associated with improved memory consolidation [10, 20, 21]. Collectively, this literature suggests that CLASS has the potential to modulate sleep oscillations and improve sleep-dependent memory consolidation in both healthy and clinical populations.
The studies reviewed above examined the effects of CLASS on declarative memory. The few studies that examined the effects of CLASS on procedural memory are inconsistent [11, 22–24]. The two studies that used SO upstate CLASS did not improve procedural memory in adults [11] or children [24]. Both of these studies also tested at least one declarative memory across the same night, raising the possibility of interference. In the present study, we measured SO upstate CLASS effects on procedural motor memory using the finger tapping motor sequence task (MST) during an afternoon nap. The MST is the most extensively validated probe of sleep-dependent memory consolidation [25, 26]. Sleep-dependent consolidation of the MST depends on the hippocampus [27], correlates with SO-coupled spindles [7, 28], and is impaired in people with schizophrenia [7, 29, 30]. In addition to measuring amplitude in the slow wave and spindle frequency bands, we identified discrete oscillations, since it is spindle density (#/min) rather than sigma amplitude that most reliably correlates with sleep-dependent memory consolidation [31, 32], and cognition more generally [31, 33]. Since these correlations of sleep-dependent MST improvement with spindle density [34–36] and with SO-spindle coupling are most consistently seen during NREM Stage 2 sleep (N2) [7], our analyses focused on N2. Unlike declarative tasks, for which sleep generally stabilizes memory, MST performance improves after sleep compared with performance at the end of training or an equivalent period of wake [25, 37–39].
In the present study, healthy young adults had two afternoon nap sessions. During one session, participants received auditory stimulation during SO upstates (Upstate stimulation). In the other, we detected SOs and marked the time of stimulation, but no sound was delivered (Detection-only). A subset of participants returned for a third nap session during which stimulation was delivered at variable times in relation to SO detection (Variable-state stimulation). In all sessions, participants trained on the MST prior to napping and were tested afterward. We hypothesized that Upstate stimulation would increase SOs, spindles, and SO-coupled spindles, thereby increasing memory consolidation, relative to Detection-only and Variable-state stimulation. Regardless of the condition, we expected the density of SO-coupled spindles to correlate with memory consolidation more strongly than spindles alone [7].
Methods
Participants
Twenty-one healthy adults, aged 18–45, were recruited from the community through advertisements and enrolled in the study. Potential participants were screened to exclude those who reported sleep disorders, history of significant head injury, neurological or psychiatric disorders, significant hearing or vision loss, substance abuse or dependence within the past six months, chronic medical conditions that affect sleep, use of psychotropic medications, or unstable medical conditions. Data from one participant was excluded due to suspicion of sleep apnea, leaving a total of 20 participants (10 female; mean age: 29 ± 5 years). All participants had an estimated IQ greater than 85 based on the reading portion of the Wide Range Achievement Test 4 [40]. All but two participants were right-handed (one left-handed; one ambidextrous) based on the Edinburgh Handedness Inventory [41]. All participants had experience with keyboard typing and six had experience playing a musical instrument. The study was approved by the Partners Human Research Institutional Review Board and participants gave written informed consent. In addition to being paid, participants received a bonus of $.05 for each correctly typed sequence on the MST as an incentive to enhance attention and motivation.
Procedures
Overview
Participants were asked to maintain a regular sleep schedule with a minimum of six hours of sleep for three nights prior to study visits. This was confirmed by self-report and a sleep diary. Participants were asked not to drink caffeinated beverages on study days and to have lunch prior to arriving at the laboratory.
All participants had two afternoon nap sessions (Upstate stimulation and Detection-only) in a counterbalanced order and were blind to the condition. Twelve participants returned for a third nap session (Variable-state stimulation). For each session, participants arrived at the laboratory at 12:45 PM, put their phones in a safebox, and were trained on the MST (Figure 1). They were then wired for polysomnography (PSG) and given a 2-h nap opportunity starting at approximately 2 PM. Participants were allowed to sleep in the position that was most comfortable for them. They were tested on the MST approximately 4 h after training (4 h 16 min ± 19 min (M±SD)). In the interval between awakening and MST testing, participants completed assessments and/or watched Netflix.
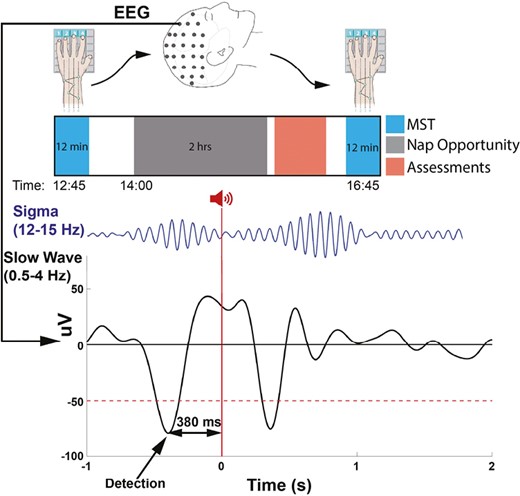
Experimental protocol and timeline. Top: Participants trained on the MST prior to a nap and were tested after waking. Bottom: During all naps, SOs were detected at the peak of the downstate. In the Upstate stimulation condition 50 ms burst of pink noise was delivered 380 ms after SO detection (0 s), targeting the upstate of the detected SO . In this schematic, the stimulus prolonged the ongoing SO and evoked a subsequent SO and a coupled spindle.
Motor Sequence Task
The MST requires participants to repeatedly type a 5-digit sequence (e.g. 4-1-3-2-4) on a keypad with their left hand, “as quickly and accurately as possible” for twelve 30-s typing trials separated by 30 s rest periods. The sequence is displayed at the top of the screen, and dots appear beneath it with each keystroke. Participants train on 12 trials before sleep and are tested on an additional 12 trials after sleep. Performance is measured as the number of correctly typed sequences per trial. The main outcome measure, over-nap improvement, is the percent increase in correctly typed sequences from the average of the last three training trials pre-nap to the first three post-nap test trials [25]. Different MST sequences were employed for each nap visit and their order was counterbalanced across conditions. There is no transfer of learning between MST sequences [38]. Prior to each MST administration, participants completed the Stanford Sleepiness Scale (SSS) to measure subjective alertness [42].
Prior to analysis, trials in which the participant did not follow instructions and outlier trials were detected and removed. To remove outliers, we modeled MST performance in each session using a piecewise power function [30]. The training and test data for each condition were fit to the equation, Y = I + C(1 − Rt−1) + Dd + e, where Y = correct sequences typed on trial t; I = initial performance (on trial 1); C = change in performance from trial 1 to the asymptote (amount learned); 1 − R = the learning rate; t = trial number; D = overnight improvement; d: 0 (for training) or d = 1 (for testing); and e is a stochastic error term. Trials whose squared deviation from the fitted model was greater than 2 standard deviations lower were excluded (55 out of 1248 trials, 4.4%). The number of excluded trials did not differ across conditions (F(2,49) =.45, p = .64). If any of the excluded trials were needed for calculating over-nap improvement (last three training, first three tests), the remaining trials were averaged.
Polysomnography acquisition
PSG data were recorded at 500 Hz with an actiCHamp amplifier (Brain Products, Germany) and EEG caps (ActiCap, Brain Products, Germany) with 92 EEG, two mastoid, two electrooculography, and two submental electromyography electrodes. Each 30 s epoch of PSG was scored visually according to standard criteria [43] as WAKE, REM, N1, N2, or N3 by experienced raters who were blind to conditions. Sleep stage data are reported as total minutes and percent of total sleep time (TST) for each nap.
Closed-loop auditory stimulation
We adapted a published algorithm [44, 45] to detect SOs and deliver sounds during N2 and N3 sleep (Figure 1) using MATLAB (The Mathworks, R2018a, Natick, MA). Participants were given a 2 h nap opportunity and were awakened after 90 min of sleep. PSG was monitored in real time by a staff member (BSB). The 90 min began and the algorithm was manually started when the participant entered stable N2/N3 sleep, defined as 3 min of continuous N2/N3. The algorithm was paused when an arousal, awakening, or a transition to REM sleep occurred. If the participant resumed N2/N3 within 60 s, the algorithm was restarted after 1 min of N2/N3, otherwise it was restarted after 3 min of N2/N3 to minimize arousals.
Real-time SO detection algorithm for time-locking stimulation
EEG data from Fz were referenced to the mean of the mastoids. The data were bandpass filtered in the slow wave band (0.5–4 Hz) to capture downward deflections of SOs that might exceed 1.5 Hz, and analyzed in 1 s sliding windows every 100 ms. Only the data from 500 to 900 ms in each window were used for threshold detection to eliminate filter edge effects while still providing complete temporal coverage. The negative (downstate) peak of a SO was detected when the EEG signal exceeded a negative threshold of −50 uV between 50 and 500 ms after a positive-to-negative zero crossing.
Stimulation
The stimulus, 50 ms of pink noise with 5 ms ramp up and ramp down [10], was delivered through in-ear headphones (Etymotic ER1; Etymotic Research, Inc., Elk Grove Village, IL) using Psychtoolbox [46]. Volume was set at each nap as 10%–20% above the participant’s hearing threshold based on comfort (range: 47–62 dB). The stimulus volume was reduced by 5% if the participant had an arousal after two consecutive stimuli. After each stimulus, the algorithm paused detection for 4 s. This duration was selected to avoid the spindle refractory period and thereby maximize the chance of evoking a SO-coupled spindle [47, 48]. In the Upstate stimulation condition, stimuli were delivered 380 ms after the negative peak of the detected SO. This timing was based on the average interval between the peak of the SO downstate and the peak of the upstate in an independent dataset of 26 healthy adults [7]. In the Variable-state condition, stimuli were delivered randomly between 1500 and 2500 ms after the peak of detected SO downstates. This condition controls for the effects of stimulation per se. The Detection-only condition was identical to the Upstate stimulation condition but the stimulus volume was set to zero. This allowed between-condition comparisons of EEG data within the same time windows.
Offline oscillation detection
Because SO-coupled spindles during N2 correlate with sleep-dependent MST improvement [7], spindle and SO parameters differ in N2 and N3 [49], and fewer than half of the naps had more than 5 min of N3, we focus on N2. Findings for N2 and N3 combined are similar and are presented in the Supplement. All analyses were performed in MATLAB and R.
Preprocessing of EEG data
Data were notch filtered at 60 Hz. EEG and mastoid data were bandpass filtered at 0.3–35 Hz and EMG from 10 to 100 Hz. Channels displaying significant artifacts were visually identified and spherically interpolated using Fieldtrip (ft channel repair) [50]. Time segments with artifacts were visually identified and removed. The data were referenced to the linked mastoids. Independent component analysis (ft_component analysis) was used to identify and remove electrocardiogram artifacts.
Slow oscillation detection
SOs were automatically detected using a published method [44]. First, the raw EEG at each electrode was filtered at 0.5–4 Hz using a two-way least-squares finite impulse response filter [44, 51]. Consecutive positive-to-negative zero crossings within 0.8–2 s (corresponding to 0.5–1.25 Hz) were then marked as candidate SOs. After excluding waveforms with peak-to-peak amplitudes >300 uV as artifacts, waveforms with amplitudes in the upper 25% at each electrode were defined as SOs [4, 7, 52].
Spindle detection
Spindles were automatically detected in the 12–15 Hz band-pass filtered data at each electrode using a wavelet-based algorithm [29]. The threshold for spindle detection, nine times the median signal amplitude of artifact-free epochs, maximized between-class (“spindle” vs. “non-spindle”) variance [53] in a previous study [7]. Spindle start and end points were defined based on the full-width half max of the smoothed Hilbert transform amplitude envelope.
SO-coupled spindle detection
We identified SO-coupled spindles when any spindle time point overlapped with a SO.
Evaluation of stimulation effects
Differences between conditions were characterized at each electrode using linear mixed-effects model regressions estimated by restricted maximum likelihood, with condition (Upstate stimulation, Detection-only, Variable-state stimulation) as a fixed effect and participant as a random effect, unless otherwise noted.
We corrected for multiple comparisons across electrodes using a nonparametric cluster-based method [54]. Clusters were formed from adjacent electrodes that met an uncorrected threshold of p < .05. The cluster statistic (tsum) was the sum of the test statistics of the electrodes within the cluster. Permutation distributions were created by randomly shuffling conditions 2000 times at each electrode and retaining the cluster with the maximum statistic for each permutation. The cluster-level corrected p-value is the probability that the observed cluster would be found by chance under the permutation distribution.
Stimulation effects on slow wave and sigma amplitude
The values of slow wave and sigma amplitude at each timepoint from −1 to 1.5 s around each stimulus were averaged and compared across conditions. Slow wave amplitude was measured as the filtered signal from 0.5 to 4 Hz. Sigma amplitude was measured as the Hilbert transform amplitude in the sigma band (12–15 Hz).
Stimulation effects on discrete oscillations
To evaluate whether stimulation evoked discrete oscillations, we classified each detected SO, spindle, and SO-coupled spindle as evoked if it occurred within 1.5 s after stimulus onset and endogenous if not. We compared the probability of evoking an oscillation in both stimulation conditions with the probability of an oscillation occurring during the same 1.5 s time period in the Detection-only condition. SOs were classified based on the time of the negative peak. Spindles that began after the stimulus were classified based on the time of their peak amplitude. SO-coupled spindles were classified based on SO timing. The probability of each oscillation/event was calculated by dividing the number of evoked oscillations by the number of stimuli delivered per condition.
Effects of endogenous EEG activity at the time of stimulation
We compared the EEG activity of stimuli that did and did not evoke oscillations in both stimulation conditions. Specifically, we compared the SO amplitude and the amplitude of the envelope in the sigma band using paired t-tests, and the phase of the SO using paired circular tests (Hotelling paired-sample test (circ_htest)) (https://www.mathworks.com/matlabcentral/fileexchange/46349-circ_htest) at the start of stimulation.
Individual predictors of responsiveness to Upstate stimulation
To examine whether individual differences in sleep physiology predict responsiveness to CLASS, we regressed the density of SOs and spindles during the Detection-only nap with the probability of evoking oscillations during the Upstate stimulation nap.
Effects of stimulation condition on sleep-dependent memory consolidation
We compared over-nap MST improvement across conditions. We also examined the relations of over-nap improvement with SO, spindle, and SO-coupled spindle densities (#/min) across N2 using linear mixed-effects models with MST improvement as the dependent variable, oscillation density as the fixed effect, and participant as the random effect. To evaluate whether the density of SO-coupled spindles was a better predictor of memory consolidation than the density of either oscillation alone, as we have seen in previous studies [7], we compared these models based on their goodness of fit across all electrodes using the Bayesian Information Criterion using paired t-tests [55].
Results
Sleep quality and architecture
On average, participants slept more than an hour in each condition (Table 1). Compared with Detection-only, sessions with stimulation were characterized by TST and worse sleep quality as indexed by lower sleep efficiency, greater sleep fragmentation, and increased wake time after sleep onset (WASO). These differences reached significance for Upstate stimulation and, except for WASO, which was significant, were at a trend level for Variable-state stimulation. The conditions did not differ in N2 or REM percent or duration, but compared with Detection-only, the Upstate stimulation condition was characterized by a significantly greater percentage of time spent in N1 and both a lower percentage and less time in N3. There were no significant differences between Upstate and Variable-state stimulation in sleep architecture or quality.
Sleep quality, architecture, and stimulation characteristics across sessions
| Detection-only (DO) (n = 20) | Upstate Stim (UP) (n = 20) | Variable state Stim (VS) (n = 12) | Main effect | Main effect | UP vs. DO | VS vs. DO | UP vs. VS | |
|---|---|---|---|---|---|---|---|---|
| F | P | P | P | P | ||||
| TST (min) | 77 ± 22 | 64 ± 27 | 71 ± 22 | 3.61 | .03* | .01* | .09 | .69 |
| Sleep efficiency | .8 ±.2 | .6 ±.3 | .7 ±.2 | 4.99 | .01* | .003* | .07 | .49 |
| SOL (min) | 8 ± 8 | 10 ± 9 | 6 ± 4 | 2.52 | .09 | .11 | .46 | .04 |
| SFI | .1 ±.1 | .2 ±.1 | .1 ±.1 | 3.45 | .04* | .01* | .15 | .50 |
| WASO (min) | 18 ± 19 | 31 ± 24 | 24 ± 24 | 4.64 | .01* | .007* | .03* | .90 |
| Sleep architecture (%) | ||||||||
| N1 | 15 ± 11 | 23 ± 15 | 14 ± 11 | 5.34 | .008* | .002* | .25 | .13 |
| N2 | 61 ± 17 | 66 ± 13 | 66 ± 15 | .76 | .47 | .29 | .32 | .93 |
| N3 | 19 ± 20 | 7 ± 11 | 14 ± 15 | 4.75 | .01* | .004* | .10 | .40 |
| REM | 5 ± 7 | 5 ± 8 | 6 ± 10 | .07 | .94 | .88 | .82 | .72 |
| Sleep architecture (min) | ||||||||
| N1 | 11 ± 8 | 12 ± 8 | 9 ± 6 | .79 | .46 | .37 | .68 | .25 |
| N2 | 46 ± 18 | 41 ± 18 | 46 ± 14 | .53 | .59 | .31 | .73 | .61 |
| N3 | 16 ± 17 | 6 ± 11 | 11 ± 13 | 3.62 | .03* | .01* | .12 | .52 |
| REM (min) | 5 ± 6 | 4 ± 7 | 5 ± 9 | .15 | .87 | .74 | .80 | .60 |
| Stimulation characteristics | ||||||||
| N2 Stim count | 45 ± 31 | 36 ± 31 | 34 ± 28 | 2.97 | .06 | .11 | .02 | .32 |
| N2 Stim rate (#/min) | 1.0 ±.6 | .8 ±.5 | .7 ±.5 | 5.87 | .005* | .04* | .002* | .13 |
| N2 + N3 Stim count | 146 ± 140 | 75 ± 111 | 72 ± 56 | 6.64 | .003* | .01* | .002* | .29 |
| N2 + N3 Stim rate (#/min) | 4.1 ± 5.4 | 1.8 ± 3.2 | 1.7 ± 1.6 | 3.94 | .03* | .03* | .02* | .54 |
All variables mean ± SD. SOL: sleep onset latency; SFI: sleep fragmentation index; *significant at p < .05.
Validation of CLASS algorithm
We measured oscillatory activity (slow wave and sigma envelope amplitude) at the start of each stimulus, averaged these across participant, and compared across conditions. As expected, at the time of stimulation, the Upstate stimulation and Detection-only conditions did not differ and each had a higher slow wave and sigma amplitudes than the Variable-state stimulation condition due to the ongoing SO and presumably SO-coupled spindles (Fig. 2).
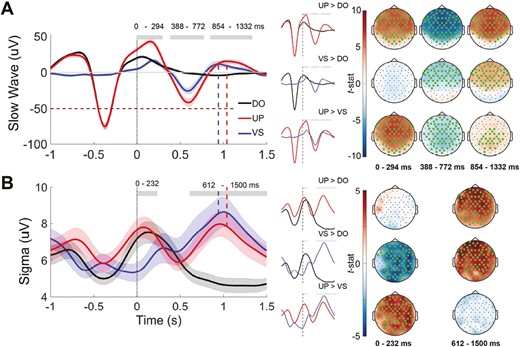
Mean slow wave and sigma amplitude after stimulation. (A) Left: the signal trace at Fz filtered in the slow wave 0.5–4Hz band. Stimulus onset time is indicated by vertical dotted line at time = 0. Grey horizontal bars indicate the main effect of session on amplitude (p < .05). Shading indicates SEM. Dashed lines indicate the corresponding peak of the SO upstate after stimulation, which corresponds to an increase in sigma activity. Right: pairwise differences in slow-wave amplitude across all electrodes averaged over the time windows with a significant main effect of session. Electrodes with a cluster-corrected p < .05 are highlighted.(B) Left: the amplitude of the sigma (12–15 Hz) band envelope at Fz around each stimulus. Right: pairwise differences in sigma amplitude across all electrodes averaged over the time windows with a significant main effect of session at Fz (right). DO = Detection only; UP = Upstate stimulation; VS = Variable-state stimulation.
Stimulation effects on slow wave amplitude
Relative to Detection-only and Variable-state stimulation, Upstate stimulation resulted in widespread significant increases in slow wave amplitude (Figure 2, A, Table 2). It augmented the upstate of the triggering endogenous SO starting immediately after stimulation (0–294 ms), then evoked a powerful downstate (388–772 ms), followed by another upstate (854–1332 ms). Relative to Detection-only, Variable-state stimulation had no effect on slow wave amplitude immediately after the stimulus. Starting at 388 ms, however, Variable-state stimulation significantly increased slow wave amplitude, evoking a downstate (388–772 ms) followed by an upstate (854–1332 ms).
Stimulation effects on slow wave and sigma amplitude
| uV | DO | UP | VS | Main effect | Main effect | UP vs. DO | VS vs. DO | UP vs. VS |
|---|---|---|---|---|---|---|---|---|
| F(2,49) | P | P | P | P | ||||
| SW amplitude (0–294 ms) | 9.1 ± 4.6 | 19.6 ± 7.9 | 6.3 ± 3.2 | 29.49 | <.001* | <.001* | .16 | <.001* |
| SW amplitude (388–772 ms) | 0.0 ± 1.8 | −15.0 ± 8.2 | −7.2 ± 5.7 | 34.94 | <.001* | <.001* | .001* | <.001* |
| SW amplitude (854–1332 ms) | −1.7 ± 1.8 | 6.5 ± 5.3 | 3.6 ± 4.3 | 22.59 | <.001* | <.001* | <.001* | .05* |
| Sigma amplitude (0–232 ms) | 5.0 ± 1.3 | 5.0 ± 1.4 | 3.8 ± 1.3 | 12.00 | <.001* | .890 | <.001* | <.001* |
| Sigma amplitude (612–1500 ms) | 3.3 ±.9 | 4.3 ± 1.5 | 4.8 ± 1.2 | 14.76 | <.001* | <.001* | <.001* | .30 |
All variables mean ± SD of the electrodes included in the significant cluster. *Significant at p < .05.
Stimulation effects on sigma amplitude
At the time of stimulation, the Upstate and Detection-only conditions had significantly higher sigma activity than the Variable-state condition (Figure 2b, Table 2). This likely reflects endogenous SO-spindle coupling. Relative to Detection-only, both stimulation conditions significantly increased sigma activity from 612 to 1500 ms after stimulation. Sigma amplitude peaked in the upstate of the evoked SO.
Stimulation effects on discrete oscillations
Considering all of N2, oscillation density did not differ significantly between conditions, but the probability of an oscillation occurring in the 1.5 s after stimulation did (Table 3, Figure 3). Upstate stimuli were significantly more likely to be followed by another SO than Variable-state stimuli or during the corresponding time periods in the Detection-only nap. Compared with Detection-only, both stimulation conditions increased the probability of subsequent spindles and SO-coupled spindles.
Comparisons of oscillation density and the probability of an oscillation occurring after stimulation across conditions at Fz during N2 sleep
| DO | UP | VS | Main effect | Main effect | UP vs. DO | VS vs. DO | UP vs. VS | |
|---|---|---|---|---|---|---|---|---|
| F(2,49) | P | P | P | P | ||||
| Oscillation density | ||||||||
| SO | 4.5 ± 0.68 | 4.4 ± 0.58 | 4.2 ± 0.68 | 2.57 | .09 | .54 | .03 | .09 |
| Spindle | 3.8 ± 1.7 | 3.7 ± 1.8 | 2.8 ± 1.6 | 0.85 | .43 | .64 | .20 | .36 |
| Coupled | 0.58 ± 0.25 | 0.59 ± 0.29 | 0.61 ± 0.26 | 0.03 | .97 | .81 | .91 | .93 |
| Probability of oscillations after stimulation | ||||||||
| SO | 0.37 ± 0.13 | 0.65 ± 0.20 | 0.46 ± 0.21 | 13.07 | <.001* | <.001* | .16 | .005* |
| Spindle | 0.07 ± 0.05 | 0.13 ± 0.09 | 0.17 ± 0.09 | 8.28 | <.001* | .01* | <.001* | .10 |
| Coupled | 0.03 ± 0.03 | 0.08 ± 0.07 | 0.09 ± 0.05 | 7.61 | .001* | .005* | .007* | .76 |
All variables mean ± SD of the electrodes included in the significant cluster. *Significant at p < .05.
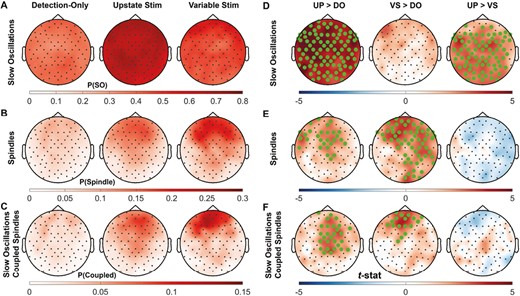
Comparisons of the probability of an oscillation 1.5 s after stimulation across conditions. Topographical map of the probability of (A) SOs, (B) spindles, and (C) SO-coupled spindles in the 1.5 s after each stimulus over each session and of the pairwise comparison t-stat between sessions (D, E, F). Electrodes with a cluster-corrected p < .05 are highlighted.
Effects of endogenous EEG activity at the time of stimulation
Upstate stimuli that evoked SOs were delivered at higher SO amplitudes (tsum(59 electrodes) = 183, p < .001) and closer to the peak of the rising phase of the upstate (Figure 4; left cluster: tsum(9 electrodes) = 48, p = .04; right cluster: tsum(17 electrodes) = 100, p = .02) than stimuli that did not evoke SOs. Stimuli that evoked spindles were also delivered closer to the SO peak (left cluster: tsum(9 electrodes) = 52, p = .03; right cluster: tsum(18 electrodes) = 131, p = .002), but when sigma amplitude was lower (tsum(12 electrodes) = 34, p = .028). These differences did not reach significance for Variable-state stimuli. There were too few coupled events to examine amplitude and phase differences between evoking and non-evoking stimuli.
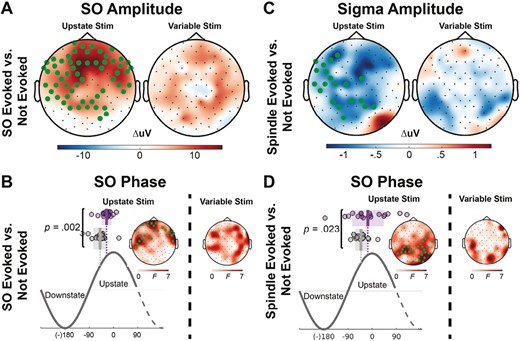
Amplitude and phase differences between stimuli that did and did not evoke an oscillation. (A) Topographical maps of the difference in SO amplitude at the time of stimulus delivery for the Upstate and Variable-state stimulation conditions for stimuli that evoked and failed to evoke another SO. Electrodes with a cluster-corrected p < .05 are highlighted. In the Upstate condition, stimuli delivered at higher SO amplitudes were more likely to evoke another SO. (B) More specifically, stimuli that evoked a SO (purple circles; shading is SEM; vertical lines show the mean phase) were delivered closer to the SO peak during the rising phase of the SO upstate. (C) In contrast, in the Upstate condition, stimuli that evoked a spindle were delivered at a lower sigma amplitude and (D) closer to the SO peak during the rising phase of the SO upstate.
Individual predictors of responsiveness to upstate stimulation
In individuals with higher SO density during the Detection-only nap, CLASS was more likely to evoke a SO (tsum(40 electrodes) = 108, p = .01) but less likely to evoke a spindle (Figure 5; tsum(36 electrodes) = −92, p = .008). Spindle density during the Detection-only nap did not predict responsiveness to stimulation.
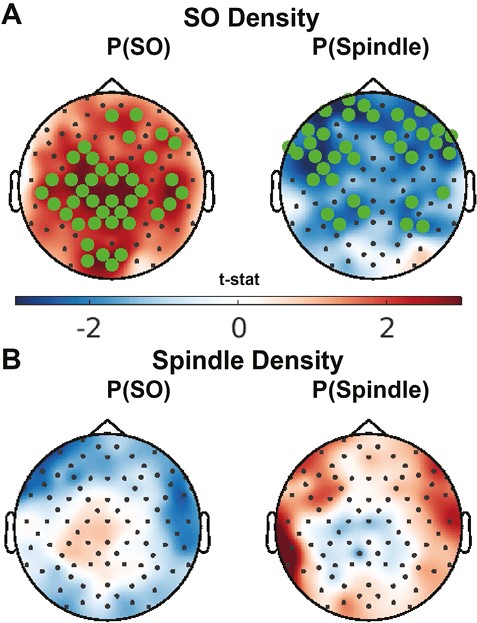
Effect of oscillation activity during the Detection-only nap on responsiveness to stimulation. Topographical maps of the correlation between (A) SO and (B) spindle density during the Detection-only session and the probability of evoking SOs (left) or spindles (right) with Upstate stimulation. Electrodes with a cluster-corrected p < .05 are highlighted .
Stimulation effects on sleep-dependent memory consolidation
On average, participants showed significant over-nap improvement of MST performance of 12 ± 12% (F(1,49) = 29.9, p < .001; Figure 6), which is on the low side, but overlaps with the range of performance seen in previous overnight studies [7, 25, 29]. MST improvement did not differ between conditions (F[2,49] = 0.05, p = .95). While the number of stimuli per condition did not correlate with MST improvement (F[1, 30] = 1.32, p = .26), higher stimulation rates predicted greater MST improvement (F[1, 30] = 4.18, p = .05). While we cannot exclude the possibility that endogenously higher density of SOs contributes to this relationship, we note that SO density did not correlate with memory in the Detection-only nap (F(1,18) = 1.88, p = .18).
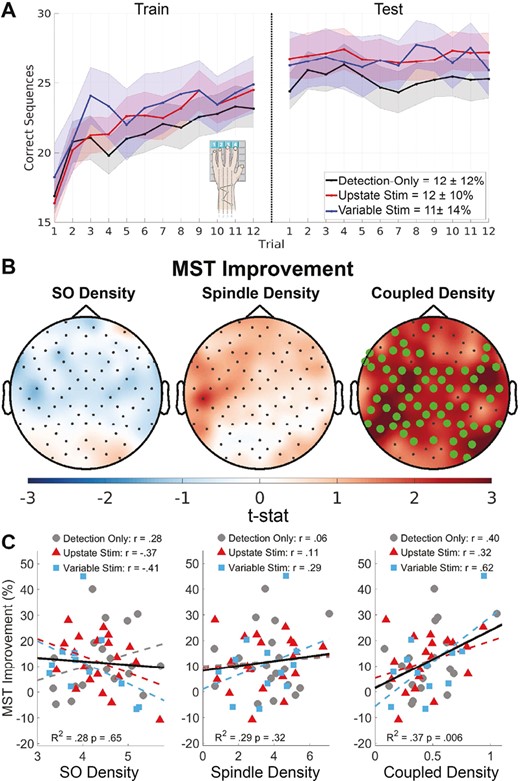
Relations of oscillation density with over-nap MST improvement. (A) Plot of correct sequences per trial averaged across participants for each condition (mean ±SE). Inset percentages show over-nap improvement (mean ± SD). (B) Topographical maps of the relation of SO, spindle, and SO-coupled spindle density (#/min) with over-nap MST improvement. Electrodes with a cluster-corrected p < .05 are highlighted. (C) SO, spindle, and SO-coupled spindle density for each participant in each condition averaged across electrodes in the significant cluster for coupled density (B) plotted against MST improvement with regression lines per condition (dashed lines) and across conditions (solid line). The r-values are based on linear regressions of oscillation density with MST improvement for each condition separately.
Relations of oscillations with sleep-dependent memory consolidation
SO-coupled spindle density across all of N2 significantly correlated with MST improvement, and this did not differ by condition (tsum(63 electrodes) = 159, p = .005, R2 = .36; Figure 6). This relationship was significantly stronger than either spindle (t(90) = 39.8, p < .001) or SO density alone (t(90) = 27, p < .001), neither of which significantly correlated with MST improvement.
Discussion
In the present study, auditory stimulation during the SO upstate evoked discrete oscillations—SOs, spindles, and SO-coupled spindles—compared with a no-stimulation control condition (Detection-only). Across conditions, the density of SO-coupled spindles during the nap that followed training on a motor procedural memory task predicted the amount of sleep-dependent improvement, as in prior studies [7, 56]. This prediction was significantly stronger than for either spindle or SO density alone, neither of which significantly correlated with performance improvement, suggesting that SO-coupled spindles are a better biomarker of sleep-dependent memory consolidation. Although auditory stimulation that did not specifically target the SO upstate (Variable-state stimulation) also increased the likelihood of evoking SO-coupled spindles and did not differ from Upstate stimulation in this regard, the timing of stimulation mattered. Upstate stimuli that evoked SOs and spindles preferentially occurred close to the peak of the rising phase of the SO upstate and when sigma power was lower. Despite its striking effects on sleep physiology, CLASS did not improve memory.
While CLASS effects on sleep physiology are immediate and strong, its effects on memory, tested after awakening, are further downstream and consequently are likely to be subject to other influences, weaker and more variable. Nonetheless, the lack of CLASS-dependent MST improvement contrasts with studies showing that CLASS can stabilize declarative memory in healthy participants [10–13] (but see [57]). There are only a few studies of CLASS effects on procedural memory. Two studies presented auditory stimulation after spindle detection and only one found MST improvement [22, 23]. Two studies of upstate CLASS found that it improved word-pair memory [11, 24], but not memory for other declarative tasks or procedural memory as measured by the MST [11] or the serial reaction time task [24]. These findings raise the possibility that different types of memory are differentially sensitive to CLASS and that the outcome may depend on what feature of sleep physiology is targeted. Clearly more and better powered studies of CLASS effects are needed.
Several methodological factors may have also contributed to the lack of enhanced MST improvement in response to CLASS in the present study. Afternoon naps have substantially fewer stimulation opportunities and fewer SO-coupled spindles than a night of sleep. More prolonged exposure to CLASS over a night or several nights may yield stronger and more consistent effects on memory consolidation. Afternoon naps also differ in composition from overnight sleep. They generally consist mainly of N2 rather than deeper N3 sleep, which is characterized by an increased density of the large amplitude slow waves that trigger stimulation. The Upstate condition in particular had very little N3 sleep. Moreover, in the present study, CLASS disrupted sleep, which may have counteracted any positive effect on memory [58]. This differs from previous overnight studies in which auditory stimulation did not disrupt sleep (e.g. [10, 13]). This difference may be due to the lower arousal threshold for N2 vs. N3 sleep.
Consistent with prior reports [10], our results show that endogenous brain activity at the time of stimulation matters for evoking oscillations. Upstate and Variable-state stimulation both evoked spindles and coupled events, but compared with Variable-state stimulation, Upstate stimulation increased amplitude in the slow wave band and evoked more SOs in the 1.5 s after stimulation. These differences may have functional significance. SOs reflect the synchronous spiking of cortical neurons that group spindles in their excitable upstates [59], which may be why higher amplitude SOs are associated with more consistent timing of SO-spindle coupling [7]. This suggests that by strengthening SOs, Upstate stimulation may enhance the thalamocortical dialogue necessary for the precisely timed SO-spindle coupling that mediates memory consolidation. With regard to the timing of Upstate stimulation, stimuli were more likely to evoke SOs and spindles if they occurred at higher amplitudes and during the rising phase of the SO upstate. This reinforces prior work showing that stimulation closer to the peak of the SO upstate is more likely to evoke another SO [13, 60].
In contrast with slow wave amplitude, stimuli delivered when sigma amplitude was higher were less likely to evoke spindles. This may be because neuronal responses to stimuli are dampened during spindles [61, 62]. Higher sigma amplitude during stimulation may be followed by a spindle refractory period, during which the threshold for the generation of an additional spindle is higher [63, 64]. The spindle refractory period lasts approximately 4 s in healthy young adults [48], and has been hypothesized to be a period of memory processing [65]. This is consistent with evidence that stimulating during a spindle or its refractory period impairs memory [48]. Since sigma activity was peaking at the time of Upstate stimulation (Figure 2), stimulation may have disrupted endogenous SO-coupled spindles and their mnemonic function [48]. A protocol that stimulates during SO upstates only when sigma power is relatively low might enhance sleep-dependent memory consolidation.
Given the importance of timing, a limitation of the present study is that Upstate stimulation was delivered at the same fixed interval after SO detection for all participants. Phase prediction algorithms [66, 67] that model SOs in real time allow optimal targeting of the SO peak not only on an individual basis but also for individual SOs, which differ in timing in N2 and N3 sleep and across the night. This precise timing may be especially important for older individuals who show a reduced temporal window of opportunity for CLASS to be effective [60]. Individual differences in sleep physiology were also associated with responsiveness to stimulation. In individuals with higher SO density during the Detection-only nap, CLASS was more likely to evoke a SO, but less likely to evoke a spindle. These findings inform our efforts to develop CLASS as a personalized intervention to improve sleep-dependent memory consolidation.
CLASS is a noninvasive and safe intervention to manipulate sleep physiology that can be implemented at home using commercially available wearable EEG devices. CLASS has potential as a therapy in healthy aging [4, 68], schizophrenia, and other neurodevelopmental [69, 70] and neurodegenerative disorders [71, 72] characterized by reduced sleep-dependent memory consolidation. It has already shown some efficacy in improving memory in healthy aging [13, 73] and in increasing coupled SO-spindle activity, which has an established relationship with memory, in people with amnestic mild cognitive impairment [17] and schizophrenia [18]. CLASS has several advantages over pharmacotherapy and noninvasive electrical neurostimulation for modulating sleep physiology (see [19] for a review). CLASS is benign, evokes endogenous oscillations, allows recording during stimulation, and is associated with improvements in declarative memory. This motivates studies to optimize the parameters of auditory stimulation during sleep based on individual, age, and clinical disorder. Such studies also offer opportunities to improve our understanding of the physiology underlying sleep-dependent memory consolidation in humans.
Directions for future work to optimize CLASS include increasing the “dose” of stimulation by testing CLASS over multiple nights; optimizing the timing of stimulation using real-time predictive algorithms to target the SO upstate and to avoid disrupting ongoing memory processing, for example by limiting stimulation to upstates with low sigma power; calibrating the level of sound to prevent arousals; identifying individual predictors of responsiveness to CLASS; and conducting basic mechanistic studies in humans and animals.
In summary, during an afternoon nap, CLASS evoked SO-coupled spindles, and regardless of condition, the density of SO-coupled spindles correlated with improved motor procedural memory consolidation. Sleep-dependent consolidation of procedural memory represents a type of task automation that renders performance faster, less variable, and less dependent on limited capacity attentional resources [30, 74, 75]. Since most tasks have procedural components, improving sleep-dependent automation could improve function. Given the toll of memory impairment in aging and disorders and the dearth of effective treatments, the impact of CLASS as a scalable and effective treatment for memory loss that prolongs the health span and improves functional outcomes would be substantial. This motivates continued research to optimize CLASS as an intervention to manipulate and understand the sleep oscillatory dynamics underlying memory.
Funding
McKnight Brain Research Foundation/American Academy of Neurology/American Brain Foundation, McKnight Clinical Translational Research Scholarship in Cognitive Aging and Age-Related Memory Loss (BSB); MGH Executive Committee on Research Fellowship Award (BSB); Simons Foundation Autism Research Initiative Human Cognitive and Behavioral Science Grant (875476) (DSM); National Insitute of Mental Health UG3MH125273, R01MH242740 (DSM).
Data Availability
The data underlying this article will be shared on reasonable request to the corresponding author.


Comments