


Abstract
Kleine–Levin syndrome (KLS) is characterized by relapsing–remitting episodes of hypersomnia, cognitive impairment, and behavioral disturbances. We quantified cerebrospinal fluid (CSF) and serum proteins in KLS cases and controls.
SomaScan was used to profile 1133 CSF proteins in 30 KLS cases and 134 controls, while 1109 serum proteins were profiled in serum from 26 cases and 65 controls. CSF and serum proteins were both measured in seven cases. Univariate and multivariate analyses were used to find differentially expressed proteins (DEPs). Pathway and tissue enrichment analyses (TEAs) were performed on DEPs.
Univariate analyses found 28 and 141 proteins differentially expressed in CSF and serum, respectively (false discovery rate <0.1%). Upregulated CSF proteins included IL-34, IL-27, TGF-b, IGF-1, and osteonectin, while DKK4 and vWF were downregulated. Pathway analyses revealed microglial alterations and disrupted blood–brain barrier permeability. Serum profiles show upregulation of Src-family kinases (SFKs), proteins implicated in cellular growth, motility, and activation. TEA analysis of up- and downregulated proteins revealed changes in brain proteins (p < 6 × 10⁻⁵), notably from the pons, medulla, and midbrain. A multivariate machine-learning classifier performed robustly, achieving a receiver operating curve area under the curve of 0.90 (95% confidence interval [CI] = 0.78–1.0, p = 0.0006) in CSF and 1.0 (95% CI = 1.0–1.0, p = 0.0002) in serum in validation cohorts, with some commonality across tissues, as the model trained on serum sample also discriminated CSF samples of controls versus KLS cases.
Our study identifies proteomic KLS biomarkers with diagnostic potential and provides insight into biological mechanisms that will guide future research in KLS.
Kleine–Levin syndrome (KLS) is a rare sleep disorder characterized by relapsing/remitting episodes of hypersomnia accompanied by derealization and cognitive impairments. The pathophysiology is unknown and biomarker studies are limited. We used a high-throughput proteomic approach to profile cerebrospinal fluid (CSF) and serum proteins in KLS cases and controls. We observed 28 and 141 proteins as differentially expressed in CSF and serum, respectively, and predominantly CSF proteins in the microglial axis to be dysregulated. A machine-learning classifier built on the CSF and serum proteins accurately classified KLS cases. Our study identifies dysregulated proteomic signatures in KLS with diagnostic potential.
Introduction
Kleine–Levin syndrome (KLS) was first identified as a unique disease entity almost a century ago [1, 2]. It is characterized by unpredictable episodes (median length ~10 days) of intense hypersomnia (≥16 h of sleep per day), occasionally associated with megaphagia and disinhibited behaviors, affecting preferentially male (66%) teenagers. More recent descriptions of large case series have shown a stereotypic appearance of abrupt episodes with severe hypersomnia and cognitive disturbances (confusion, apathy, derealization, and occasionally disinhibited behavior). Remarkably, there is complete reversibility of symptoms between episodes, partial amnesia of episodes, and a generally favorable evolution with spontaneous disappearance of episodes after one to two decades [3–6]. Lithium has been shown to lessen episodes in many cases, although association with depression, whether in the proband or family members, is rare [4, 7]. Episodes may be associated with flu-like symptoms at the onset, with seasonal winter occurrence suggested by some investigators [8].
Several hypotheses have been proposed to explain KLS. One hypothesis, based on the observation that KLS onset or the beginning of subsequent episodes is often associated with flu-like symptoms, has been an infectious or autoimmune etiology. An HLA-DQ2 association [9] in a small case series was reported but not substantiated in larger cohorts [3]. In 2008, the study of 108 new patients with matched controls revealed no association with depression or a family history of depression, but a strong association with a history of birth difficulties, as defined in prior publications that have looked at increased birth difficulties in schizophrenia [10, 11]. Most recently, we completed a large Genome Wide Association Study (GWAS) of 844 KLS cases collected over a 20-year period that revealed a GWAS significant signal in the TRANK-1 region (odds ratio [OR] = 1.4) [12] identical to one reported in bipolar disorder (where it is the highest association, with OR = 1.09) [13] or in schizophrenia (OR = 1.06) [14]. Interestingly, the TRANK-1 association in KLS was stronger in cases reporting a history of birth difficulties and was year of birth dependent, suggesting a possible interaction between birth difficulties and this genetic locus [12]. Another nonexclusive hypothesis may involve placental effects of TRANK-1 that could cause both birth difficulties and the phenotype, as suggested for schizophrenia [15].
Studies have confirmed that KLS subjects undergo changes in brain activity during episodes. For instance, EEG studies have revealed occasional nonspecific EEG slowing during episodes [4]. Functional imaging SPECT studies in KLS cases have shown a persistent hypoperfusion within thalamus, hypothalamus and associative cortical areas [16]. More recently, functional imaging studies in 138 KLS cases revealed a generalized hypometabolism in the hippocampus and the posterior associative cortex [17]. Sleep studies in KLS cases indicate a decreased sleep efficiency with frequent arousals and abnormal sleep stages [18], and multiple sleep latency test studies, while inconclusive, indicate a narcolepsy-like pattern in some patients [6, 19].
Although episodes are dramatic in appearance and patients incapacitated, biomarker studies have been limited in scope due to small sample size and differing techniques. Cerebrospinal fluid (CSF) hypocretin-1 levels in KLS have consistently been observed to be decreased during episodes [20, 21] but is unlikely to be a specific biomarker. Indeed, hypocretin/orexin is known to reversibly decrease in the CSF of patients with impaired consciousness or central nervous system (CNS) inflammation [22]. Serum cytokine levels are largely unremarkable when comparing in versus between KLS episodes, although a nominal increase in serum VCAM1 levels has been reported compared to controls [23]. Thus, efforts in KLS biomarker domain have been at best limited.
Interrogation of serum or CSF proteome in KLS with advanced state-of-the-art high-throughput methods based either on improved mass spectrometry technology, DNA-bar coded antibody assays, or aptamer-based technology could lead to advances in the understanding of the biology driving disease processes in KLS. These technologies are powerful, as the large number of analytes measured allows multivariate analyses that better correlate with complex biological processes in comparison to single marker measurements. Examples include better measurements of glomerular filtration [24], ischemic heart disease [25], sleep apnea [26], paraneoplastic syndromes [27], or disease processes such as Alzheimer’s disease [28]. In addition, cis genetic correlations of protein levels paralleling known expression Quantitative Trait Loci (eQTLs) are often observed, indirectly validating these protein measurements [29–31].
In this study, we used the SomaScan proteomic assay in CSF and serum samples to discover novel molecular metrics to advance our understanding of KLS and its underlying biological mechanism. Our first goal was to look for serum and CSF proteins that could distinguish this disease and to explore if these could map to specific pathways or brain regions. This was done in two datasets: CSF samples for 30 KLS cases and 134 controls, and serum samples for 26 cases and 65 controls. Additionally, to validate our findings, the two datasets were used to develop a machine-learning classifier able to discriminate KLS from either a CSF or serum sample. Both approaches were validated with independent held-out sets of CSF and serum samples.
Methods
SomaScan assays
Relative expression levels of CSF and serum proteins were assayed using SomaScan (SomaLogic Inc., Boulder, CO), a highly multiplexed aptamer approach detailed elsewhere [32–35]. A detailed description of the SomaScan technique and quality control procedures can be found in Supplementary Information. Briefly, the CSF SomaScan matrix used in this study consisted of an older panel format that assayed 615 proteins [36] and a newer panel of 1133 proteins, respectively, while the serum SomaScan matrix assayed 1109 proteins and 1315 proteins (see Supplementary Tables S1–S4 for a complete list of proteins included in each assay). SomaScan assays were designed to have extended dynamic range from fM to mM, and measure both extracellular and intracellular proteins (including soluble domains of membrane proteins) although predominantly proteins of the secretome are being targeted. Serum (150 µl of each sample) was used for each assay.
Study cohorts
All patients with KLS were diagnosed based on the International Classification of Sleep Disorders 3rd Edition (ICSD-3) diagnostic criteria [37] and demographic variables for the collected datasets are reported in Supplementary Table S5. Of the patients with KLS, 18 of 30 CSF samples and 11 of 26 serum samples were in-episode (i.e. in an episode of hypersomnia at the time of collection) and 1 CSF sample and 5 serum samples were out-episode (i.e. at least 30 days postepisode), respectively.
The split into training versus validation cohorts was determined based on the different dilutions and array matrices run by Somalogic for quantifying protein expression. For CSF samples, the training dataset assayed on the larger CSF SomaScan matrix containing 1133 proteins and validation was performed on the smaller matrix of 615 proteins. In serum samples, an older matrix of 1109 proteins was used as the training cohort and a newer matrix containing 1315 proteins was used for validation. From there, we selected control samples that had been run using the same matrix within each sample sent to Somalogic. The final cohort included CSF samples for 30 KLS cases (23 for training [14 in-episode] and 7 [4 in-episode] for validation) and 134 controls (80 for training and 54 for validation). Similarly for the serum samples, the sample included a total of 26 cases (20 training [10 in-episode] and 6 [1 in-episode] validation) and 65 controls (54 training and 11 validation). In seven KLS cases, both serum and CSF samples were available and were used in the serum training cohort and in the CSF validation cohort.
Case–control matching
Because of differences in CSF and serum demographics distribution between KLS and controls, matching for age, gender, and BMI was performed using MatchIt R package (v. 4.1.0) [38] and results analyzed both in matched and unmatched (entire cohort) samples. Matching and demographics of samples used are presented in Supplementary Tables S5 and S6 and Figures S1 and S2. Although samples were stored frozen at −80°C until assay, we also performed an additional analysis to study the influence of the time to assay from the date of sample collection on the expression of each protein. For all univariate analysis results, we conducted a separate analysis estimating the Pearson correlation coefficient between the time since sample collection and individual protein expression across the set of samples for both CSF and serum, and we report these values in a separate column for each protein as additional information for considering the age of samples as having a potential confounding effect.
Univariate analysis
Raw expression values were log-2-transformed to ensure normal distribution. Principal component analysis (PCA) was used within each matrix to check for technical artifacts with dimensionality reduction. We plotted the two principal components of the analysis and visualized qualitative separability. Nonparametric Mann–Whitney sum-rank tests were used for unpaired comparisons of protein levels in KLS subjects versus controls in the training datasets. Correction for multiple testing was performed using the Benjamini–Hochberg procedure. For each statistic, we computed both p values and associated false discovery rate (FDR) corrected “q values,” and log fold change values (logFC) using R [R Core Team (2020)] [39]. Because distribution of time of sampling of KLS samples was different from controls, univariate associations not only corrected for this variable but also presented together with p values obtained with time since sampling for each protein. In this study, we used a 0.1% FDR threshold to control for multiple hypothesis testing in the description of the univariate results.
Preprocessing for the multivariate analysis
The goal of this analysis was to build a classifier that could distinguish between KLS and controls using our first assays, with independent replication in a second sample. To ensure homogeneity in the data, we only analyzed a common set of proteins that were present in both training and validation panels, respectively, across the two CSF and serum matrices. Because the effects were relatively large, cross validation/training of the predictors was also performed across CSF and serum matrices. We then used the limma R package (version 3.44.3) to remove batch effects between training and validation sets for each tissue independently. Batch correction was done simultaneously for the training and validation sets. The two sets were collected independently and represent the two different batches used in the batch correction analysis. We performed a log-2 transformation for normal distribution and autoscaled the data after filtering for common proteins.
Lasso classifiers on CSF and serum
For multivariate analyses, a lasso model was trained independently on each dataset and validated using the corresponding validation dataset. This algorithm fits a classic least square linear regression adding the constraint ||B||_1<λ, where Y is the predictor vector, X the matrix of all proteomic features, β the coefficients of the regression and λ the l1 regularization coefficient. To fit the l1 regularization parameter, we used cross-validation using the glmnet package [40] (version 4.0.2) and caret package (version 6.0-88). The l1 regularization creates sparsity in the coefficients and thus operates as a feature selection procedure. Model coefficients were selected, minimizing mean-square error of the model on the cross-validation folds. We then used the cross-validated models to predict the held-out independent validation sets and predict on those sets. To evaluate final performances, we report results of the area under the receiver operator curve (AUC) for cross-validation and validation sets for serum and CSF independently. CSF model performance on serum matrix and vice versa were further set up to explore performances of models trained on CSF (discovery) and tested on serum (validation) and model trained on serum (discovery) and then tested on CSF (validation). Finally, to further validate the classifier, we performed a cross-sectional analysis of in-episode versus out of episode KLS samples within both CSF and serum matrices. A comparative distribution of the scores for each phenotype in the validation cohort was reported.
Bootstrap analysis
To account for variability of feature selections in lasso models, we operated by iterative bootstraps over the discovery sets so that proteins with most occurrences across 1000 models were selected. A feature ranking with count value of coefficients over all bootstrapped models was calculated for interpretation purposes also reporting on variance. Of note, this technique used decoy artificial features that are spiked in the dataset, so that the selection frequency of the real features can be compared with artificial ones. This ensures calculation of the likelihood that selected features are not artifactual, i.e., selected more often than spiked features.
Tissue enrichment analysis
Proteins passing the 5% FDR threshold on the univariate analysis were used as input for this analysis. Potential enrichment tissue sites for each of the protein were mapped using a dataset of consensus tissue expression based on the Human Protein Atlas version 20.1 and Ensembl version 92.38 [41]. This was next used to select proteins from those available in the SomaScan assay that could be “tissue specific,” i.e. enriched at least 2-fold in at least one of the subset tissues compared to median expression across all tissues, creating a brain protein set and an immune protein set that could distinguish these tissues. Brain and immune were selected a priori based on previous knowledge regarding KLS pathophysiology. Brain tissue sets included amygdala, cerebellum, cerebral cortex, hippocampal formation, hypothalamus, midbrain, pons, and medulla and thalamus. Immune tissue sets included B cells, dendritic cells, granulocytes, monocytes, NK cells, and T cells. For each of these sets, the corresponding tissue-specific proteins that were measured using SomaScan were separated in three categories: (1) protein is present in the assay and upregulated under FDR 5% in the univariate analysis; (2) same but downregulated in the univariate analysis under FDR 5%, and (3) either up- or downregulated. Differences in the distribution of one category against the distribution of all proteins available in the assay were computed using a chi-square test, with p value reported for subtissues.
Pathway analysis
Proteins differentially expressed and passing the thresholds as reported in Supplementary Tables S1 and S2 were used as the input for the pathway analysis. We used the STRING software (version 11.0) [42–50] to perform the pathway analysis from a network known protein–protein interactions. From the network of differentially expressed proteins (DEPs) found in the univariate analysis, we report the enrichment of pathways from the KEGG [51–53] and Reactome [54–58] ontologies that pass a 5% FDR. This analysis was performed independently on CSF and serum results.
Results
Differential expression of CSF proteins in KLS cases
Univariate analyses of CSF proteins in 23 KLS cases compared to CSF from 80 control individuals found 28 proteins differentially expressed: 21 upregulated and 7 downregulated proteins (FDR 0.1%; Mann–Whitney unpaired sum-rank test; see Figure 1, A, Supplementary Figure S3, and Table 1). Notable upregulated proteins include IL-34 (logFC = 0.59), transforming growth factor beta-2 (TGF-b2; logFC = 0.78), insulin-like growth factor 1 (IGF-1; logFC = 0.68), junctional adhesion molecule B (JAM B; logFC = 0.35), caspase 10 (logFC = 0.52), IL-27 (logFC = 0.17), and osteonectin (ON; logFC = 0.66), all predominantly from the macrophage–microglial axis. Downregulated proteins include lipopolysaccharide-binding protein (LBP; logFC = −1.49) and various Dickkopf-related proteins (see Figure 1, A and Supplementary Table S1) including DKK4 (logFC = −1.43), DKK1 (logFC = −0.64), and DKK3 (logFC = −0.33). These effects were more pronounced in KLS individuals who were in-episode (n = 23, 14 in-episode versus 9 out of episode or other KLS state, Mann–Whitney unpaired rank sum test, for all individual comparisons p < 0.05). Robust matching on various demographic variables between cases and controls did not change the significance of these results, and proteins’ association with the time of collection is reported as an additional confounder (see Table 1 and Supplementary Table S7).
Proteins dysregulated in the CSF of patients versus controls (unmatched and matched)
| Unmatched KLS (n = 23); controls (n = 80) | Matched KLS (n = 20); controls (n = 20) | Association with time of collection | |||||
|---|---|---|---|---|---|---|---|
| Protein | logFC | FDR | p | logFC | FDR | p | FDR |
| DKK4 | −1.43 | 2.5E−07 | 2.2E−10 | −1.44 | 3.8E−05 | 1.3E−07 | 2.7E−04 |
| VWF | −0.74 | 5.0E−07 | 1.1E−09 | −0.78 | 1.3E−04 | 1.1E−06 | 5.7E−02 |
| GPI | −1.73 | 5.0E−07 | 1.3E−09 | −1.91 | 6.1E−06 | 5.4E−09 | 1.6E−02 |
| PGF | −1.26 | 9.5E−07 | 3.4E−09 | −1.18 | 5.7E−04 | 1.6E−05 | 4.8E−02 |
| C9 | −0.84 | 1.3E−06 | 5.7E−09 | −0.87 | 1.1E−04 | 7.6E−07 | 4.4E−02 |
| IL17B | −1.13 | 2.3E−06 | 1.2E−08 | −1.18 | 8.1E−05 | 5.0E−07 | 3.2E−02 |
| TFPI | −0.93 | 4.0E−06 | 2.8E−08 | −0.77 | 1.4E−03 | 7.9E−05 | 1.1E−02 |
| TGFB2 | 0.78 | 4.0E−06 | 3.0E−08 | 0.96 | 2.3E−04 | 3.1E−06 | 2.4E−02 |
| DKK1 | −0.64 | 4.0E−06 | 3.2E−08 | −0.69 | 6.5E−04 | 2.5E−05 | 1.6E−02 |
| CCDC80 | −0.68 | 9.5E−06 | 8.5E−08 | −0.73 | 3.3E−04 | 5.8E−06 | 2.7E−03 |
| IL34 | 0.59 | 9.8E−06 | 9.6E−08 | 0.72 | 7.4E−05 | 3.3E−07 | 1.7E−01 |
| HGF | −0.83 | 1.0E−05 | 1.3E−07 | −0.82 | 3.8E−04 | 8.2E−06 | 3.6E−02 |
| PLA2G2A | −1.20 | 1.0E−05 | 1.3E−07 | −1.25 | 3.8E−04 | 9.6E−06 | 2.7E−02 |
| IGF1 | 0.68 | 1.0E−05 | 1.4E−07 | 0.85 | 1.3E−05 | 2.3E−08 | 6.7E−02 |
| JAM2 | 0.35 | 1.0E−05 | 1.4E−07 | 0.28 | 3.8E−03 | 3.3E−04 | 5.2E−01 |
| FABP3 | −0.57 | 1.5E−05 | 2.2E−07 | −0.66 | 8.1E−05 | 5.0E−07 | 4.4E−03 |
| IL1RL1 | −1.35 | 1.9E−05 | 2.9E−07 | −1.45 | 8.2E−04 | 3.4E−05 | 1.1E−01 |
| NXPH1 | −0.85 | 1.9E−05 | 3.1E−07 | −0.98 | 3.3E−04 | 5.8E−06 | 1.6E−02 |
| INHBA | −0.71 | 2.0E−05 | 3.5E−07 | −0.83 | 3.3E−04 | 5.8E−06 | 1.7E−01 |
| LBP | −1.49 | 2.0E−05 | 3.5E−07 | −1.65 | 3.0E−03 | 2.3E−04 | 2.4E−02 |
| ITGAV ITGB5 | −0.49 | 2.6E−05 | 4.8E−07 | −0.58 | 5.7E−04 | 1.8E−05 | 5.1E−02 |
| BGN | −1.01 | 3.0E−05 | 5.9E−07 | −1.06 | 1.0E−03 | 5.2E−05 | 1.1E−01 |
| IL27 EBI3 | 0.17 | 3.3E−05 | 6.7E−07 | 0.19 | 3.2E−04 | 4.9E−06 | 4.8E−02 |
| TNFRSF6B | −0.54 | 3.8E−05 | 8.1E−07 | −0.61 | 3.2E−03 | 2.5E−04 | 4.5E−02 |
| CASP10 | 0.52 | 4.0E−05 | 8.9E−07 | 0.60 | 6.5E−04 | 2.3E−05 | 7.7E−02 |
| GNLY | −1.45 | 6.2E−05 | 1.4E−06 | −1.29 | 5.8E−03 | 6.0E−04 | 2.4E−02 |
| SPARC | 0.66 | 6.5E−05 | 1.6E−06 | 0.84 | 3.8E−05 | 1.3E−07 | 1.6E−02 |
| CD163 | −0.49 | 9.3E−05 | 2.3E−06 | −0.60 | 8.9E−04 | 3.9E−05 | 3.1E−02 |
LogFC is log fold change, FDR is false discovery rate.
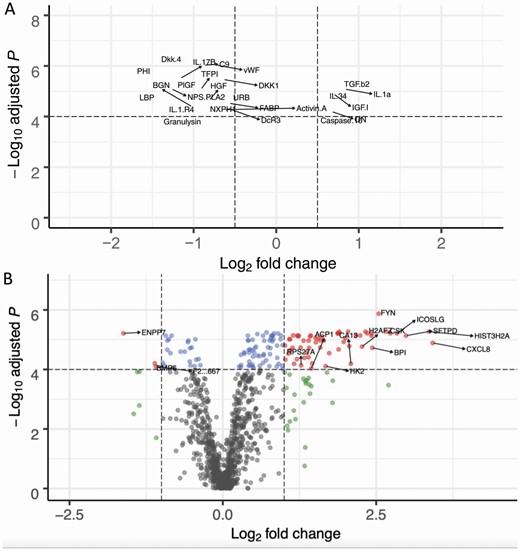
Volcano plots presenting the univariate analysis for the KLS protein signature in CSF and serum assays (A) for CSF, with 23 KLS samples and 80 controls, y-axis represents FDR and x-axis represents the log-2 fold change for which a positive value indicates upregulation for KLS samples and a negative value downregulation for KLS. Red points indicate |logFC| > 0.5 and FDR < 10−4. Blue points only pass FDR < 10−4. Green points only pass |logFC| > 1. Gray points pass neither threshold. (B) for serum, 20 KLS cases and 54 controls. Red points indicate |logFC| > 1 and FDR < 10−4. Blue points only pass FDR < 10−4. Green points only pass |logFC| > 1. Gray points pass neither threshold.
Differentially expressed serum proteins in KLS cases
Univariate analyses of serum proteins in 20 KLS cases compared to serum from 54 control individuals found 141 proteins differentially expressed: 117 proteins were significantly upregulated and 24 proteins downregulated (FDR 0.1%) (Figure 1, B and Supplementary Figure S4). A cluster of core histone complex proteins (HIST1H1C [logFC = 2.7], HIST3H2A [logFC = 3.4]), Src-family kinases (SFKs) including FYN (logFC = 2.5) and CSK (logFC = 2.7) and protein tyrosine phosphatase PTPN6 (logFC = 1.9), PTPN11 (logFC = 1.9), and TATA-Box Binding Protein (TBP, logFC = 0.7) were significantly upregulated. Downregulated proteins include alkaline sphingomyelin phosphodiesterase (ENPP7, logFC = −1.6), interleukin-13 receptor subunit alpha 1 (IL13RA1, logFC = −0.8), and interleukin-1 soluble receptor type I (IL1R1, logFC = −0.9) (Table 2 and full list in Supplementary Table S8).
Proteins dysregulated in the serum of patients versus controls (unmatched and matched)
| Unmatched KLS (n = 20); controls (n = 54) | Matched KLS (n = 20); controls (n = 20) | Association with time of collection | |||||
|---|---|---|---|---|---|---|---|
| Protein | logFC | FDR | p | logFC | FDR | p | FDR |
| FYN | 2.5 | 1.3E−06 | 1.2E−09 | 2.3 | 1.7E−05 | 3.0E−08 | 8.0E−05 |
| CSK | 2.7 | 5.4E−06 | 1.8E−08 | 2.3 | 6.0E−05 | 7.6E−07 | 2.7E−04 |
| DUSP3 | 2.0 | 5.4E−06 | 2.5E−08 | 1.9 | 6.0E−05 | 9.3E−07 | 3.6E−04 |
| HIST3H2A | 3.4 | 5.4E−06 | 1.9E−08 | 3.4 | 1.8E−04 | 5.8E−06 | 6.9E−04 |
| METAP1 | 2.3 | 5.4E−06 | 2.2E−08 | 2.2 | 1.9E−05 | 5.1E−08 | 3.6E−03 |
| PTPN11 | 1.9 | 5.4E−06 | 2.9E−08 | 1.7 | 7.4E−05 | 2.0E−06 | 4.1E−05 |
| TBP | 0.7 | 5.7E−06 | 3.6E−08 | 0.6 | 2.8E−04 | 1.6E−05 | 7.3E−07 |
| BTK | 1.9 | 6.1E−06 | 7.7E−08 | 1.7 | 6.0E−05 | 9.3E−07 | 7.3E−03 |
| EIF4G2 | 2.4 | 6.1E−06 | 8.8E−08 | 2.4 | 5.7E−05 | 4.1E−07 | 4.9E−03 |
| ENPP7 | −1.6 | 6.1E−06 | 7.2E−08 | −1.2 | 4.5E−04 | 2.9E−05 | 4.7E−04 |
| HIST1H1C | 2.7 | 6.1E−06 | 6.3E−08 | 2.5 | 7.4E−05 | 2.0E−06 | 8.1E−05 |
| HSD17B1 | 0.8 | 6.1E−06 | 8.8E−08 | 0.7 | 2.5E−04 | 1.1E−05 | 7.3E−07 |
| ICOSLG | 2.8 | 6.1E−06 | 5.8E−08 | 2.5 | 2.0E−04 | 6.9E−06 | 3.1E−05 |
| PTPN6 | 1.9 | 6.1E−06 | 8.2E−08 | 1.5 | 1.0E−03 | 1.4E−04 | 1.4E−05 |
| TPT1 | 1.9 | 6.1E−06 | 5.8E−08 | 1.9 | 6.9E−05 | 1.4E−06 | 7.3E−03 |
| VTA1 | 2.4 | 6.1E−06 | 7.2E−08 | 2.0 | 1.4E−04 | 4.1E−06 | 3.6E−04 |
| AIF1 | 0.9 | 6.2E−06 | 9.5E−08 | 0.7 | 1.0E−03 | 1.2E−04 | 5.8E−06 |
| TIMP2 | 0.6 | 6.5E−06 | 1.1E−07 | 0.6 | 6.0E−05 | 8.5E−07 | 7.6E−04 |
| AKT2 | 1.4 | 7.2E−06 | 1.5E−07 | 1.4 | 6.0E−05 | 7.6E−07 | 6.3E−06 |
| CD226 | 0.9 | 7.2E−06 | 1.4E−07 | 1.0 | 2.3E−04 | 8.6E−06 | 6.0E−02 |
| CMA1 | 0.8 | 7.2E−06 | 1.6E−07 | 0.8 | 2.8E−04 | 1.6E−05 | 7.3E−07 |
| PRKAA2 PRKAB2 PRKAG1 | 1.2 | 7.2E−06 | 1.5E−07 | 1.1 | 2.3E−04 | 9.7E−06 | 6.3E−06 |
| TOP1 | 1.1 | 7.2E−06 | 1.6E−07 | 1.1 | 2.5E−04 | 1.1E−05 | 3.6E−06 |
| TPM4 | 2.2 | 7.2E−06 | 1.6E−07 | 2.1 | 6.6E−05 | 1.1E−06 | 1.3E−02 |
| VAV1 | 2.2 | 7.2E−06 | 1.2E−07 | 1.8 | 8.4E−04 | 9.1E−05 | 2.5E−03 |
| EFNB3 | 0.4 | 7.4E−06 | 2.1E−07 | 0.4 | 6.0E−05 | 9.3E−07 | 1.3E−04 |
| EPS15L1 | 1.2 | 7.4E−06 | 1.7E−07 | 1.3 | 6.0E−05 | 7.6E−07 | 7.7E−03 |
| FER | 2.4 | 7.4E−06 | 2.1E−07 | 2.5 | 6.0E−05 | 9.3E−07 | 1.2E−02 |
| IL13RA1 | −0.8 | 7.4E−06 | 2.1E−07 | −0.6 | 4.9E−04 | 3.9E−05 | 1.8E−03 |
| IL16 | 0.7 | 7.4E−06 | 2.0E−07 | 0.5 | 7.0E−04 | 6.9E−05 | 1.9E−06 |
| IL1R1 | −0.9 | 7.4E−06 | 2.1E−07 | −0.8 | 2.3E−04 | 9.7E−06 | 1.4E−03 |
| SFTPD | 3.0 | 7.4E−06 | 1.9E−07 | 3.0 | 2.2E−03 | 3.3E−04 | 6.0E−05 |
| CEBPB | 0.8 | 7.4E−06 | 2.3E−07 | 0.7 | 2.6E−04 | 1.3E−05 | 4.4E−05 |
| STAT6 | 0.8 | 7.4E−06 | 2.3E−07 | 0.7 | 4.9E−04 | 3.7E−05 | 1.4E−05 |
| STIP1 | 1.6 | 7.7E−06 | 2.4E−07 | 1.4 | 5.9E−04 | 5.2E−05 | 5.1E−05 |
| CAMK2A | 1.2 | 7.8E−06 | 2.6E−07 | 1.1 | 4.7E−04 | 3.4E−05 | 1.1E−06 |
| RPS6KA3 | 1.4 | 7.8E−06 | 2.6E−07 | 1.3 | 5.9E−04 | 5.2E−05 | 4.1E−04 |
| UBE2I | 1.5 | 8.6E−06 | 3.0E−07 | 1.4 | 7.7E−04 | 7.9E−05 | 1.9E−03 |
| HNRNPAB | 2.0 | 9.0E−06 | 3.2E−07 | 1.8 | 4.7E−04 | 3.4E−05 | 8.5E−06 |
| CTSG | 0.8 | 9.1E−06 | 3.4E−07 | 0.7 | 2.6E−04 | 1.3E−05 | 1.9E−05 |
| SUMO3 | 1.6 | 9.1E−06 | 3.4E−07 | 1.4 | 4.0E−04 | 2.5E−05 | 1.0E−02 |
| HMGB1 | 1.1 | 9.7E−06 | 3.8E−07 | 1.0 | 8.4E−04 | 9.1E−05 | 2.3E−07 |
| IDS | −0.9 | 9.7E−06 | 4.1E−07 | −0.7 | 7.0E−04 | 6.9E−05 | 7.2E−03 |
| MAPK14 | 0.9 | 9.7E−06 | 4.1E−07 | 0.9 | 1.0E−03 | 1.2E−04 | 7.5E−05 |
| NUDCD3 | 1.1 | 9.7E−06 | 4.1E−07 | 1.2 | 7.1E−05 | 1.7E−06 | 1.1E−02 |
| TEC | 0.8 | 9.7E−06 | 3.8E−07 | 0.8 | 7.1E−05 | 1.7E−06 | 1.1E−02 |
| TIE1 | −0.4 | 9.7E−06 | 4.1E−07 | −0.4 | 3.6E−04 | 2.1E−05 | 3.1E−02 |
| PRKCD | 0.5 | 1.0E−05 | 4.4E−07 | 0.4 | 5.9E−04 | 5.2E−05 | 1.4E−05 |
| GFRA3 | 0.4 | 1.1E−05 | 4.7E−07 | 0.4 | 2.6E−04 | 1.3E−05 | 9.7E−06 |
| CAMK2B | 1.6 | 1.1E−05 | 5.3E−07 | 1.3 | 1.0E−03 | 1.4E−04 | 1.2E−06 |
| CAMK2D | 1.6 | 1.1E−05 | 5.3E−07 | 1.4 | 6.5E−04 | 6.0E−05 | 1.2E−06 |
| CDH1 | −0.6 | 1.1E−05 | 5.3E−07 | −0.5 | 2.5E−04 | 1.1E−05 | 5.1E−05 |
| KAT6A | 0.4 | 1.1E−05 | 5.0E−07 | 0.4 | 8.6E−05 | 2.4E−06 | 3.1E−06 |
| LBP | −0.9 | 1.1E−05 | 5.3E−07 | −0.8 | 2.8E−04 | 1.6E−05 | 1.5E−02 |
| MMP17 | 0.8 | 1.1E−05 | 5.3E−07 | 0.7 | 2.2E−04 | 8.2E−06 | 1.6E−05 |
| CCL13 | 0.7 | 1.1E−05 | 5.6E−07 | 0.7 | 7.4E−05 | 2.0E−06 | 1.1E−03 |
| DDX19B | 1.4 | 1.1E−05 | 5.6E−07 | 1.2 | 1.0E−03 | 1.2E−04 | 9.6E−04 |
| XRCC6 | 1.3 | 1.1E−05 | 5.6E−07 | 1.0 | 6.7E−03 | 1.4E−03 | 3.6E−07 |
| CYP3A4 | 0.8 | 1.1E−05 | 6.0E−07 | 0.7 | 7.0E−04 | 6.9E−05 | 1.8E−03 |
| HNRNPA2B1 | 2.0 | 1.2E−05 | 6.4E−07 | 1.9 | 2.4E−03 | 3.7E−04 | 8.0E−05 |
| GDF15 | −0.6 | 1.2E−05 | 6.6E−07 | −0.4 | 1.3E−03 | 1.7E−04 | 1.2E−01 |
| TAGLN2 | 1.5 | 1.2E−05 | 6.8E−07 | 1.6 | 5.7E−05 | 4.1E−07 | 1.2E−02 |
| CXCL8 | 3.4 | 1.3E−05 | 7.3E−07 | 3.9 | 5.7E−05 | 3.3E−07 | 7.6E−02 |
| CLIC1 | 1.0 | 1.5E−05 | 8.8E−07 | 0.8 | 4.9E−04 | 3.9E−05 | 6.3E−06 |
| SNX4 | 1.0 | 1.6E−05 | 9.4E−07 | 0.8 | 7.7E−04 | 7.9E−05 | 2.6E−04 |
| YWHAB YWHAE YWHAG YWHAH YWHAQ YWHAZ SFN | 0.9 | 1.6E−05 | 9.4E−07 | 0.8 | 2.8E−04 | 1.6E−05 | 2.2E−05 |
| IMPDH1 | 2.1 | 1.7E−05 | 1.0E−06 | 2.0 | 2.6E−03 | 4.2E−04 | 4.2E−05 |
| H2AFZ | 2.3 | 1.7E−05 | 1.1E−06 | 2.2 | 4.7E−04 | 3.4E−05 | 6.3E−06 |
| IGF1 | 0.5 | 1.7E−05 | 1.1E−06 | 0.6 | 3.7E−05 | 1.3E−07 | 9.3E−03 |
| PRKCZ | 0.7 | 1.8E−05 | 1.1E−06 | 0.6 | 9.2E−04 | 1.0E−04 | 1.4E−05 |
| LAMA1 LAMB1 LAMC1 | −0.5 | 1.8E−05 | 1.2E−06 | −0.5 | 3.2E−04 | 1.8E−05 | 2.2E−02 |
| LYN (Duplicate 1/2) | 1.6 | 1.8E−05 | 1.2E−06 | 1.2 | 2.4E−03 | 3.7E−04 | 2.0E−05 |
| SBDS | 1.3 | 1.8E−05 | 1.2E−06 | 1.1 | 4.0E−04 | 2.5E−05 | 7.5E−05 |
| BPI | 2.4 | 1.9E−05 | 1.3E−06 | 2.7 | 6.9E−05 | 1.4E−06 | 6.4E−02 |
| NAGK | 1.1 | 1.9E−05 | 1.3E−06 | 1.0 | 9.2E−04 | 1.0E−04 | 1.9E−06 |
| RPS7 | 1.4 | 1.9E−05 | 1.3E−06 | 1.2 | 4.8E−03 | 9.3E−04 | 1.2E−05 |
| FCGR1A | 0.5 | 1.9E−05 | 1.4E−06 | 0.5 | 5.1E−04 | 4.2E−05 | 2.3E−04 |
| FSTL3 | −0.5 | 1.9E−05 | 1.4E−06 | −0.4 | 6.2E−03 | 1.3E−03 | 4.2E−02 |
| SSRP1 | 0.8 | 1.9E−05 | 1.4E−06 | 0.7 | 1.3E−03 | 1.8E−04 | 1.3E−04 |
| EIF4A3 | 0.4 | 2.1E−05 | 1.6E−06 | 0.4 | 1.0E−03 | 1.2E−04 | 1.9E−05 |
| PDPK1 | 1.9 | 2.1E−05 | 1.6E−06 | 1.4 | 1.1E−02 | 2.9E−03 | 2.2E−04 |
| CTSE | 0.4 | 2.2E−05 | 1.6E−06 | 0.5 | 1.8E−04 | 5.8E−06 | 2.3E−02 |
| PRSS2 | −0.9 | 2.2E−05 | 1.6E−06 | −0.7 | 3.2E−03 | 5.3E−04 | 4.1E−02 |
| ESR1 | 0.5 | 2.3E−05 | 1.8E−06 | 0.5 | 2.2E−04 | 8.2E−06 | 5.9E−05 |
| PDXK | 1.1 | 2.3E−05 | 1.8E−06 | 0.9 | 4.8E−03 | 9.3E−04 | 2.8E−05 |
| INSR | −0.6 | 2.5E−05 | 2.0E−06 | −0.4 | 4.5E−03 | 8.4E−04 | 6.1E−02 |
| TNFRSF25 | −0.7 | 2.5E−05 | 2.0E−06 | −0.6 | 2.0E−03 | 2.9E−04 | 2.1E−03 |
| HDGFRP2 | 0.3 | 2.7E−05 | 2.1E−06 | 0.2 | 6.2E−03 | 1.3E−03 | 7.3E−07 |
| MAPK12 | 0.5 | 2.7E−05 | 2.2E−06 | 0.6 | 2.3E−04 | 9.7E−06 | 3.8E−03 |
| LCK | 0.4 | 2.7E−05 | 2.2E−06 | 0.3 | 1.1E−02 | 2.9E−03 | 7.3E−07 |
| TPI1 | 1.4 | 2.7E−05 | 2.2E−06 | 1.4 | 8.4E−04 | 9.1E−05 | 3.0E−03 |
| S100A12 | 1.7 | 2.8E−05 | 2.4E−06 | 1.7 | 1.0E−03 | 1.4E−04 | 3.0E−03 |
| TFPI | −0.9 | 2.8E−05 | 2.4E−06 | −0.9 | 4.7E−04 | 3.4E−05 | 2.3E−03 |
| SELL | 0.4 | 3.0E−05 | 2.5E−06 | 0.3 | 1.0E−03 | 1.4E−04 | 1.3E−04 |
| TNFSF14 | 1.1 | 3.0E−05 | 2.5E−06 | 1.1 | 6.6E−05 | 1.1E−06 | 2.6E−02 |
| DAPK2 | 0.7 | 3.1E−05 | 2.7E−06 | 0.5 | 1.1E−02 | 2.9E−03 | 3.9E−07 |
| PRKCI | 0.8 | 3.1E−05 | 2.7E−06 | 0.6 | 2.9E−03 | 4.7E−04 | 2.7E−05 |
| CSNK2A1 | 0.3 | 3.2E−05 | 2.9E−06 | 0.3 | 4.9E−04 | 3.7E−05 | 1.5E−04 |
| CLEC1B | 0.7 | 3.4E−05 | 3.0E−06 | 0.5 | 1.2E−03 | 1.6E−04 | 5.2E−02 |
| MAPK13 | 0.6 | 3.5E−05 | 3.1E−06 | 0.4 | 1.5E−02 | 4.3E−03 | 1.3E−03 |
| HMOX2 | 0.6 | 3.5E−05 | 3.2E−06 | 0.5 | 9.2E−03 | 2.2E−03 | 6.2E−06 |
| MATN3 | 0.5 | 3.7E−05 | 3.4E−06 | 0.5 | 4.5E−04 | 2.9E−05 | 6.2E−06 |
| UBE2N | 1.4 | 3.9E−05 | 3.6E−06 | 1.4 | 1.4E−03 | 2.0E−04 | 1.0E−02 |
| CFL1 | 0.9 | 4.1E−05 | 3.8E−06 | 0.8 | 2.9E−03 | 4.7E−04 | 1.3E−03 |
| RBM39 | 1.3 | 4.1E−05 | 3.8E−06 | 1.1 | 1.3E−02 | 3.5E−03 | 3.4E−04 |
| LGALS3 | −0.4 | 4.5E−05 | 4.3E−06 | −0.3 | 6.2E−03 | 1.3E−03 | 9.5E−03 |
| UFM1 | 1.2 | 4.5E−05 | 4.3E−06 | 1.2 | 6.5E−04 | 6.0E−05 | 2.1E−03 |
| DSC2 | −0.4 | 4.7E−05 | 4.6E−06 | −0.3 | 1.3E−02 | 3.5E−03 | 6.8E−04 |
| PAFAH1B2 | 1.0 | 4.7E−05 | 4.6E−06 | 1.0 | 1.0E−03 | 1.4E−04 | 4.9E−05 |
| TP53 | 0.7 | 4.9E−05 | 4.9E−06 | 0.5 | 9.2E−04 | 1.0E−04 | 5.0E−03 |
| BMPER | 0.4 | 5.4E−05 | 5.5E−06 | 0.5 | 7.1E−05 | 1.7E−06 | 6.1E−04 |
| EFNB2 | −0.5 | 5.4E−05 | 5.5E−06 | −0.4 | 4.1E−03 | 7.5E−04 | 3.8E−02 |
| IDUA | 0.7 | 6.0E−05 | 6.2E−06 | 0.7 | 2.3E−04 | 9.7E−06 | 1.1E−03 |
| SFRP1 | −1.0 | 6.0E−05 | 6.2E−06 | −1.0 | 4.7E−04 | 3.4E−05 | 3.0E−02 |
| BMP6 | −1.1 | 6.3E−05 | 6.5E−06 | −0.9 | 2.6E−03 | 4.2E−04 | 1.8E−03 |
| LYN (Duplicate 2/2) | 1.5 | 6.3E−05 | 6.5E−06 | 1.0 | 1.5E−02 | 4.3E−03 | 9.4E−05 |
| CA13 | 2.1 | 6.5E−05 | 6.9E−06 | 2.2 | 2.2E−04 | 8.2E−06 | 5.3E−02 |
| RAC3 | 0.9 | 6.5E−05 | 6.9E−06 | 0.9 | 1.4E−03 | 2.0E−04 | 9.4E−06 |
| TKT | 1.2 | 6.5E−05 | 6.9E−06 | 1.2 | 1.6E−03 | 2.3E−04 | 6.3E−03 |
| NCK1 | 0.5 | 6.8E−05 | 7.3E−06 | 0.4 | 1.5E−02 | 4.3E−03 | 1.1E−01 |
| MDM2 | 0.3 | 7.1E−05 | 7.8E−06 | 0.3 | 3.8E−04 | 2.3E−05 | 2.4E−04 |
| SIGLEC7 | −0.4 | 7.2E−05 | 8.0E−06 | −0.4 | 3.6E−04 | 2.1E−05 | 1.3E−01 |
| TGFB3 | 0.4 | 7.2E−05 | 8.0E−06 | 0.5 | 3.6E−04 | 2.1E−05 | 9.9E−04 |
| PLXNB2 | −0.5 | 7.3E−05 | 8.2E−06 | −0.3 | 4.2E−02 | 1.5E−02 | 4.1E−03 |
| RPS27A | 1.3 | 7.3E−05 | 8.2E−06 | 1.2 | 3.4E−03 | 6.0E−04 | 3.0E−03 |
| BCL2 | 0.6 | 7.5E−05 | 8.7E−06 | 0.6 | 8.4E−04 | 9.1E−05 | 1.9E−05 |
| CASP3 | 1.0 | 7.5E−05 | 8.7E−06 | 0.8 | 2.4E−03 | 3.7E−04 | 2.0E−04 |
| COL23A1 | 0.4 | 7.5E−05 | 8.7E−06 | 0.6 | 5.7E−05 | 2.6E−07 | 4.4E−02 |
| F2 (Duplicate 1/2) | −0.9 | 7.5E−05 | 8.7E−06 | −0.9 | 4.9E−04 | 3.9E−05 | 1.3E−04 |
| DSG2 | −0.5 | 7.8E−05 | 9.2E−06 | −0.5 | 2.5E−04 | 1.1E−05 | 4.3E−04 |
| HK2 | 1.7 | 7.8E−05 | 9.2E−06 | 1.4 | 9.2E−03 | 2.2E−03 | 6.7E−06 |
| PTPN1 | 0.8 | 7.8E−05 | 9.2E−06 | 0.5 | 4.8E−03 | 9.3E−04 | 6.8E−03 |
| CHST2 | 0.5 | 8.0E−05 | 9.8E−06 | 0.5 | 1.0E−03 | 1.4E−04 | 3.5E−05 |
| CLEC7A | 0.3 | 8.0E−05 | 9.8E−06 | 0.3 | 6.9E−05 | 1.4E−06 | 1.1E−03 |
| F2 (Duplicate 2/2) | −1.1 | 8.0E−05 | 9.8E−06 | −1.1 | 7.7E−04 | 7.9E−05 | 2.9E−03 |
| PPIA | 0.9 | 8.0E−05 | 9.8E−06 | 0.8 | 3.4E−03 | 6.0E−04 | 3.5E−02 |
| DNAJB1 | 0.3 | 8.4E−05 | 1.0E−05 | 0.2 | 6.9E−03 | 1.5E−03 | 6.7E−06 |
| IL3 | 0.5 | 8.8E−05 | 1.1E−05 | 0.4 | 2.9E−03 | 4.7E−04 | 8.2E−01 |
| SLAMF7 | −0.8 | 8.8E−05 | 1.1E−05 | −0.9 | 2.3E−04 | 9.7E−06 | 3.0E−02 |
| ACP1 | 1.4 | 9.2E−05 | 1.2E−05 | 1.3 | 1.2E−03 | 1.6E−04 | 3.5E−04 |
| SELP | 1.0 | 9.7E−05 | 1.2E−05 | 1.0 | 4.7E−04 | 3.4E−05 | 2.0E−01 |
LogFC is log fold change, FDR is false discovery rate.
Increased cytokine expression in KLS cases in CSF and serum
In the KLS CSF and serum samples (both and in-episode and other KLS cases combined), interleukins known to be secreted by macrophages were differentially expressed from controls samples: IL-8 (pCSF = 0.0006; pSerum = 0.0005) and IL-6 (pCSF = 0.007; pSerum = 0.1) were upregulated with a 4-fold difference in serum and 1.1-fold difference in CSF. CSF expression of IL-1B (pCSF = 0.001) and IL-12 (pCSF = 1.4 × 10⁻⁵) was upregulated in KLS. Additionally, microglial activity in KLS is shown through differential expression of IL-34 (pCSF < 10−6), CSF-1 (pCSF = 0.004), IL-1B (pCSF = 0.0006), IL-6 (pCSF = 0.007), and IGF-1 (pCSF = 1.6 × 10⁻⁶). These suggest interactions with cell genesis and myelination activity. Interestingly, expression of IL-34 is also increased (logFC = 1.43, pCSF < 10−6) in KLS patients while expression of the protein CSF-1 is decreased (logFC = 0.76, pCSF = 0.004). Upregulation of IL-4 (logFC = 1.1, pCSF = 6 × 10⁻⁵) and IL-13 (logFC = 1.1, pCSF = 6 × 10⁻⁴) also suggest M2 macrophage differentiation.
Proteomic based machine-learning predicts KLS status
The motivation to build a machine-learning classifier to predict KLS phenotype came from our univariate analyses and completed by a dimensionality reduction analysis by PCA, showing apparent separability between group along the first principal component axis in both CSF and serum (Supplementary Figure S5). These analyses revealed relatively large effect sizes between KLS cases and controls indicating feasibility. A lasso-based machine-learning framework with cross-validation was thus used to train CSF and serum classifiers predicting KLS status, and validated in independent datasets. Three models were trained: CSF model, serum model, and cross-tissue model (CSF on serum and vice versa), and validated. In addition, we benchmarked several machine-learning models against the lasso and found it to perform the best on both serum and CSF datasets. Results of the modeling are reported in Supplementary Tables S9 and S10.
The CSF model was trained on a cohort of 103 individuals (22.3% KLS cases with n = 23) with leave-one-out cross validation. This trained CSF model was then validated in a cohort of 61 individuals (11.5% KLS cases with n = 7). As our training and validation cohorts were assayed on two different CSF SomaScan matrices with varying number of protein targets, an intersection of proteins (n = 504) present in both batches was used as an input to the lasso model with only a simple log-2 normalization. Notably, the CSF model achieved an AUC of 0.98 ([0.96–1], 95% confidence interval [CI]) in cross validation. Of significance, when this CSF model was evaluated in the validation CSF dataset, the model classified KLS cases accurately achieving an AUC of 0.90 ([0.78–1], 95% CI) (see Figure 2, A for receiver operating curve [ROC], and Supplementary Figure S3 for boxplots). The coefficients of the model are presented in Supplementary Table S11. Because of known variability in the selection of features with lasso modeling, we then asked what are the top protein features that are robustly predictive of KLS status (both in-episode and other KLS samples) in the CSF model. A bootstrap analysis (see methods) identified a panel of eight proteins to be particularly enriched at least 70% of the time in 1000 instances of training (see Supplementary Table S12). These eight proteins were TFPI (100%), vWF (99%), IL-34 (97%), PHI (96%), C9 (92%), albumin (87%), IL-1a (74%), and LBP (73%) in the CSF model.
![Receiver-operator curves for the classifier cross-validated training and independent validations with CIs at 95% obtained with bootstrapping. The lasso models are trained on the intersection of the available protein in each dataset. Data are normalized in each dataset before performing the training and validation task. (A) For CSF training set (n = 103 [23 KLS cases, 80 controls], number of features = 504), the cross-validated training shows an AUC of 0.98 [0.96–1] in blue and significantly validates on the independent cohort (n = 61) with an AUC of 0.90 [0.78–1] in gray. (B) For serum (n = 74 [20 KLS cases, 54 controls], number of features = 602), AUC of 0.96 [0.91–0.99] on training in blue and significantly validates on the independent cohort (n = 17) with and AUC of 1 [1–1] in gray (in this case, because of the AUC of 1, a proper CI cannot be obtained). (C) For the models across tissue, the first model in gray is trained on CSF (n = 103, number of features = 505) and tested on serum samples and significantly discriminates between KLS and controls with an AUC of 0.80 [0.69–0.89]. Similarly, the model trained on serum in blue discriminates CSF samples with an AUC of 0.71 [0.59–0.82].](https://oup.silverchair-cdn.com/oup/backfile/Content_public/Journal/sleep/45/9/10.1093_sleep_zsac097/1/m_zsac097f0002.jpeg?Expires=1749798583&Signature=U474gegt2KjsZ3Kp7sxBFzF9kWNMjSqCMg2s2Zxs~lvH27UlA7yaIWncAvz6WfNaAiR~XlMxs~qJxSPRQfwWvauY~kcWOZ9zxRHw7gMgRwDjpCyes4V8dFxH1TuqeIirXV39kXYfYD1VDZkEPFtXJ~-4TBKf1Clb2uAkfuZrICHAvhP~U3mwoo95D~DmhMgED22uymoUrtqySMUx5h33GO1S383nJU5Sn5Pgc5vmYYWlTWXTv2az9LhXcoicOc3j4iRWSZvXEhaIsaX7-58nSvdGnOHL74JGdDf3aqWF3SVd87IU9BA5bESP4KMAp9YfGUQf6kHyGYJaRHsfDwmUrw__&Key-Pair-Id=APKAIE5G5CRDK6RD3PGA)
Receiver-operator curves for the classifier cross-validated training and independent validations with CIs at 95% obtained with bootstrapping. The lasso models are trained on the intersection of the available protein in each dataset. Data are normalized in each dataset before performing the training and validation task. (A) For CSF training set (n = 103 [23 KLS cases, 80 controls], number of features = 504), the cross-validated training shows an AUC of 0.98 [0.96–1] in blue and significantly validates on the independent cohort (n = 61) with an AUC of 0.90 [0.78–1] in gray. (B) For serum (n = 74 [20 KLS cases, 54 controls], number of features = 602), AUC of 0.96 [0.91–0.99] on training in blue and significantly validates on the independent cohort (n = 17) with and AUC of 1 [1–1] in gray (in this case, because of the AUC of 1, a proper CI cannot be obtained). (C) For the models across tissue, the first model in gray is trained on CSF (n = 103, number of features = 505) and tested on serum samples and significantly discriminates between KLS and controls with an AUC of 0.80 [0.69–0.89]. Similarly, the model trained on serum in blue discriminates CSF samples with an AUC of 0.71 [0.59–0.82].
The serum model was trained on a cohort of 74 individuals (27.0% KLS cases with n = 20) with n-fold cross validation. This trained serum model was then validated in a cohort of 17 individuals (35.3% KLS cases with n = 6). Although limited by sample number in the validation cohort, the serum model performed well with an AUC of 0.96 ([0.91–0.99], 95% CI) in cross validation and notably with an AUC of 1 ([1–1], 95% CI) in the independent validation cohort (see Figure 2, B for ROC curve, and Supplementary Figure S4 for boxplots). Again, the coefficients of the model are presented in Supplementary Table S11. Dissecting the top predictors in the serum model using bootstrapping, we observed that 5 proteins are selected at least 70% in 1000 training instances. These proteins are ENPP7 (96.3%), FYN (91.5%), H2A3 (90.6%), LBP (88.4%), and CD226 (84%) (see Supplementary Table S13). They represent the most robust predictors of KLS status in the serum model.
Even more strikingly, we found that the CSF model also classified KLS status with high accuracy when validated on the serum proteomics (AUC = 0.8 [0.69–0.89] 95% CI, p = 8 × 10⁻⁵, Mann–Whitney rank sum test on the predictions) whereas the serum model when validated on CSF proteomics performed moderately (AUC = 0.71 [0.59–0.82] 95% CI, p = 0.002) (see Figure 2, C). The proteins with nonzero coefficients used in the fitted lasso models are reported in Supplementary Table S11 and identify a predictive feature set of 17 proteins for serum and 6 proteins for CSF.
Machine learning can predict in-episode KLS cases versus rest
As the largest effects were found in KLS cases that were experiencing an episode, predictions of CSF and serum models and the most informative features differences are strikingly pronounced for in-episode versus the rest of KLS samples. In the case of the CSF model, median prediction value (which can be interpreted as probabilities for being a case) was for controls 0.10 (interquartile range [IQR] 0.076–0.165), while for KLS samples out of episode and other KLS labels it was 0.47 (IQR 0.319–0.497) and for KLS samples in-episode it was 0.61 (IQR 0.536–0.788). In the CSF model, separation of KLS in-episode versus samples out of episode and other KLS labels had an AUC of 0.76 [0.55–0.97] 95% CI. For the serum model, median prediction value for controls was 0.004 (IQR 0.0006–0.05), while for KLS samples out of episode and other KLS labels it was 0.79 (IQR 0.62–0.96) and for KLS samples in-episode it was 0.96 (IQR 0.91–0.97). In the serum model, separation of KLS in-episode versus samples out of episode and other KLS labels had an AUC of 0.69 [0.43–0.95] 95% CI. Further, some of the top hits found in the univariate analysis in association with KLS also differentiated in versus out of episode status. For example, TGFB2, DKK4, ALB, IGF-1, JAM2, and CASP10 were among the top 10 proteins in CSF and ENPP7, H2A3, TBP, sTie-1, and B7-H2 were among the top 10 protein hits in serum. These results are shown in Supplementary Figures S6–S9.
Mapping protein disturbances to specific brain regions
To help interpretation of the protein signature identified, we performed tissue enrichment analysis with focus on brain and immune tissues. Interestingly, a disruption of brain tissue-specific region proteins was observed in KLS versus control CSF when pooling up- and downregulated perturbed proteins (p = 6 × 10⁻⁵, chi-square test on the overall distribution of brain-specific proteins differentially expressed for KLS). Specifically, we show upregulation of cerebellum and midbrain-specific proteins (p = 0.005 and p = 0.05), and downregulation of pons and medulla proteins (p = 2 × 10⁻⁴). Other comparisons were unremarkable (see Table 3 and Supplementary Table S14).
Brain region-specific proteins are dysregulated in the CSF of KLS patients
| Tissue | Tissue-specific protein | n | p | % |
|---|---|---|---|---|
| Upregulated in KLS | ||||
| Amygdala | 10 | 0 | 0.23 | 0 |
| Cerebellum | 57 | 0 | 5E-03 | 0 |
| Cerebral cortex | 144 | 26 | 0.19 | 18 |
| Hippocampal formation | 10 | 3 | 0.17 | 30 |
| Hypothalamus | 4 | 0 | 0.44 | 0 |
| Midbrain | 29 | 8 | 0.05 | 28 |
| Pons and medulla | 31 | 3 | 0.51 | 10 |
| Thalamus | 2 | 1 | 0.17 | 50 |
| All brain | 287 | 41 | 7E−03 | 14 |
| Downregulated in KLS | ||||
| Amygdala | 10 | 0 | 0.27 | 0 |
| Cerebellum | 57 | 5 | 0.47 | 9 |
| Cerebral cortex | 144 | 12 | 0.2 | 8 |
| Hippocampal formation | 10 | 1 | 0.83 | 10 |
| Hypothalamus | 4 | 0 | 0.48 | 0 |
| Midbrain | 29 | 6 | 0.17 | 21 |
| Pons and medulla | 31 | 11 | 2E-04 | 35 |
| Thalamus | 2 | 0 | 0.61 | 0 |
| All brain | 287 | 35 | 5E−03 | 12 |
| Up- or downregulated in KLS | ||||
| Amygdala | 10 | 0 | 0.1 | 0 |
| Cerebellum | 57 | 5 | 0.01 | 9 |
| Cerebral cortex | 144 | 38 | 0.86 | 26 |
| Hippocampal formation | 10 | 4 | 0.37 | 40 |
| Hypothalamus | 4 | 0 | 0.3 | 0 |
| Midbrain | 29 | 14 | 0.02 | 48 |
| Pons and medulla | 31 | 14 | 0.04 | 45 |
| Thalamus | 2 | 1 | 0.5 | 50 |
| All brain | 287 | 76 | 6E−05 | 26 |
Discussion
Our study interrogates the proteomic architecture of KLS patients versus matched controls in two different tissues (serum and CSF) using high-throughput proteomic SomaScan assays. Our univariate analyses found 28 and 141 proteins (see Supplementary Tables S7 and S8) to be differentially expressed in CSF and serum, respectively (FDR <0.1%). Of significance, DEPs in CSF tended to be related to microglial–monocyte axis. As a result of finding relatively large effects in univariate analysis, we trained a machine-learning classifier to predict KLS status using either CSF or serum protein measurements. These performed robustly achieving mean AUCs of 0.90 ([0.78–1], 95% CI) and 1.0 ([0.78–1], 95% CI) when evaluated in validation cohorts, respectively. Further, differences between in-episode versus other KLS samples were even larger and reflected a general dysregulated proteomic makeup in both CSF and serum during episodes. These promising results suggest initial diagnostic potential of the identified protein markers.
Several of the top differentially regulated proteins in CSF belong to the microglial–monocyte–macrophage axis. These include IL-34 and CSF-1, two critical ligands of the CSF-1R (colony-stimulating factor 1 receptor), a receptor present on mononuclear phagocytes [59]. CSF-1R promotes survival and drives differentiation from monocytes to macrophages [59]. Although these two proteins share no sequence homology, they have functionally identical roles driving different cytokine secretions in macrophages [60], with IL-34 predominantly stimulating eotaxin-1, IL-10, and CCL10 release while CSF-1 stimulates MCP-1 secretion. In our study, IL-34 was upregulated while CSF-1 was downregulated. Further, other cytokines positively regulated by IL-34 were also significantly upregulated, for instance IL-10. Although eotaxin-1 was present in our CSF panel, we did not observe significant changes in KLS cases versus controls. In agreement with the CSF-1 involvement, MCP-1, a known factor promoted by CSF-1, was also downregulated in KLS cases.
IL-34 is predominantly secreted by neurons and has been involved in promoting the survival of microglia [60]. It is expressed predominantly in the cortex, olfactory nucleus, and the hippocampus but not in the brainstem and cerebellum. Of interest, IL-34 treated microglial cells, when cocultured with neurons, triggers secretion of TGF-beta and this negatively regulates proliferation of microglia, promoting neuroprotection [61]. In agreement with this hypothesis, we observed significantly elevated CSF TGF-beta-2 and TGF-beta-1 in KLS cases. Increased IL-34 could thus serve as a compensatory mechanism to limit excitotoxin-induced neuronal cell loss and gliosis [62]. Neuronal excitotoxicity is typically caused by prolonged exposure to glutamate, a major excitatory neurotransmitter, possibly explaining why we also observed increased caspase-10, an apoptosis-related protein of the extrinsic apoptosis pathway [63]. A plausible hypothesis for these changes could therefore be that an increased baseline state of neuronal excitability triggers KLS episodes with increased IL-34 in CSF serving as a compensatory mechanism to limit neurotoxiciy. This could also explain the observation why gamma-hydroxybutyrate, a strong sedative, has triggered KLS episodes in some patients [64, 65].
Consistent with a hypothesis of neuroinflammation, we also observed JAM-b to be increased in CSF from KLS cases; JAM-b has been implicated as a critical factor that promotes leukocyte extravasation and transmigration [66]. Further, we also observed increased IL-27, a cytokine primarily secreted by myeloid cells such as macrophages, dendritic cells and microglia induced by immune stimuli [66]. Limited studies indicate a neuroprotective effect of IL-27 in CNS tissue but its mechanisms of action are not completely understood [67].
Independently of inflammation, other abnormalities were more neuronal in nature. Our analyses additionally found increased IGF-1 expression in the CSF of KLS cases. IGF-1 is a growth factor primarily secreted by the liver peripherally and by specific neurons within the CNS [68]. IGF-1 has been observed to be a pleiotropic growth factor critical for survival and differentiation of various cell types including neuronal cells [68]. IGF-1 is under the influence of growth hormone (GH) which in turn is modulated by ghrelin [69]. IGF-1 has been observed to have a linear relationship with caloric intake [70] and/or growth spurts during puberty [71]. Two possible explanations may be involved. First, the increased state of hypersomnia in KLS could promote secretion of GH [72, 73] as it is sleep dependent, and in-turn IGF-1 would be increased. Alternatively, as some KLS episodes are associated with megaphagia, increased caloric intake could suppress ghrelin and increase GH and IGF-1 [74].
Of significance, our CSF analysis also identified that a cluster of Dickkopf-related proteins (DKK) were consistently downregulated in KLS cases. The DKK proteins have been reported to modulate Wnt/β-catenin signaling [75], a critical pathway with role in axon guidance, dendrite development and synapse formation [76]. In particular, DKK4 has been previously associated with schizophrenia [77]. More recently in agreement with our findings, DKK proteins were observed to be downregulated in both bipolar disorder and schizophrenia [78]. Usage of lithium and other antipsychotic drugs could drive this dysregulated cluster of DKK proteins and in turn the Wnt/β-catenin signaling pathways [79].
Although univariate analysis suggests that KLS was associated with an activation of the microglial–monocyte–macrophage axis, global analysis of tissue-specific protein changes found brain rather than immune-specific protein dysregulations, with changes more pronounced in proteins enriched in the brainstem, linking immune abnormalities to brainstem dysregulation. These brainstem disturbances are well positioned to dysregulate forebrain structures in a global fashion as observed in imaging studies. Changes in global protein profile were also reproducible, as we were able to extract interrelated proteomic features that consistently separated KLS patients from controls across CSF and serum. This result is remarkable considering the fact that two slightly different SomaScan arrays and procedures were used to train and test models, and the model trained on CSF performed well when tested on serum sample, suggesting commonality. This suggests that CSF and serum protein measurements could be used in the diagnosis of KLS, although additional testing and use of larger protein panels would be warranted to confirm this finding.
The study has several limitations. First, the cross-sectional design of the present study precludes any inferences on causality. The number of measured proteins (several hundreds) outnumbered sample size (hundred), a phenomenon known to lead to false-positive discoveries [80]. Second, by nature, protein data are highly correlated, reflecting coordinated interactions between biological entities [81]. Third, this study only provides a single time snapshot of the patient’s proteomic expression. Third, in eight KLS cases, we were unable to verify if the samples assayed were in-episode or out of episode. Finally, although we applied great care in eliminating many possible artifacts such as time of sample storage, the study used previously collected samples and may be confounded by an unknown variable. Specifically, the matching strategy performed was imperfect given the small number of cases and controls available, and resulted in unbalanced demographics after matching, despite an overall improvement. Although these results are promising and replicated strongly, larger scale studies using newer panels of proteins, now able to measure 5500 proteins, in a larger number of KLS cases and controls is needed to confirm and extend on these findings. Additionally, future research should further examine the diagnostic potential of the identified protein markers with larger cohorts and using alternative proteomic techniques (e.g. mass spectrometry), as well as comparing the identified proteins with the proteomic profile of other disorders that commonly present with hypersomnia (e.g. severe depression, infectious disease) that would expedite the differential diagnosis of KLS.
Funding
The study was primarily funded by the Kleine Levin Syndrome foundation (KLSF) (2017–2022) and by NIH Grant R01MH080957 (2007−2013) to E.J.-M.M. The French Kleine-Levin Syndrome research program is financed by a grant to I.A. (Grant PHRC 070138) from the French Ministry of Health. Computing for this project was performed on the Stanford Genomics cluster supported by NIH Grant 1S10OD023452-01. We thank the Stanford Research Computing Center for providing computational resources and support that contributed to these research results.
Disclosure Statement
Nonfinancial disclosures: All authors report no disclosures, we certify that the submission is not under review at any other publication. The corresponding author, EM, takes full responsibility for the data, the analyses, and interpretation, and the conduct of the research. He has full access to all of the data, and he has the right to publish any and all data separate and apart from any sponsor.
Financial disclosures: EM occasionally consults and has received contracts from Jazz Pharmaceuticals, is and has been a Principal Investigator on clinical trials using sodium oxybate and Solriamfetol, Jazz Pharmaceutical products, for the treatment of Type 1 Narcolepsy; none of these have any scientific relationships to the current study. There exist no financial or other relationships that might lead to a perceived conflict of interest.
Data Availability
All data used in this study are presented in the supplementary tables, any other data can be requested by contacting the corresponding authors.


Comments