


Abstract
We characterized vigilance deterioration with increasing time-on-task (ToT) during recurrent sleep restriction of different extents on simulated weekdays and recovery sleep on weekends, and tested the effectiveness of afternoon napping in ameliorating ToT-related deficits.
In the Need for Sleep studies, 194 adolescents (age = 15–19 years) underwent two baseline nights of 9-h time-in-bed (TIB), followed by two cycles of weekday manipulation nights and weekend recovery nights (9-h TIB). They were allocated 9 h, 8 h, 6.5 h, or 5 h of TIB for nocturnal sleep on weekdays. Three additional groups with 5 h or 6.5 h TIB were given an afternoon nap opportunity (5 h + 1 h, 5 h + 1.5 h, and 6.5 h + 1.5 h). ToT effects were quantified by performance change from the first 2 min to the last 2 min in a 10-min Psychomotor Vigilance Task administered daily.
The 9 h and the 8 h groups showed comparable ToT effects that remained at baseline levels throughout the protocol. ToT-related deficits were greater among the 5 h and the 6.5 h groups, increased prominently in the second week of sleep restriction despite partial recuperation during the intervening recovery period and diverged between these two groups from the fifth sleep-restricted night. Daytime napping attenuated ToT effects when nocturnal sleep restriction was severe (i.e. 5-h TIB/night), and held steady at baseline levels for a milder dose of nocturnal sleep restriction when total TIB across 24 h was within the age-specific recommended sleep duration (i.e. 6.5 h + 1.5 h).
Reducing TIB beyond the recommended duration significantly increases ToT-associated vigilance impairment, particularly during recurrent periods of sleep restriction. Daytime napping is effective in ameliorating such decrement.
NCT02838095, NCT03333512, and NCT04044885.
By tracking performance throughout a sustained attention task, we showed that the interactive effects of time-on-task (ToT) and recurrent partial sleep deprivation with intervening weekend recovery sleep could produce prominent ToT-associated vigilance impairment. These findings caution against the practice of such sleep patterns, particularly among individuals who constantly need to deploy their attention for prolonged periods. However, when nocturnal sleep restriction is mild and combined with an adequate dose of daytime napping, such that the total time-in-bed across 24 h is still within the age-specific recommended sleep duration, ToT effects can be sustained at well-rested levels.
Introduction
Many of the cognitive tasks that we perform on a daily basis, be it driving or attending lectures and meetings, require attention to be maintained at an optimal level for prolonged periods. However, staying vigilant during long tasks may be particularly challenging for individuals who often do not get sufficient sleep because (1) sustained attention is the cognitive domain most affected by sleep restriction [1], (2) deficits in sustained attention accumulate across nights of curtailed sleep opportunities [2–8], and (3) performance deteriorates with longer time-on-task (ToT).
The interactive effect of repeated partial sleep deprivation and ToT has thus far been addressed in only two studies in adults. Basner and Dinges reported greater ToT effects on the number of attention lapses and response speed in the Psychomotor Vigilance Task (PVT) after five nights of 4-h time-in-bed (TIB) relative to baseline [3]. Using the PVT data from adults collected by Belenky et al. [4] across one baseline night, seven manipulation nights (TIB = 3, 5, 7, or 9 h each night), and three recovery nights, Van Dongen et al. [9, 10] showed two important findings regarding the dose-response relationship between TIB and ToT effects. First, the increase in ToT-related decrement from reducing the nightly TIB at 2-h intervals was disproportionate and changed during the manipulation period. Specifically, for the first two manipulation nights, the two groups with their nightly TIB set at the maximum and the minimum age-appropriate durations (9 h and 7 h, respectively1) [11] showed limited differences in ToT. On the other hand, two nights of 5-h TIB and 3-h TIB yielded prominent increases in ToT effects, although the decrement was similar between these two groups. From the third night of manipulation, performance between the 9 h and 7 h groups, and between the 5 h and 3 h groups, began to diverge: disproportionately greater increases in ToT-related impairment were observed as nightly TIB decreased from 5 to 3 h, compared with a reduction of the same amount but from 7 to 5 h. A decrease in nightly TIB from 9 to 7 h led to the smallest increase in ToT effects. Another important finding from this study was that during the recovery sleep period, ToT effects diminished, but did not return to baseline levels after three nights of 9-h TIB, even for individuals with the mildest dose of sleep restriction to 7 h per night. This finding is alarming given the common practice of lengthening sleep on weekends as an attempt to compensate for sleep curtailment on weekdays [12–14] and suggests that performance could be worse in subsequent weeks of partial sleep deprivation.
Some recent studies have highlighted that recovery sleep between bouts of partial sleep deprivation does not fully relieve the accumulation and escalation of sustained attention deficits [15–17]. It is, thus, crucial to understand how ToT effects change across recurrent weeks of sleep restriction to different extents with intervening recovery sleep during the weekends.
Furthermore, we have previously shown that napping in the afternoon during recurrent sleep loss can benefit neurobehavioral functioning [15–17] and that napping can attenuate ToT decrement in a speed of processing task [18]. Whether the benefits of napping on ToT effects would extend to sustained attention remained to be investigated.
To address these research questions, we utilized the PVT data collected from a series of studies in which adolescents were exposed to two successive cycles of sleep opportunity manipulation (nocturnal TIB = 5, 6.5, or 8 h), with or without an afternoon nap (TIB = 1 or 1.5 h), on simulated weekdays and recovery sleep (nocturnal TIB = 9 h) on simulated weekends. A control group with a nightly 9-h TIB was also included. We hypothesized that the ToT-related decline in sustained attention would be exacerbated across the two successive periods of sleep restriction and that ToT effects would be amplified for shorter TIB beyond the age-specific recommended range, more prominently so after a few nights. We also hypothesized that napping would ameliorate ToT effects in the PVT.
Methods
Participants
Data from a total of 194 adolescent participants (98 males) between 15 and 19 years of age in the Need for Sleep studies [6, 15–17] were used in the present study. They did not report any known health conditions or sleep disorders, had a body mass index of ≤ 30 kg/m2 and a daily intake of ≤ 5 cups of caffeinated beverages, were not habitual short sleepers (actigraphically estimated average TIB of < 6 h with weekend sleep extension of ≤ 1 h), and did not travel across > 2 time zones in the month prior to the experiment.
Study protocol
The Need for Sleep study series was aimed at characterizing adolescents’ neurobehavioral functions under different sleep schedules. These protocols were conducted in a boarding school in Singapore (refer to Supplementary Materials for the details on-boarding arrangement). Details of screening have been reported previously [6]. In brief, during screening, participants’ sleep was assessed with the Pittsburgh Sleep Quality Index (PSQI [19]) and actigraphy. Their chronotype was measured with the Morningness-Eveningness Questionnaire [20], excessive daytime sleepiness with the Epworth Sleepiness Scale [21], and symptoms of chronic sleep reduction with the Chronic Sleep Reduction Questionnaire [22]. In the week prior to their stay at the boarding school, participants were required to go to bed at 23:00 and wake up at 08:00 for circadian entrainment and to minimize any impact of prior sleep restriction on cognitive performance during the study.
For the aims of the current work, comparisons involving seven groups of participants (N = 194) are reported. The 9 h group [6] (n = 26) underwent a 14-day protocol with bedtime at 23:00 and wake time at 08:00 daily (black bars in Figure 1A). The protocols for the other six groups lasted for 15 days and started with two adaptation/baseline nights of 9-h TIB (B1 and B2: 23:00–08:00), followed by two successive cycles of manipulation nights and recovery nights. The first cycle consisted of five nights of sleep opportunity manipulation (M11–M15) and ended with two nights of 9-h recovery sleep opportunity (R11–R12: 23:00–08:00), simulating a typical school week. The second cycle included three manipulation nights (M21–M23) and ended with two nights of recovery (R21–R22: 23:00–08:00). During the manipulation periods, participants from three groups had a nocturnal TIB of 5 h (5-h group: 01:00–06:00; n = 28; red bars in Figure 1A), 6.5 h (6.5-h group: 00:15–06:45; n = 29; orange bars), or 8 h (8-h group: 23:30–07:30; n = 29; blue bars), and did not have any opportunity to nap during the daytime. The remaining three groups were nap groups. Two of these groups had a nocturnal TIB of 5 h and were given either a 1-h (5 h + 1 h group; n = 29; shaded dark red bars in Figure 1B) or a 1.5-h (5 h + 1.5 h group; n = 29; solid dark red bars) nap opportunity commencing at 14:00 after each sleep restriction night. The other nap group had a nocturnal TIB of 6.5 h and a 1.5-h nap opportunity at 14:00 during the manipulation periods (6.5 h + 1.5 h group; n = 24; brown bars in Figure 1C). In all the Need for Sleep studies, the mid-points of the nocturnal sleep periods were aligned to minimize circadian phase shifting during sleep manipulation periods [5, 23].
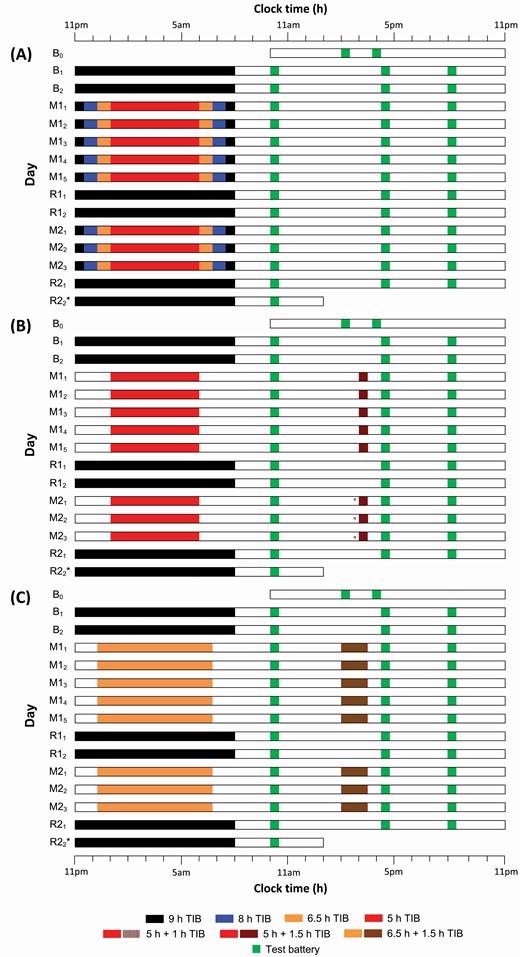
Experimental protocols. The study protocol lasted for 14 (9 h group) to 15 days (remaining groups). (A) The 9 h group maintained the same 9-h TIB (23:00–08:00; black bars) throughout the protocol (*day R22 is not applicable to the 9 h group because of its shorter protocol duration). All other groups started with two adaptation and baseline nights (B1 and B2) of 9-h TIB per night (black bars). This was followed by the first cycle of sleep manipulation for five nights (M11 to M15) and recovery sleep for two nights (R11 and R12; TIB = 9 h; black bars). The second cycle consisted of just three nights of sleep manipulation (M21 to M23) and two nights of recovery sleep (R21 and R22; black bars). During both sleep manipulation periods, participants had nocturnal TIBs of 5 h (5 h group; red bars), 6.5 h (6.5 h group; orange bars), or 8 h (8 h group; blue bars). Additionally, nap groups were given a nap opportunity starting at 14:00 following each sleep manipulation night. (B) Two nap groups had 5 h TIBs on the manipulation nights and were allowed to nap for either 1 h (5 h + 1 h group; shaded dark red bars) or 1.5 h (5 h + 1.5 h; dark red bars). (C) Another nap group had a 6.5-h TIB at night and 1.5-h nap opportunity (6.5 h + 1.5 h; brown bars) each day during the manipulation periods. A cognitive test battery (green bars) was administered daily at 10:00, 15:00–16:15, and 20:00, except during the first and last days of the protocols.
Sleep was assessed with polysomnography during selected nights in all groups, and the relevant findings have been published [16, 17, 24, 25]. To highlight the effectiveness of our manipulation, a brief summary of the TST findings is provided in Supplementary Table S1. During the baseline night (B2), the average TST of each of the seven groups was between 484 and 503 min. During the sleep manipulation periods (M11 to M15 and M21 to M23), nocturnal TST decreased from 479–491 min in the 9 h group to 431–450 min in the 8 h group, 345–371 min in the two groups with 6.5 h of nocturnal TIB, and further to 267–290 min in the three groups with 5 h of nocturnal TIB. The average TST from the 1-h nap opportunities ranged from 49 to 55 min, while that from the 1.5-h nap opportunities ranged from 71 to 79 min.
The PVT was the last task of a cognitive test battery that was administered in a classroom three times daily starting from day B1: 10:00, 15:00–16:15, and 20:00. Note that the time of the test battery in the afternoon varied across protocols and depended on the duration of the nap opportunity such that it was always administered about 45 min after the scheduled wake time of the nap groups to minimize the impact of sleep inertia. Outside of scheduled activities during the day, participants were kept under constant supervision by research staff and were prohibited from napping, consuming caffeinated food and beverages, and engaging in strenuous physical activity.
All the Need for Sleep study protocols were approved by the Institutional Review Board of the National University of Singapore and conducted according to the principles in the Declaration of Helsinki. Participants and their legal guardians provided written informed consent prior to their participation in the studies.
PVT
A 10-minute computerized PVT [26] was used. At random intervals varying from 2000 ms to 10 000 ms, a counter on the computer screen started counting. Participants were required to respond as quickly as possible by pressing a key whenever the counter started. A beeping tone was presented if no response was detected for 10 000 ms after stimulus onset. Participants wore earphones during testing sessions for tone presentations during the PVT and to minimize noise distractions. To examine ToT-related decrement in performance, for each PVT, the number of lapses (responses exceeding 500 ms) was derived for every 2-min bin. The ToT effect was quantified as the increase in this measure from the first to the fifth bin. We chose to inspect the number of lapses as our primary outcome measure as this is known to be one of the most sensitive measures to the effects of sleep loss [3, 5]. Although the bin size used for quantifying ToT-related changes in the standard 10-min PVT varied from 1 to 5 min in previous studies [3, 10, 27–30], here, we chose to use 2-min bins to ensure that the participants would have encountered a sufficient number of trials for deriving a reliable measure of the number of lapses. Secondary outcome measures of interest included median reaction time (RT) and standard deviation in RT (SD RT).
Statistical analysis
Group differences in the demographic and sleep-related measures, which were taken at the screening stage (Tables 1 and 2), were tested with independent-samples t-tests, ANOVAs, and chi-squared tests. To determine the changes in ToT-related decrement across protocol days, as well as the impact of TIB on ToT effects, the increase in the number of PVT lapses from the first to the last 2-min bin, averaged across the three PVTs each day, was tested using a mixed model (SAS 9.4; SAS Institute, Cary, NC) with day (B2 to R21) as a within-subject factor, and group (four groups: 5 h, 6.5 h, 8 h, and 9 h) as a between-subject factor. To control for group differences in baseline performance, we included the ToT effect estimated from the evening PVT on day B1 as a covariate. To examine whether an afternoon nap after each night of sleep restriction could attenuate the ToT decline, the same statistical model was used, but the group factor only involved the nap groups and the no nap groups that had the same nocturnal TIB, that is, comparison 1: 5 h, 5 h + 1 h, and 5 h + 1.5 h, and comparison 2: 6.5 h and 6.5 h + 1.5 h. Differences of least-square means estimated from the respective mixed model were used to determine significant differences between groups in daily PVT performance at p < .05. The same statistical models were applied to the median RT and SD RT data.
Sample characteristics of the 5 h, 6.5 h, 8 h, and 9 h groups measured during the screening phase
| 5 h group | 6.5 h group | 8 h group | 9 h group | ||||||
|---|---|---|---|---|---|---|---|---|---|
| Mean | SD | Mean | SD | Mean | SD | Mean | SD | p | |
| N | 28 | — | 29 | — | 29 | — | 26 | — | — |
| Age (years) | 16.91 | 1.14 | 16.58 | 1.12 | 16.18 | 0.88 | 16.81 | 1.17 | .06 |
| Gender (% male) | 57.14 | — | 51.72 | — | 48.28 | — | 42.31 | — | .74 |
| Body mass index | 20.92 | 2.77 | 21.25 | 3.46 | 20.49 | 3.08 | 20.38 | 2.55 | .68 |
| Daily caffeine intake (cups) | 0.75 | 0.91 | 0.58 | 0.80 | 0.72 | 1.00 | 0.54 | 0.79 | .77 |
| Morningness-Eveningness Questionnaire | 50.25 | 7.66 | 48.97 | 7.54 | 49.45 | 6.18 | 49.96 | 7.15 | .91 |
| Epworth Sleepiness Scale | 6.57 | 2.86 | 8.21 | 3.43 | 7.66 | 3.04 | 6.19 | 3.57 | .08 |
| Chronic Sleep Reduction Questionnaire | 34.21 | 5.07 | 35.24 | 5.96 | 36.59 | 4.04 | 33.81 | 5.13 | .18 |
| Pittsburgh Sleep Quality Index | |||||||||
| Weekday TIB (h) | 6.52 | 0.72 | 6.85 | 1.35 | 7.59 | 1.38 | 5.94 | 1.14 | <.001 |
| Weekend TIB (h) | 8.76 | 1.09 | 8.93 | 1.18 | 8.52 | 1.32 | 9.20 | 1.30 | .22 |
| Weekday TST (h) | 6.13 | 0.73 | 6.46 | 1.19 | 6.62 | 1.00 | 5.78 | 1.15 | .02 |
| Weekend TST (h) | 8.40 | 1.02 | 8.56 | 1.20 | 8.43 | 1.25 | 9.04 | 1.30 | .18 |
| Global score | 5.39 | 2.25 | 4.48 | 1.50 | 4.48 | 1.70 | 4.58 | 2.58 | .27 |
| Actigraphy | |||||||||
| Weekday TIB (h) | 6.44 | 0.99 | 7.00 | 0.77 | 7.21 | 0.74 | 6.09 | 0.85 | <.001 |
| Weekend TIB (h) | 8.15 | 0.70 | 8.45 | 1.13 | 8.36 | 1.04 | 8.45 | 1.25 | .68 |
| Weekday TST (h) | 5.69 | 0.89 | 5.51 | 0.75 | 5.73 | 0.65 | 5.37 | 0.73 | .29 |
| Weekend TST (h) | 7.23 | 0.63 | 6.76 | 1.14 | 6.65 | 0.94 | 7.53 | 1.14 | .004 |
| Average TST (h) | 6.14 | 0.64 | 5.86 | 0.68 | 5.97 | 0.58 | 5.99 | 0.62 | .47 |
| Sleep efficiency (%) | 88.51 | 4.10 | 79.02 | 5.57 | 79.45 | 6.10 | 88.45 | 4.66 | <.001 |
Because of missing data, for actigraphy, n = 26–28 for the 5 h group, n = 28–29 for the 8 h group, and n = 24 for the 9 h group.
Sample characteristics of the nap groups, and the corresponding no-nap groups with the same nocturnal sleep opportunities, measured during the screening phase
| 5 h group | 5 h + 1 h group | 5 h + 1.5 h group | 6.5 h group | 6.5 h + 1.5 h group | ||||||||
|---|---|---|---|---|---|---|---|---|---|---|---|---|
| Mean | SD | Mean | SD | Mean | SD | p | Mean | SD | Mean | SD | p | |
| N | 28 | — | 29 | — | 29 | — | 29 | — | 24 | — | ||
| Age (years) | 16.91 | 1.14 | 16.75 | 0.94 | 16.55 | 0.74 | .37 | 16.58 | 1.12 | 16.72 | 1.16 | .66 |
| Gender (% male) | 57.10 | — | 55.20 | — | 51.70 | — | .92 | 51.72 | — | 45.83 | — | .67 |
| Body Mass Index | 20.92 | 2.77 | 20.19 | 2.71 | 20.67 | 2.80 | .59 | 21.25 | 3.46 | 20.17 | 3.13 | .24 |
| Daily caffeine intake (cups) | 0.75 | 0.91 | 0.81 | 0.75 | 0.55 | 0.69 | .43 | 0.58 | 0.80 | 0.63 | 0.82 | .86 |
| Morningness-Eveningness Questionnaire | 50.25 | 7.66 | 52.62 | 7.27 | 50.72 | 7.07 | .44 | 48.97 | 7.54 | 48.83 | 6.80 | .95 |
| Epworth Sleepiness Scale | 6.57 | 2.86 | 6.52 | 2.57 | 7.86 | 3.78 | .19 | 8.21 | 3.43 | 7.42 | 3.09 | .39 |
| Chronic Sleep Reduction Questionnaire | 34.21 | 5.07 | 33.62 | 4.12 | 36.10 | 4.66 | .11 | 35.24 | 5.96 | 37.00 | 5.23 | .26 |
| Pittsburgh Sleep Quality Index | ||||||||||||
| Weekday TIB (h) | 6.52 | 0.72 | 6.50 | 0.90 | 6.78 | 0.89 | .36 | 6.85 | 1.35 | 7.36 | 1.16 | .15 |
| Weekend TIB (h) | 8.76 | 1.09 | 9.05 | 1.07 | 8.76 | 1.23 | .53 | 8.93 | 1.18 | 9.10 | 1.32 | .63 |
| Weekday TST (h) | 6.13 | 0.73 | 6.05 | 0.91 | 6.47 | 0.86 | .14 | 6.46 | 1.19 | 6.87 | 1.22 | .22 |
| Weekend TST (h) | 8.40 | 1.02 | 8.57 | 1.03 | 8.41 | 1.18 | .80 | 8.56 | 1.20 | 8.78 | 1.06 | .49 |
| Global score | 5.39 | 2.25 | 5.28 | 1.89 | 4.17 | 1.77 | .04 | 4.48 | 1.50 | 4.22 | 1.24 | .50 |
| Actigraphy | ||||||||||||
| Weekday TIB (h) | 6.44 | 0.99 | 6.20 | 1.03 | 6.84 | 1.13 | .08 | 7.00 | 0.77 | 7.22 | 0.85 | .33 |
| Weekend TIB (h) | 8.15 | 0.70 | 8.18 | 0.82 | 8.15 | 1.05 | .99 | 8.45 | 1.13 | 8.40 | 1.17 | .87 |
| Weekday TST (h) | 5.69 | 0.89 | 5.43 | 0.95 | 5.50 | 0.89 | .56 | 5.51 | 0.75 | 5.74 | 0.84 | .30 |
| Weekend TST (h) | 7.23 | 0.63 | 7.31 | 0.86 | 6.64 | 1.00 | .01 | 6.76 | 1.14 | 6.74 | 1.26 | .97 |
| Average TST (h) | 6.14 | 0.64 | 5.97 | 0.82 | 5.83 | 0.73 | .31 | 5.86 | 0.68 | 5.98 | 0.78 | .56 |
| Sleep efficiency (%) | 88.51 | 4.10 | 88.01 | 4.98 | 81.04 | 6.64 | <.001 | 79.02 | 5.57 | 79.85 | 6.87 | .63 |
Because of missing data, for actigraphy, n = 26–28 for the 5 h group.
Results
Sample characteristics
Some group differences in sleep were found at the screening stage (Table 1 and Table 2). However, among the four groups included in the analyses to determine the impact of nocturnal TIB on ToT-related decrement, most of these differences were not consistently observed in both the PSQI and actigraphy (Table 1). Importantly, the average actigraphically assessed TST did not differ across these four groups (p = .47). Similarly, this metric did not differ across the three groups that had a nocturnal TIB of 5 h during the manipulation periods (p = .31; Table 2). The two groups with a nocturnal TIB of 6.5 h in the manipulation nights did not differ in any of the parameters taken at screening (p > .15; Table 2).
ToT-related decrement during different nocturnal TIBs
For the number of PVT lapses, the group × day interaction was statistically significant (F = 2.43, p < .001), indicating that ToT effects were exacerbated with shorter TIBs (Figure 2A; left panel). The two groups with TIB within the age-specific recommended range of 8 to 10 h [11, 31] evidenced a stable ToT effect throughout the protocol (relative to baseline, 9 h group: p > 0.34; 8 h group: p > 0.30; Figure 2A; right panel), consistent with the expectation in participants with adequate nocturnal sleep. In fact, ToT effects did not differ between the 8 h and the 9 h groups throughout the protocol (p > .22). In contrast, for the two sleep-restricted groups, the ToT effect was accentuated after the second manipulation night (6.5 h group: p = .02; 5 h group: p < .001), and increased further on additional successive nights of sleep restriction. ToT did not return to baseline after two nights of recovery sleep (p < .04 relative to baseline). The ToT-effect was larger during the second sleep restriction period compared to the first for both the 6.5 h group (M11 vs. M21 and M12 vs. M22: p < .006, except for M13 vs. M23: p = .47) and the 5 h group (all three days: p < .01). Regarding between-group differences, compared with the 6.5 h group, the 5 h group showed a greater ToT-related increase in the number of lapses after the fifth night of sleep restriction (p = .04). This group difference did not persist through the first recovery period (p > .22), but became apparent again on re-exposure to sleep restriction (M22: p = .03 and M23: p = .09).

Time-on-task effects on the number of lapses in the Psychomotor Vigilance Task (PVT) as a function of nocturnal TIB and daytime napping. Left panel: The means and standard errors of the number of PVT lapses in each 2-min bin, averaged across the three tests each day, are plotted from the second baseline day (B2) to the day after the first recovery night in the second cycle (R21). Right panel: The changes from the first to the fifth bin (time-on-task effect) in the number of PVT lapses, averaged across the three tests each day, are shown. The least square means and standard errors estimated with general linear mixed models are illustrated. Shaded gray areas indicate the sleep manipulation periods (M11 to M15 and M21 to M23). (A) Data are shown for the 9 h group (black), 8 h group (blue), 6.5 h group (orange), and 5 h group (red). (B) Data are plotted for the 5 h group (red), the 5 h + 1 h group (dark red open circles with dotted line), and the 5 h + 1.5 h (dark red filled circles with solid line). ^^^p < 0.001, ^^p < 0.01, and ^p < 0.05 for significant contrasts between the 5 h group and the 5 h + 1 h group. ***p < 0.001, **p < 0.01, and *p < 0.05 for significant contrasts between the 5 h group and the 5 h + 1.5 h group. (C) Data are plotted for the 6.5 h group (orange) and the 6.5 h + 1.5 h (brown). ***p < .001, **p < .01, and *p < .05 for significant contrasts between the 6.5 h group and the 6.5 h + 1.5 h group.
A similar pattern was observed for the ToT effects on median RT (Supplementary Figure S1A) and SD RT (Supplementary Figure S2A). The group × day interaction was statistically significant for both variables (F = 2.72 and 2.29, both p < .001). Furthermore, ToT effects on these RT variables remained at baseline levels throughout the protocol for the 8 h and the 9 h groups (p > .78). In the first sleep restriction period, ToT effects were exacerbated by shorter TIB for SD RT, but not for median RT; nevertheless, ToT effects were more prominent for both measures in the second period of sleep restriction to 5 h and 6.5 h.
Impact of afternoon napping on ToT effects
For the three groups with 5-h TIB at night, there was a significant group × day interaction for the ToT effects on the number of lapses (F = 2.27, p < .001; Figure 2B; left panel). While both the 1-h and the 1.5-h nap groups exhibited less ToT-related impairment on most sleep-restricted days compared with the no nap group (Figure 2B; right panel), ToT effects were above baseline levels particularly in the second week of sleep restriction (relative to baseline, the 5 h + 1 h group on days M14, M21, M23, and R21: p < .01; the 5 h + 1.5 h group on days R11, and M22-M23: p < .03; Figure 2B). Both median RT and SD RT also showed a statistically significant group × day interaction for ToT (F = 2.42, p <.001; F = 1.59, p = .04; Supplementary Figures S1B and S2B) such that napping prominently attenuated ToT-related impairment in speed and stability in RT, particularly in the second week of sleep restriction.
For the two groups with 6.5-h TIB at night, the group × day interaction for ToT just fell short of statistical significance for the number of PVT lapses (F = 1.75, p = .06). Although ToT effects were still apparent in the 6.5 + 1.5 h group (Figure 2C; left panel), napping consistently attenuated ToT effects (Figure 2C; right panel) and, in fact, maintained it at baseline levels throughout the study (p > .26). Findings were largely the same for SD RT (F = 3.62, p < .001; Supplementary Figure S2C), while for median RT (F = 2.01, p = .03; Supplementary Figure S1C), significant benefits of napping were only observed in the second period of sleep restriction.
Discussion
Using PVT data from adolescents who were sleep-restricted to different extents, we found that consistent with previous work on adults [4, 9, 10], reducing TIB beyond the age-specific recommended duration may not immediately magnify ToT effects, but the deficits will manifest and become more prominent with more nights of sleep curtailment. Critically, the deterioration in vigilance as a result of longer ToT was exacerbated during the second week of partial sleep deprivation despite partial recovery over the preceding weekend. These findings, thus, caution against the practice of recurrent sleep restriction, particularly among individuals who need to deploy their attention for prolonged periods. Furthermore, having an afternoon nap after each night of sleep restriction was effective in slowing the incremental deficits in sustained attention as the task progressed, suggesting that napping may be an alternative for individuals who struggle to get the optimal duration of shut-eye at night.
ToT effects during different nocturnal sleep opportunities
As expected, there was a small ToT effect even when adolescents had a healthy amount of TIB for sleep. The stability of this small ToT effect demonstrated by the 8 h and 9 h TIB groups over the entire fortnight indicates the adequacy of the amount of nocturnal sleep obtained—in line with the age-specific sleep duration recommendations [11, 31], and that repeated testing was not associated with reduced motivation to perform. In contrast, when sleep opportunity was below the recommended amount, as shown by the 5 h and the 6.5 h groups, ToT effects, particularly on the number of lapses and SD RT, increased prominently during the first week of sleep restriction. These findings are consistent with the cumulative impairment in various neurobehavioral functions [2–8] and the progressive increase in ToT-related vigilance deficits [4, 9, 10] observed in previous multi-night partial sleep deprivation experiments. Furthermore, even after two recovery nights of 9-h TIB, ToT effects might stay above baseline levels, revealing a need for longer TIB and/ or more nights for recovery purposes [32]. The compounding of ToT-related vigilance impairment in the second period of sleep restriction is also consistent with incomplete physiological recovery. These findings highlight the importance of having adequate sleep consistently for maintaining attention at optimal levels over extended periods.
Sleep loss may accentuate ToT effects because they affect similar brain regions. Specifically, sleep deprivation experiments and ToT studies have separately revealed decreased activation in the dorsal attention network, which supports top-down control of attention, after sleep loss and with increasing ToT [33]. A direct comparison using data from young adults performing a selective attention task has identified an overlapping subset of task-positive regions, comprising frontal-parietal attention regions and ventral visual cortex, that are affected by both sleep deprivation and ToT [34]. Although not explicitly tested here, it is possible that these findings also reflect what occurs in the adolescent brain after multiple nights of sleep restriction.
Furthermore, the greater ToT-related decrement observed in a sleep-restricted state may be attributed to changes in both non-rapid eye movement and rapid eye movement (REM) sleep (Supplementary Table S1). Reduced N2 and REM sleep durations were found during nights of 5-h [25] and 6.5-h TIB [16]. In addition, higher slow-wave activity and shorter N2 sleep latency during the sleep restriction nights [16, 24, 25] (Supplementary Table S1) point to an elevation in homeostatic sleep pressure as a result of extended wakefulness, which could also have magnified the deficits induced by ToT in sleep-restricted individuals. It is also noteworthy that in our studies, sleep restriction was achieved by both delaying bedtimes and advancing wake times. Together with the relatively fixed timing of cognitive testing across groups (i.e. 10:00, 15:00–16:15, and 20:00), the 5 h group would have stayed awake the longest prior to each test session and thus, had the highest homeostatic sleep pressure and greatest ToT-related decrement, followed by the 6.5 h, relative to the 8 h and the 9 h groups.
Interestingly, differences between the 5 h and the 6.5 h groups in the ToT effects on vigilance became noticeable only after five nights of sleep restriction. These findings should not be taken to encourage the already sleep-restricted individuals to curtail their sleep further because of the limited increment in impairment associated with a much shorter TIB. Rather, the more rapid deterioration in performance in the second week of 5-h TIB, relative to 6.5 h, as shown by all the three PVT metrics should be emphasized.
Beneficial effects of afternoon napping on ToT effects
Consistent with our previous finding that daytime napping can attenuate ToT-related impairment in a speed of processing task among individuals exposed to multiple sleep-restricted nights [18], here, we have extended these nap benefits to a sustained attention task. Specifically, for a milder degree of nocturnal sleep restriction (i.e. 6.5 h TIB on week nights), a 1.5-h nap, that helped to bring the total TIB across 24 h (i.e. 8 h) to the recommended range, could maintain ToT-related decrement at baseline levels. This finding further supports our recent proposal that this type of split sleep schedule—a major nocturnal sleep episode and a shorter daytime nap with total TIB within the recommended duration—is a viable alternative for optimizing neurobehavioral functions among individuals who are unable to obtain sufficient sleep at night [17].
Overall, the beneficial effects of afternoon napping in reducing ToT-related impairment during recurrent partial sleep deprivation could be attributed to the dissipation of homeostatic sleep pressure during the nap opportunity as shown by reduced slow wave activity and longer N2 latency in the subsequent nocturnal sleep episodes [16, 17, 25] (Supplementary Table S1).
Limitations and future studies
Our study had a few limitations. First, three 10-min PVTs were administered each day with the last one at 20:00. In real life, however, attention often needs to be sustained beyond a 10-min period and at night (e.g. long-distance driving, surgical operations, and radar monitoring). Second, real-world sleep behavior is more variable: TIB may vary across weeknights and across weekend nights; recovery sleep may occur mid-week, and be longer than was allowed in the present study. The impact of various sleep schedules on ToT effects can be investigated using a combination of wearables and mobile phone applications in the future [35]. Also, future studies should address the potentially greater ToT-related decrement with longer and perhaps more ecologically relevant tasks, as well as during the biological night, among sleep-restricted individuals. Moreover, future studies should examine whether our findings from adolescents can be generalized to other age groups. Relative to young adults, older adults’ sustained attention performance is less affected by total sleep deprivation [36]. Establishing whether certain age groups are more susceptible to ToT-related decrement in a sleep-restricted/sleep-deprived state may provide insights on shift planning in occupational settings, and reduce accidents and other undesirable outcomes. Overall, more work is required to understand the complex dynamics of sleep restriction and recovery over multiple cycles of sleep restriction. Finally, the relative utility or sensitivity of PVT ToT metrics as compared to the more conventional ones should be systematically addressed in future sleep deprivation studies.
Conclusion
When attention needs to be sustained for prolonged durations, one needs to sleep the recommended duration at night to minimize the influence of ToT on daytime performance. Performance deteriorated faster as a result of longer ToT in the second week of sleep restriction relative to the first, even with two intervening nights of recovery sleep. The deficits in sustained attention were particularly alarming during recurrent and severe nocturnal sleep restriction. An afternoon nap opportunity of 1 to 1.5 h after each night of sleep restriction could effectively reduce the ToT-related decrement. Notably, in the case of recurrent mild nocturnal sleep restriction, a split sleep schedule, consisting of a major sleep episode at night and a nap opportunity during the daytime with a total TIB within recommended range, could keep impairment induced by ToT at baseline levels, and hence, is an alternative route to optimal performance for individuals who struggle to obtain sufficient sleep at night.
Footnotes
The amount of sleep recommended by the National Sleep Foundation varies across age groups. Adults—the age group used in Ref. [4]—are recommended to sleep between 7 and 9 h each day, while the recommended sleep duration for adolescents—the age group used in the present study—is between 8 and 10 h.
Acknowledgments
We are grateful for all the research staff involved in the Need for Sleep study series for their effort in data collection and processing.
Funding
The Need for Sleep studies were supported by the National Medical Research Council, Singapore (NMRC/STaR/0004/2008 and NMRC/STaR/015/2013), the National Research Foundation (NRF2016-SOL002-001), and the Far East Organization.
Disclosure Statement
None declared.
References


Comments