


Abstract
Sleep restriction therapy (SRT) effectively treats insomnia but mechanisms are poorly understood. Theoretical models suggest that potentiation of sleep pressure and reduction of arousal are key mechanisms of action. To our knowledge, this has never been directly tested. We designed a randomized controlled trial with embedded mechanistic measurement to investigate if SRT causally modifies multidimensional assessments of sleep pressure and arousal.
Participants aged 25–55 who met DSM-5 diagnostic criteria for insomnia disorder were randomized to four weeks of SRT or time in bed regularization (TBR), a control intervention that involves prescription of a regular but not reduced time in bed. Sleep pressure was assessed through daily diary appraisal of morning and evening sleepiness, weekly Epworth sleepiness scale (ESS) scores, psychomotor vigilance, and non-rapid eye movement (NREM) delta power (0.75–4.5 Hz) from ambulatory polysomnographic recordings. Arousal was assessed through daily diary appraisal of cognitive arousal, the pre-sleep arousal scale (PSAS), and NREM beta power (15–32 Hz). Outcomes were assessed at baseline (2-week period prior to randomization), during the intervention phase (1–4 weeks post-randomization), and at 12-week follow-up. We performed intention-to-treat analyses using linear mixed models. For continuous daily measures, the treatment period was split into early (weeks 1–2) and late (weeks 3–4) treatment.
Fifty-six participants (39 females, mean age = 40.78 ± 9.08) were assigned to SRT (n = 27) or TBR (n = 29). The SRT group showed enhanced sleep pressure relative to TBR, reflected in (1) enhanced sleepiness in the evening during early (d = 1.17) and late treatment (d = 0.92), and in the morning during early treatment (d = 0.47); (2) higher daytime sleepiness on the ESS at weeks-1 and -2 (d = 0.54, d = 0.45); and (3) reduced psychomotor vigilance at week-1 (d = 0.34). The SRT group also showed reduced arousal relative to TBR, reflected in lower levels of daily-monitored cognitive arousal during early treatment (d = 0.53) and decreased PSAS total score at week-4 and week-12 (ds ≥ 0.39). Power spectral analysis of all night NREM sleep revealed an increase in relative, but not absolute, EEG delta power at week-1 and week-4 (ds ≥ 0.52) and a decrease of relative EEG beta power at week-4 (d = 0.11).
For the first time, we show that SRT increases sleep pressure and decreases arousal during acute implementation, providing support for mechanism-of-action.
Insomnia can be effectively treated with cognitive behavioral therapy (CBT) but understanding of mechanism-of-action is limited. In the present study, we tested whether sleep restriction therapy, a key component of CBT, potentiates sleep pressure and reduces arousal in the context of a randomized controlled trial. Prior to randomization and throughout the 4-week treatment period we assessed sleep pressure and arousal through questionnaire (daily and weekly), task performance, and sleep physiology. Compared to a rigorously matched control group, we show that sleep restriction therapy increases sleep pressure and reduces arousal, providing support for mechanism-of-action.
Introduction
There is a theory-practice gap in the mechanistic understanding of psychological treatments [1–4]. The recommended treatment for insomnia is a combination of cognitive and behavioral strategies that are implemented under the guidance of a therapist (cognitive behavioral therapy [CBT]) [5]. While CBT treats insomnia [6, 7], there has been little empirical testing of its key mechanisms, with the highest level of evidence principally coming from secondary analyses of randomized trials of multicomponent CBT [8, 9]. Although promising, these studies were not adequately designed with mechanisms in mind, and explanatory power is hindered by the presence of multiple therapeutic components; whose interactions are not well understood. One way to bridge this gap is to dismantle multicomponent treatment packages and prospectively investigate constituent parts in dedicated trials [10].
Sleep restriction therapy (SRT) is assumed to be one of the most effective therapies for insomnia [11–13]. Like other evidence-based CBT components, SRT is based upon a theoretical model [14]. This model postulates that extension of time in bed maintains symptoms of insomnia, and therefore sleep opportunity should be curtailed to better match sleep need [14]. The seminal paper, as well as subsequent theoretical accounts, suggest that restricted sleep opportunity results in mild sleep loss which in turn strengthens homeostatic sleep pressure, reduces arousal, and ultimately consolidates sleep, leading to clinical improvement [14–16]. While several studies show that SRT improves insomnia and sleep outcomes [17–19], a recent review by our team found only preliminary evidence for the proposed pathways [16]; with mechanistic research being limited to single-arm studies comprising small sample sizes (n ≤ 16) [20–24].
In line with recent calls to conduct mechanistically grounded research in psychotherapy [25], we specifically designed the present study to test whether SRT works according to its proposed pathways. First, to isolate the key therapeutic ingredient of time in bed restriction, we compared SRT with a dismantled control intervention that prescribes a regular, but not restricted, sleep opportunity (time in bed regularization [TBR]). Consistent with the dismantling tradition [26], interventions were matched for non-specific treatment effects, including therapist time and daily monitoring of sleep. Second, we followed the framework of the Research Domain Criteria (RDoC) [27] and measured key mechanisms—sleep pressure and arousal—across multiple levels of analysis, spanning cognitive (self-report), behavioral (performance testing), and physiological (sleep EEG) domains. Third, we focused on the acute treatment phase, when changes in therapeutic mechanisms are typically expected [28], and implemented high-resolution measurements (daily and weekly assessments).
We have previously reported on the clinical efficacy of SRT versus TBR for insomnia severity (d > 1.36) and sleep continuity variables (d range = 0.40–0.92) [29]. This enables us to now confidently appraise our secondary outcomes—the proposed mechanistic measures. In this paper, we report on the following a priori mechanistic hypotheses.
Compared to control, participants in the SRT arm will:
report increased sleepiness during treatment, indexed by daily diary measurement and weekly questionnaire assessment
display reductions in psychomotor vigilance, assessed with the psychomotor vigilance task
show potentiation of homeostatic sleep pressure, indexed by rapid eye movement (NREM) delta activity from polysomnographic recordings, and
report decreased pre-sleep cognitive arousal during and at the end of treatment, indexed by daily diary measurement and questionnaire assessment.
In line with the hypotheses above, we also aimed to test the following exploratory hypotheses: compared to the control group, participants in the SRT arm will (5) show diminished cortical arousal during sleep, indexed by NREM beta activity from polysomnographic recordings, and (6) report reduced somatic arousal.
Methods
Study design and participants
This was a parallel, randomized, controlled, mechanistic evaluation of SRT versus TBR. Time points and variables were derived from theory (see Ref. [16]) and purposely selected to measure mechanisms across different levels of explanation. In brief, 56 participants (39 females, mean age = 40.78 ± 9.08) meeting criteria for DSM-5 chronic insomnia disorder (assessed by the Sleep condition indicator [30] and telephone interview) were assigned to 4 weeks of SRT (n = 27) or TBR (n = 29) after completing a baseline phase of 2 weeks. Exclusion criteria included psychiatric diagnoses other than insomnia, anxiety/depression “caseness,” current alcohol misuse, additional sleep disorders other than insomnia, current prescription of medication or psychotherapy for sleep, shift work, pregnancy, sleep-disruptive medical comorbidity, or conditions contraindicated for potential sleep deprivation, and not living in the area of Oxford. Detailed methodology, including study criteria, recruitment, study procedures, and study flow has previously been published [29]. The study was conducted in Oxfordshire, UK, approved by the Central University Research Ethics Committee of the University of Oxford (CUREC R51331/RE005), and registered with ISRCTN (ISRCTN10974094). All participants were recruited between July 2017 and January 2019 in Oxford (UK) and were reimbursed £80 for their time.
Interventions
Both intervention arms were delivered across four, weekly 1:1 sessions. During session 1 (approximately 60 min, face to face), treatment rationale and standard sleep hygiene advice were introduced, and bed and rise-times were selected according to treatment specific criteria (see details in Maurer et al. [29]). In the SRT group, participants were prescribed a sleep window that matched their average self-reported sleep time for the previous two weeks with a minimum TIB of 5 h. In the TBR group, participants were prescribed a sleep window that matched their average self-reported TIB for the previous two weeks. Sessions 2–4 (15 min each) served to review adherence, side-effects, and problems with implementation, and to adjust the sleep window (for SRT group only) according to standard sleep efficiency guidelines [14]. Diaries and sleep efficiency grids were used throughout the 4-week intervention period to calculate and track sleep efficiency in the SRT group. Similarly, participants in the TBR group were introduced to a bed-time consistency checklist, where they were asked to check each day if their bed and rise-time was within 10 min of the agreed sleep window. Importantly, both groups were informed about potential side effects that might occur during the acute treatment phase, including increased daytime sleepiness.
Measures
Figure 1 summarizes all measures at all time points implemented throughout the study period (2 weeks of baseline, 4 weeks of treatment, and follow-up at 12-weeks post-randomization).
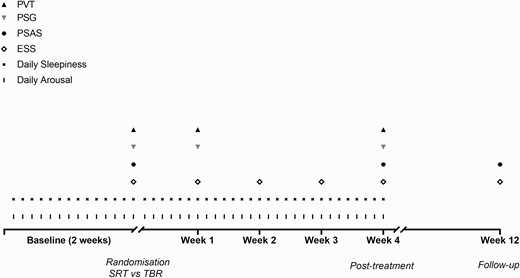
Schematic study protocol. PVT, psychomotor vigilance task; PSG, polysomnography; PSAS, pre-sleep arousal scale; ESS, Epworth sleepiness scale. Participants completed baseline measures (daily sleepiness and arousal) for 2 weeks. At the end of this 2-week period an overnight assessment was conducted at the participant’s home. During the home visit, the participant performed a PVT, completed baseline questionnaires (ESS/PSAS), and was set up for ambulatory PSG. Upon completion of the baseline phase, participants were randomized to sleep restriction therapy (SRT) or time in bed regularization (TBR). Both interventions were implemented for four continuous weeks, and daily measurements of sleepiness and arousal continued. Further overnight assessments took place at week-1 and week-4 after randomization following the same protocol and timing as previously. At week-2 and week-3 after randomization, participants in both groups were called to help with treatment implementation and to assess daytime sleepiness (via the ESS). Participants were contacted again at 12-weeks post-randomization to complete an online follow-up questionnaire which included the PSAS and the ESS.
2. Self-reported and behavioral markers of sleep pressure
Daytime sleepiness
The Epworth sleepiness scale (ESS) is a self-administered questionnaire that assesses daytime sleepiness [31]. Participants are asked to rate on a scale from 0 to 3 how likely they are to doze off or fall asleep in eight different scenarios (referring to the past 7 days). The sum score ranges from 0 to 24. The ESS was administered at baseline, weekly during treatment weeks 1–4 (paper version at weeks 1 and 4; by phone at weeks 2 and 3) and at 12-weeks follow-up (via online questionnaire).
Vigilance
The Psychomotor vigilance task (PVT) is a cognitive task that was developed to assess behavioral alertness and to track changes induced by the interaction of homeostatic sleep drive and the circadian rhythm [32]. The PVT is frequently used to assess vigilance in the insomnia population [33] and to assess the effects of sleep restriction [34]. The PVT is sensitive to experimentally induced changes in sleep pressure [32]. Participants are instructed to respond as quickly as possible to the presence of a red asterisk, located in the center of the computer screen, with a left laptop mouse button click. Interval onset for asterisks varied between 1 and 10 s across 110 experimental trials. Participants completed five practice trials at the beginning of each session and the task lasts for approximately 12 min. The task was performed at the same time in the evening (approximately 1 h before habitual bedtime calculated at baseline) across measures at baseline, treatment week-1, and -4. Data from the PVT were extracted and checked for valid responses. Responses < 200 ms were excluded and responses ≥ 500 ms were considered as attentional lapses [35].
Daily monitoring of state sleepiness
Sleepiness was monitored twice per day, in the morning and in the evening. The question: “Right now: How sleepy do you feel?” (from the Daytime insomnia symptom scale [36]) was integrated into the morning and evening version of the sleep diary and was answered on a visual analog scale from 0 to 100. Participants were instructed to complete the sleep diary each day for 14 days during baseline and 28 days during the active treatment phase.
Self-reported markers of arousal
Pre-sleep arousal
The Pre-sleep arousal scale (PSAS) is a 16-item self-report questionnaire categorized into cognitive and somatic subscales (each 8 items) [37]. Each item is scored between 1 and 5 (1 = not at all, 5 = extremely) and the sum score for each subscale ranges from 8 to 40 with higher scores indicating higher arousal. The PSAS shows good internal consistency for both subscales in the insomnia population (α ≥ 0.72) [37]. The weekly version of the PSAS was administered at baseline, at the end of treatment (week 4), and follow-up (week 12), referring to pre-sleep arousal experienced in the previous week. We investigated total PSAS score and the respective sub-scale scores.
Daily monitoring of pre-sleep cognitive arousal
Five items from the cognitive pre-sleep arousal subscale [38] (item 10, 12, 13, 14, and 15) were included in the morning version of the sleep diary. Participants were instructed to give each item a score from 1 to 5 (1 = not at all; 5 = extremely) with reference to the previous night. A sum score was calculated with a possible range from 5 to 25. Participants were instructed to complete the measure for 14 days during the baseline and 28 days during the active treatment phase.
3. Sleep physiology
PSG acquisition and scoring
Objective sleep was recorded with the portable PSG system, SOMNO HD (Somnomedics GmbH, Germany) in participants’ homes. Set-up and recording were conducted according to the recommended montage of the American Academy of Sleep Medicine (AASM) [39]. This included six scalp electrodes (F3, F4, C3, C4, O3, and O4), one ground electrode (forehead), one scalp reference electrode (CZ), and two reference electrodes placed on each mastoid process (A1, A2). Signals were sampled at 256 Hz and filtered with a high pass filter at 0.2 Hz and a low pass filter at 35 Hz. Recordings were blinded and scored according to AASM 2017 guidelines [40]. Reliability of sleep scoring was confirmed by an experienced scorer, who double-scored 10% of all recordings (agreement = 91.5%). Artifacts were identified visually and removed.
Sleep architecture
To provide context in terms of change in sleep structure, we extracted variables for the macrostructure of sleep, that is, the time spent in the different stages of sleep (stage 1/N1, stage 2/N2, stage 3/N3, and rapid eye movement [REM]), and performed exploratory group analyses. In addition to sleep stages, we also extracted slow wave sleep latency (SWS-L; latency to the first epoch of stage 3) as an additional proxy for sleep pressure [41, 42].
Power spectral analysis
For power spectral analysis (PSA), EEG-signals were re-referenced to the contra-lateral mastoid (A1, A2). Raw C3-A2 derivations were exported into Matlab (Matlab R2017a, MathWorks, Natick, USA). If the C3-A2 derivation was not of sufficient signal quality (e.g. high impedance), the C4-A1 derivation was exported instead (25% of total number of nights; SRT: nights = 29; TBR: nights = 13). Artefact-free N2 and N3 30 s-epochs were pre-processed using the FieldTrip toolbox [43] and filtered at 0.3 and 35 Hz. EEG power density was calculated based on spectral analysis performed with an FFT (Welch’s method [44] with a 4 s hanning window with 50% overlap). For each 4-s N2 or N3 sleep segment of artifact-free EEG, a PSD frequency profile was obtained with 0.25 Hz resolution. These 4-s PSD profiles were then averaged over time and frequency (Delta = 0.75–4.5 Hz, Theta = 4.5–8.0 Hz, Alpha = 8.0–12.0 Hz, Sigma = 12.0–15.0 Hz, Beta = 15.0–32.0 Hz) resulting in absolute power bands. A minimum threshold of 0.75 Hz was chosen to exclude potential sweat artifacts.
Two analysis approaches were taken to account for variable sleep length across time points and groups. First, relative power bands were computed by dividing the power in each band by the sum of the power across all bands (see Refs. [45, 46]). Primary outcome variables were relative NREM delta and beta bands; however, remaining frequency bands and corresponding absolute values are presented to provide a full profile. Number of artifact-free epochs that were included in the analysis of relative values across group and time points were compared to test for differences in the amount of provided data. Second, we compared average absolute delta and beta activity derived from the maximal number of artifact-free NREM sleep (N2/N3) epochs common to all nights and all participants (see Ref. [47]), reflecting 369 epochs (approximately 3.08 h). Again, remaining frequency bands are presented to provide a full profile.
Statistical analyses
Consistent with CONSORT guidelines on the reporting of RCTs [48], all data from all randomized participants were analyzed using the intention to treat principle [49]. Statistical analysis was conducted in SPSS.25 (IBM). Linear mixed-effects regression models were fitted for all outcomes with fixed effects of group and time point. Time point was entered as a repeated variable and participant was added as a random effect. The covariance structure was set to unstructured, as it revealed the best model fit across outcomes. Baseline values were added as covariate. An interaction between time point and randomized group was included to estimate treatment effects separately at each time point. For vigilance (PVT) and measures of sleep (sleep architecture variables/EEG-frequency bands), outcomes at 1- and 4-weeks were defined as the response; for pre-sleep arousal (PSAS subscales and total score), outcomes at 4- and 12-weeks were defined as the response; for daytime sleepiness (ESS), outcomes at 1-, 2-, 3-, 4-, and 12-weeks were defined as the response; and for daily monitored arousal and state sleepiness, responses were entered as averages of weeks 1–2 (early treatment) and weeks 3–4 (late treatment) to conduct like-for-like comparison with the 2-week baseline period, and to enable adjustment of baseline values as a covariate. Cohen’s d statistics were calculated as the adjusted treatment effect divided by the baseline standard deviation of the outcome for the combined treatment groups [50]. Unadjusted means and SDs are also reported.
Results
Baseline characteristics and intervention adherence
As reported previously [29], the sample had a mean age of 40.78 ± 9.19 years (range 26–55), comprised of females (70%), and was university-educated (79%). Consistent with inclusion criteria, ISI scores were in the clinical range (mean = 14.90 ± 3.21). Our manipulation check (previously reported) revealed that participants adhered to the intervention as indexed by large group differences for self-reported and actigraphy-derived TIB (ds > 1.63). Across the 4 weeks of intervention, participants in the SRT group spent on average 71.87 min (diary defined) and 63.00 min (actigraphy-defined) less time in bed per night when compared to TBR; resulting in an average reduction of TST of 33.10 min (diary-defined) and 44.72 min (actigraphy-defined) per night, when compared to TBR. Thus, the average total sleep debt accumulated over the 4-week period can be estimated at −15.44 h (diary-defined) and −20.87 hrs (actigraphy-defined).
Self-reported and behavioral markers of sleep pressure
Daily monitored state sleepiness
Analysis from daily self-reported sleepiness revealed group differences in the morning and evening, with the SRT group reporting higher levels during the acute phase of treatment when compared to TBR (see Table 1). Medium-to-large effect sizes were observed during early treatment for morning (p = .010, d = 0.47) and evening sleepiness (p = .001, d = 1.17). During late treatment, there were no significant group differences for sleepiness in the morning (p = .254) while sleepiness in the evening remained elevated in the SRT group (p = .003, d = 0.92; see Figure 2).
Effects of SRT versus TBR on measures of self-reported sleepiness and vigilance
| SRT | TBR | |||||||||||
|---|---|---|---|---|---|---|---|---|---|---|---|---|
| M | SD | n | M | SD | n | Diffadj | 95% CI | P | ES | |||
| State | Baseline | 58.85 | 14.27 | 27 | 58.72 | 16.28 | 29 | |||||
| sleepiness | Early treatment | 70.12 | 19.08 | 26 | 62.24 | 16.35 | 29 | 7.09 | 1.77 | 12.41 | .010 | 0.47 |
| morning | Late treatment | 65.26 | 21.50 | 26 | 60.90 | 19.07 | 29 | 3.57 | −2.64 | 9.77 | .254 | 0.23 |
| State | Baseline | 75.05 | 11.35 | 27 | 72.45 | 9.82 | 29 | |||||
| sleepiness | Early treatment | 83.20 | 11.98 | 26 | 70.80 | 14.07 | 29 | 12.39 | 5.28 | 19.51 | .001 | 1.17 |
| evening | Late treatment | 81.33 | 10.48 | 26 | 71.60 | 12.70 | 29 | 9.73 | 3.39 | 16.07 | .003 | 0.92 |
| ESS | Baseline | 6.19 | 4.39 | 27 | 6.52 | 4.29 | 29 | |||||
| Week-1 | 8.69 | 5.60 | 26 | 6.69 | 4.73 | 29 | 2.32 | 0.02 | 4.47 | .034 | 0.54 | |
| Week-2 | 7.27 | 4.81 | 26 | 5.66 | 3.55 | 29 | 1.93 | −0.04 | 3.91 | .055 | 0.45 | |
| Week-3 | 6.33 | 4.51 | 24 | 5.89 | 4.37 | 28 | 0.21 | −1.86 | 2.28 | .839 | 0.05 | |
| Week-4 | 7.12 | 5.26 | 26 | 6.17 | 4.38 | 29 | 1.26 | −0.80 | 3.33 | .225 | 0.29 | |
| Week-12 | 3.58 | 2.39 | 26 | 5.76 | 3.95 | 29 | −1.86 | −3.31 | −0.42 | .013 | −0.43 | |
| PVT-RT | Baseline | 374.61 | 40.18 | 27 | 376.62 | 48.95 | 29 | |||||
| Week-1 | 391.70 | 37.62 | 24 | 377.49 | 38.90 | 25 | 15.32 | 0.25 | 30.38 | .046 | 0.34 | |
| Week-4 | 397.34 | 38.43 | 23 | 379.92 | 39.74 | 23 | 15.39 | −1.90 | 32.68 | .080 | 0.35 | |
| PVT-lapses ≥ 500 ms | Baseline | 9.04 | 7.20 | 27 | 8.38 | 8.72 | 29 | |||||
| Week-1 | 10.04 | 7.75 | 24 | 7.72 | 6.11 | 25 | 1.99 | −1.16 | 5.14 | .210 | 0.25 | |
| Week-4 | 12.48 | 8.16 | 23 | 8.57 | 7.27 | 23 | 3.07 | −0.93 | 7.06 | .129 | 0.39 | |
SRT, sleep restriction therapy;TBR, time in bed regularization; ESS, Epworth sleepiness scale; RT, reaction times; Diffadj, adjusted mean difference derived from linear mixed model; 95% CI, 95% confidence interval of the adjusted mean difference; ES, effect size (Cohen’s d).
Significant P values are displayed in bold. M and SD refer to unadjusted means and standard deviations.
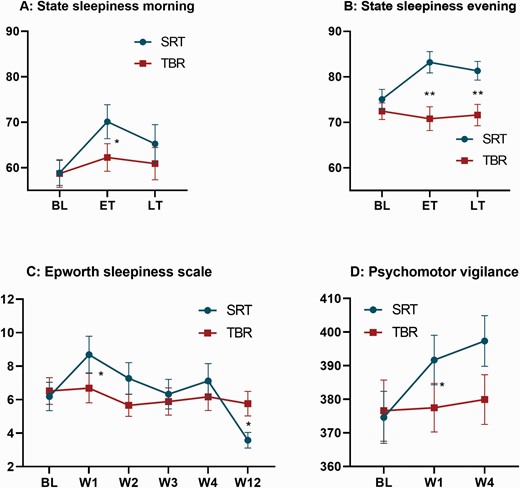
Measures of sleep pressure across groups and time points. All graphs display raw means and standard errors across groups (blue = SRT; red = TBR) and time points. The graphs on the top show results for daily measured sleepiness in the morning (A) and evening (B). Sleepiness was measured on a visual analog scale from 0 to 100 and averaged across 2 weeks of baseline (BL), early treatment (ET, weeks 1–2), and late treatment (LT, weeks 3–4). (C, bottom left) displays results from the Epworth sleepiness scale (range = 0–24), which was obtained at BL, week 1–4 (W1-4), and week-12 (W12). (D, bottom right) displays reaction times derived from the psychomotor vigilance task at BL, week-1 (W1), and week-4 (W4). Adjusted mean differences between groups are derived from linear mixed models and significance is represented by a single (* = p < .05) or double asterisk (** = p < .01).
Epworth sleepiness scale
For weekly reporting of daytime sleepiness, we found medium effect size differences at week-1 (p = .034, d = 0.54) and week-2 (p = .055, d = 0.45), with participants in the SRT group reporting more daytime sleepiness (see Table 1). Between-group comparisons at follow-up revealed a treatment effect in the opposite direction, such that participants in the SRT group reported less daytime sleepiness at 12-weeks post-randomization relative to control (p = .013, d = −0.43).
Vigilance
Vigilance was indexed by reaction times (RTs) and attentional lapses derived from the PVT at baseline, week-1, and week-4. Due to task failure, 9% of all PVT measurements were lost, leaving 151 out of 166 records for analysis [six records were missing at week-1 (SRT = 2, TBR = 4), and nine records were missing at week-4 (SRT = 3, TBR = 6)]. Between-group comparisons of RTs revealed slower responses for participants in the SRT group at week-1 (p = .046, d = 0.34). Effects at week-4 were in the same direction and of similar magnitude (d = 0.35) but did not reach statistical significance (p = 0.080; see Figure 2). No significant group-differences were found for attentional lapses at week-1 (p = .210) or week-4 (p = .129), though mean values suggested increased lapses in the SRT group at week 4 (dweek-4 = 0.39; see Table 1).
Self-reported markers of arousal
Daily monitored pre-sleep arousal
Analysis of daily self-reported pre-sleep cognitive arousal revealed a medium effect size during early treatment (p = .027, d = −0.53), with participants in the SRT group experiencing less pre-sleep arousal when compared to TBR (see Table 2 and Figure 3). Results at late treatment were in the same direction and of medium size (d = −0.39) but did not reach statistical significance (p = .099).
Effects of SRT versus TBR on subjective arousal measures
| SRT (27) | TBR (29) | ||||||||||
|---|---|---|---|---|---|---|---|---|---|---|---|
| M | SD | n | M | SD | n | Diffadj | 95% CI | P | ES | ||
| Sum score of daily cognitive arousal measurement | |||||||||||
| Baseline | 10.73 | 1.92 | 27 | 10.25 | 2.85 | 29 | |||||
| Early treatment | 9.11 | 2.38 | 26 | 9.99 | 2.96 | 29 | −.27 | −2.39 | −0.15 | .027 | −0.53 |
| Late treatment | 9.10 | 2.67 | 26 | 9.65 | 2.97 | 29 | −0.93 | −2.05 | 0.18 | .099 | −0.39 |
| Somatic arousal (PSAS-S) | |||||||||||
| Baseline | 11.26 | 3.47 | 27 | 10.24 | 2.71 | 29 | |||||
| Week-4 | 10.20 | 2.55 | 25 | 10.07 | 2.22 | 29 | −0.27 | −1.37 | 0.84 | .632 | −0.09 |
| Week-12 | 9.46 | 2.70 | 26 | 9.76 | 2.32 | 29 | −0.67 | −1.86 | 0.51 | .260 | −0.22 |
| Cognitive arousal (PSAS-C) | |||||||||||
| Baseline | 20.93 | 6.08 | 27 | 19.52 | 6.31 | 29 | |||||
| Week-4 | 15.31 | 4.99 | 26 | 16.97 | 6.57 | 29 | −2.24 | −4.46 | 0.18 | .069 | −0.36 |
| Week-12 | 11.65 | 4.31 | 26 | 14.03 | 4.10 | 29 | −2.96 | −5.07 | −0.86 | .007 | −0.48 |
| Overall arousal (PSAS-sum) | |||||||||||
| Baseline | 32.19 | 7.82 | 27 | 29.76 | 7.25 | 29 | |||||
| Week-4 | 25.52 | 6.20 | 25 | 27.03 | 7.68 | 29 | −2.92 | −5.72 | −0.12 | .041 | −0.39 |
| Week-12 | 21.12 | 6.41 | 26 | 23.79 | 5.72 | 29 | −3.89 | −6.74 | −1.03 | .009 | −0.52 |
SRT, sleep restriction therapy; TBR, time in bed regularization; PSAS-S, somatic subscale of the pre-sleep arousal scale; PSAS-C, cognitive subscale of the pre-sleep arousal scale; Diffadj, adjusted mean difference derived from linear mixed model; 95% CI, 95% confidence interval of the adjusted mean difference; ES, effect size (Cohen’s d).
Significant P-values are displayed in bold.
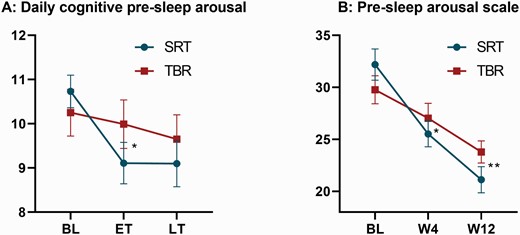
Measures of pre-sleep arousal. Both graphs display raw means and standard errors across groups (blue = SRT; red = TBR) and time points. (A) Summarizes changes in daily measured cognitive pre-sleep arousal (range 5–25) averaged across 2 weeks of baseline (BL), early treatment (ET), and late treatment (LT). (B) Shows the differences for the full Pre-sleep arousal scale at BL, week-4 (W4), and week-12 (W12). Adjusted mean differences between groups are derived from linear mixed models and significance is represented by a single asterisk (* = p < .05) or double asterisk (** = p < .01).
Pre-sleep arousal scale
Between-group comparisons for the total PSAS score showed medium effect sizes at week-4 (p = .041, d = −0.39) and week-12 (p = .009, d = −0.52) in favor of the SRT group. For the cognitive sub-scale, group effects of medium size and in favour of SRT were detected at week-12 (p = .007, d = −0.48), but failed to reach significance at week-4 (p = .069, d = −0.36). No differences were found for the somatic arousal sub-scale at either time point (ps > .260).
Sleep physiology
Sleep architecture
An overview of changes in sleep architecture can be found in Table 3. Exploratory analysis was conducted on absolute time spent in each sleep stage (minutes) to test the effects of group on sleep architecture across time points. We have previously reported [29] that the SRT group had shorter TST at week-1 (p < .001, d = −1.01), but not at week-4 (p = .129) when compared to TBR. Here we show that this loss of sleep chiefly manifests in less time in N1 (p < .001, d = −0.83) and N2 sleep (p < .001, d = −0.94) at week-1. These effects were not maintained at week-4 (N1: p = .150; N2: p = .122). Absolute time spent in REM sleep and N3 sleep did not differ between groups at week-1 (REM: p = .972; N3: p = .329) or at week-4 (REM: p = 0.790; N3: p = .943). Relative values (%) are also presented (see Supplementary Table S1). Group-comparisons of SWS-L revealed large reductions at week-1 (p = .012, d = −0.79) in SRT versus control, but not at week-4 (p = .130).
Polysomnography-derived variables of sleep architecture
| SRT | TBR | |||||||||||
|---|---|---|---|---|---|---|---|---|---|---|---|---|
| M | SD | n | M | SD | n | Diffadj | 95% CI | P | ES | |||
| N1 | BL | 34.32 | 20.54 | 27 | 42.23 | 26.46 | 28 | |||||
| W1 | 20.83 | 11.03 | 26 | 43.82 | 28.45 | 28 | −19.51 | −29.82 | −9.20 | <.001 | −0.83 | |
| W4 | 28.75 | 14.00 | 26 | 39.69 | 26.77 | 29 | −7.30 | −17.32 | 2.73 | .150 | −0.31 | |
| N2 | BL | 203.80 | 38.09 | 27 | 208.80 | 47.60 | 28 | |||||
| W1 | 173.52 | 31.18 | 26 | 217.50 | 40.04 | 28 | −40.27 | −58.92 | −21.63 | <.001 | −0.94 | |
| W4 | 191.25 | 39.85 | 26 | 208.14 | 41.79 | 29 | −16.96 | −38.62 | 4.70 | .122 | −0.40 | |
| N3 | BL | 77.46 | 30.06 | 27 | 67.63 | 28.99 | 28 | |||||
| W1 | 85.98 | 29.84 | 26 | 70.55 | 43.94 | 28 | 7.22 | −7.49 | 21.93 | .329 | 0.24 | |
| W4 | 79.44 | 33.07 | 26 | 70.48 | 42.48 | 29 | 0.53 | −14.17 | 15.22 | .943 | 0.01 | |
| REM | BL | 98.32 | 24.69 | 27 | 101.71 | 28.64 | 28 | |||||
| W1 | 92.10 | 22.41 | 26 | 93.84 | 20.11 | 28 | 0.20 | −11.41 | 11.81 | .972 | 0.01 | |
| W4 | 95.24 | 24.31 | 26 | 96.83 | 29.82 | 29 | 1.77 | −11.49 | 15.02 | .790 | 0.07 | |
| SWS-L (min) | BL | 27.87 | 17.26 | 27 | 26.58 | 12.25 | 29 | |||||
| W1 | 20.14 | 9.56 | 26 | 31.79 | 21.06 | 29 | −11.68 | −20.71 | −2.646 | .012 | −0.79 | |
| W4 | 26.95 | 10.26 | 26 | 32.987 | 16.93 | 29 | −5.924 | −13.65 | 1.801 | .130 | −0.40 | |
N1, stage 1 sleep; N2, stage 2 sleep; N3, stage 3 sleep; REM, rapid eye movement; SWS-L, slow wave sleep latency; BL, baseline; W1, week-1; W4, week-4; Diffadj, adjusted mean difference derived from linear mixed model; 95% CI, 95% confidence interval of the adjusted mean difference; ES, effect size (Cohen’s d).
Significant P-values are displayed in bold.
Power spectral analysis
The number of artefact-free NREM epochs that were included in the primary analysis (of relative values) differed between groups at week-1 (SRT = 507.73, TBR = 559.11; Diffadj = −50.29, p = .005) but not at week-4 (SRT = 527.73, TBR = 542.69; Diffadj = −19.84, p = .371). We derived relative NREM delta activity from polysomnographic recordings to test whether SRT potentiates homeostatic sleep pressure relative to TBR (see Table 4 for all PSA results). Results revealed that relative delta activity (0.75–4.5 Hz) was elevated after the first week of SRT, when compared to TBR (p = .001, d = 0.52), and remained elevated at 4-weeks post-randomization (p = .001, d = 0.55). Exploratory analysis of the remaining relative frequency bands revealed a decrease for theta (4.5–8.0 Hz) and alpha (8.0–12.0 Hz) power in the SRT group, when compared to TBR at week-1 and week-4 (ps < .017). For relative sigma (12.0–15.0 Hz) and beta (15.0–32.0 Hz) power group differences were observed at week-4 (Sigma: p = .017, d = −0.34; Beta: p = .047, d = −0.11), reflecting reduced values in the SRT arm, but not at week-1 (Sigma: p = .117; Beta: p = .130). Corresponding absolute value are presented in Supplementary Table S2and revealed group differences only for theta (week-1: p = .048, d = −0.24) and alpha (week-1: p = .048, d = −0.32; week-4: p = .050, d = −0.34).
Relative power spectra (%) by frequency band for all-night NREM sleep (N2/N3)
| SRT | TBR | |||||||||||
|---|---|---|---|---|---|---|---|---|---|---|---|---|
| M | SD | n | M | SD | n | Diffadj | 95% CI | P | ES | |||
| Delta (%) | BL | 82.25 | 4.90 | 27 | 79.68 | 6.06 | 28 | |||||
| 0.75–4.5 Hz | W1 | 84.42 | 3.64 | 26 | 80.56 | 4.75 | 28 | 2.85 | 1.151 | 4.548 | .001 | 0.52 |
| W4 | 84.54 | 3.90 | 26 | 80.56 | 4.12 | 29 | 3.02 | 1.335 | 4.705 | .001 | 0.55 | |
| Theta (%) | BL | 8.90 | 2.25 | 27 | 10.98 | 3.71 | 28 | |||||
| 4.5–8.0 Hz | W1 | 8.43 | 2.01 | 26 | 10.76 | 3.04 | 28 | −1.09 | −1.864 | −0.315 | .007 | −0.37 |
| W4 | 8.35 | 2.25 | 26 | 10.66 | 2.79 | 29 | −1.06 | −1.919 | −0.209 | .016 | −0.36 | |
| Alpha (%) | BL | 4.88 | 1.53 | 27 | 5.40 | 2.18 | 28 | |||||
| 8.0–12.0 Hz | W1 | 4.14 | 1.17 | 26 | 5.23 | 1.94 | 28 | −0.81 | −1.349 | −0.266 | .004 | −0.44 |
| W4 | 4.19 | 1.35 | 26 | 5.27 | 1.93 | 29 | −0.83 | −1.422 | −0.23 | .008 | −0.45 | |
| Sigma (%) | BL | 3.20 | 1.58 | 27 | 3.24 | 1.73 | 28 | |||||
| 12.0–15.0 Hz | W1 | 2.66 | 1.24 | 26 | 3.03 | 1.29 | 28 | −0.41 | −0.931 | 0.106 | .117 | −0.25 |
| W4 | 2.57 | 1.11 | 26 | 3.06 | 1.17 | 29 | −0.56 | −1.011 | −0.102 | .017 | −0.34 | |
| Beta (%) | BL | 0.76 | 0.88 | 27 | 0.70 | 0.96 | 28 | |||||
| 15.0–32 Hz | W1 | 0.36 | 0.16 | 26 | 0.42 | 0.18 | 28 | −0.07 | −0.157 | 0.021 | .130 | −0.07 |
| W4 | 0.36 | 0.12 | 26 | 0.45 | 0.21 | 29 | −0.10 | −0.191 | −0.003 | .047 | −0.11 | |
SRT, sleep restriction therapy; TBR, time in bed regularization; BL, baseline, W1, week-1; W4, week-4; Delta, 0.75–4.5 Hz frequency band; Theta, 4.5–8.0 Hz frequency band; Alpha, 8.0–12.0 Hz frequency band; Sigma, 12.0–15.0 Hz frequency band; Beta, 15.0–32.0 Hz frequency band; Diffadj, adjusted mean difference for relative values derived from linear mixed model; 95% CI, 95% confidence interval of the adjusted mean difference; ES, effect size (Cohen’s d).
Significant P-values are displayed in bold. M and SD refer to unadjusted means and standard deviations of the relative power spectrum.
We next compared average delta and beta activity across the first 369 epochs of NREM sleep (N2 and N3), the maximum number of artiefact-free epochs common to all participants. We did not find any group differences for absolute delta values at week-1 (p = .63, d = −.09) or week-4 (p = .992, d = .00; see Figure 4). Analyses of beta power similarly revealed no group differences at week-1 (p = .63, d = −.02) or week-4 (p = .76, d = −.02). Means and standard deviations, as well as results from linear mixed models are presented for all frequency bands in Supplementary Table S3. Group differences were only detected for the alpha frequency band at week-1 (p = .045, d = −0.28), indicating reduced alpha in the SRT group, when compared to TBR.
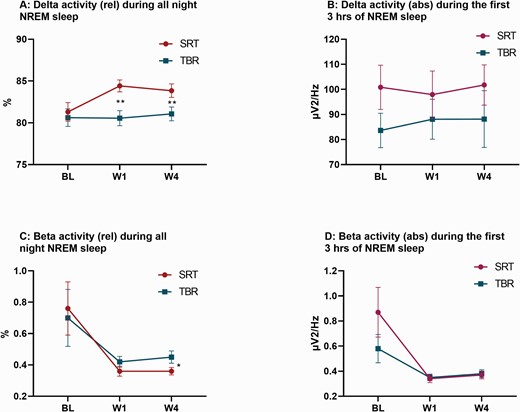
Measures of the EEG delta and beta power band during NREM sleep (N2/N3). Both graphs display raw means and standard errors across groups (blue = SRT; red = TBR) at baseline (BL), week-1 (W1), and week-4 (W4). (A) Displays the relative values of the EEG delta band in relation to the total of all frequencies (delta to beta). (B) Displays the average delta activity across the first 369 epochs of NREM sleep (N2 and N3), the maximum number of artifact-free NREM sleep epochs common to all participants. (C) Displays the relative values of the EEG beta band in relation to the total of all frequencies (delta to beta). (D) Displays the average beta activity across the first 369 epochs of NREM sleep (N2/N3). Adjusted mean differences between groups are derived from linear mixed models and significance is represented by a single (* = p < .05) or double asterisk (** = p < .01).
Discussion
The aim of this study was to elucidate the underlying mechanisms of SRT across multiple levels of explanation, spanning self-report, behavior, and physiology. We focused on testing whether treatment modifies mechanistic variables that are presumed to underlie clinical improvements; that is, potentiated sleep pressure and decreased arousal. We employed a dismantling trial to isolate restricted sleep opportunity between arms, which resulted in mild sleep deprivation in the SRT arm but not in the TBR group.
Self-reported and behavioral markers of sleep pressure increase following TIB restriction
In line with models of sleep regulation [51, 52], we found that sleep loss manifested in increased self-reported and behavioral markers of sleep pressure. Participants in the SRT group reported higher daily state-based sleepiness, responded slower on the PVT in the evening and reported higher daytime sleepiness during the early phase of the treatment. Group effects for state sleepiness were more pronounced in the evening relative to morning, and in the early- compared to the late treatment phase, when sleep restriction was most pronounced (see Table 1). Daytime sleepiness indexed with the ESS was also found to be increased during the early phase of SRT, but effects were reversed at 12-weeks follow up (with the SRT group reporting lower daytime sleepiness). Together, these results suggest that the increase in sleepiness is temporary, likely representing a manifestation of the sleep homeostat in response to initial sleep loss. Reduction in daytime sleepiness at week-12 may reflect enhanced daytime functioning following sleep opportunity extension [53] (although it should be noted that ESS scores were in the normal range at baseline).
Self-reported pre-sleep arousal decreases following TIB restriction
Confirming our hypothesis, between-group effects were found for daily pre-sleep cognitive arousal, with reductions in favor of SRT. Compared to daily measures of sleepiness, effects tended to be smaller in magnitude, although a similar pattern emerged with larger group effects at early- versus late treatment (dearly treatment = −0.53 vs. dlate treatment = −0.39). Participants in the SRT group also reported less pre-sleep arousal when measured with the PSAS. Interestingly, these group effects were larger at 12-week follow-up (e.g. full-scale PSAS [dweek-4 = −0.39 vs. dweek-12 = −0.52]). Visual inspection of all arousal measures indicates a general decrease for both groups over time, that is, both groups appeared to have experienced less pre-sleep arousal during, and after the acute treatment phase relative to baseline, yet with steeper declines in the SRT group (see Figure 3). These observations suggest that arousal may be particularly sensitive to common treatment factors such as therapist support, participation in a sleep improvement study, or regression to the mean. However, group differences point to additional effects specific to restricted sleep opportunity, which could be mediated by increased sleep pressure (i.e. sleepiness directly attenuates the degree of cognitive arousal) and/ or by improved sleep consolidation (i.e. reduced SOL and WASO mean there is less time to experience and indeed reflect on cognitive arousal). This is in line with previous qualitative data showing that participants look forward to going to bed during SRT implementation, contrasting with pre-treatment experiences, and report reduced anxiety and worry when initiating or returning to sleep [21].
Effects of TIB restriction on sleep physiology
For the first time, we report on the effects of SRT on sleep architecture and EEG power spectra in the context of a controlled trial. Reduction of TIB, and as a consequence TST, had marked effects on sleep continuity (previously reported [29]). Consistent with effects of sleep restriction in good sleepers [47, 54] we found that lighter sleep stages (N1 and N2) were substantially reduced, while N3 was preserved. Indeed, N3 as a proportion of TST increased by 4% (d = 0.54; see Supplementary Table S1) and latency to SWS was markedly reduced. In contrast to previous findings in healthy controls [47, 54], there was no change in REM sleep. The absence of architectural changes at week-4 suggests that acute effects may be driven by reduction in sleep length, since there was no reliable difference in TST at week-4.
Changes in the continuity and architecture of sleep were paralleled by shifts in NREM EEG power spectra. Between-group effects for relative delta power at week-1 and week-4 were observed, with higher relative delta power in the SRT group. In contrast, relative beta power (marker of cortical arousal) showed a small but statistically significant reduction at week-4. Exploratory analyses of the remaining frequency bands showed small-to-medium between-group effects for reduction in alpha and theta at week-1 and week-4; and for sigma at week-4. A negative dynamic between higher frequencies (alpha to beta) and delta power has previously been reported for experimental sleep restriction studies; showing that when delta activity increases, high frequencies decrease [55–57]. Importantly, this dynamic was also identified by a recent meta-analysis of studies comparing untreated individuals with insomnia to controls [46]. Results revealed that relative power was lower in the delta power range but elevated in the theta-beta frequency bands in those with insomnia. Increased activity in theta-sigma bands could, similar to beta activity, index cortical hyperarousal. Given this context, our results point towards a potential normalization of the EEG NREM spectrum following SRT intervention.
While all night NREM relative delta power was shown to increase, and relative beta power decrease, we did not observe group differences for absolute values for all night NREM, nor for the first 3 h of NREM sleep (representing the maximum number of epochs common to all participants across all nights; see Figure 4 and Supplementary Table S3). A previous trial of brief behavioral therapy similarly showed no treatment effect on absolute delta values [58]. Inconsistent findings between absolute and relative values have been reported when comparing NREM sleep between insomnia patients and controls [46]. In meta-analyses [46], values for relative power appear to be most sensitive to group effects (across all frequencies from delta to beta), while absolute values only show difference for the beta band. Intriguingly, the only frequency band that showed consistent between-group reductions across relative and absolute values, was alpha (see Table 4 and Supplementary Tables S2 and S3), the presence of which has been linked to non-restorative sleep and objective-subjective sleep discrepancy [59].
Experimental sleep restriction studies in healthy sleepers are also relevant in this context, whereby strong TIB reduction (e.g. TIB ≤ 4 h) leads to an increase in absolute low-frequency power bands [42, 55, 56], but relatively mild TIB reduction (e.g. TIB ≥ 5 h) does not [47, 60, 61]. It is possible, therefore, that the mild restriction in the SRT arm did not provoke a strong enough response to be observed in absolute delta power, or that any changes were masked by averaging over long time-periods. Future work should consider assessing other markers of sleep homeostasis during SRT, such as the temporal development of delta activity across the night, or the initial peak of delta activity; and utilize measures that allow for higher spatial resolution, such as high-density EEG.
Strengths and limitations
This is the first study to dismantle SRT to test whether the therapy works according to its proposed pathways. The study stands out through its rigorous assessment of cognitive, behavioral, and physiological mechanisms and its research design. Indeed, we carefully designed this study to (1) control for nonspecific treatment effects; (2) follow RDoC guidelines in terms of measurement domains; and (3) assess putative mechanisms in a high-resolution manner during the acute treatment phase. While the acute treatment phase is key to understanding mechanisms, future studies should conduct long-term assessment of mechanistic variables to test whether changes are persistent over time. Furthermore, additional methodological approaches are needed to establish whether change in mechanistic variables drive clinical outcomes following SRT. This may include classic mediation approaches but also novel approaches that account for individual differences, feedback loops, and non-linearity between mechanisms and outcomes. We did not perform mediation analysis on the present data since the study did not seek to test such a hypothesis from the outset [62] and hence our small sample size would likely be underpowered to test indirect effects. However, results from this trial may now inform future study designs to conduct such analysis.
Limitations of our study should be considered. While most hypotheses were pre-specified, some PSA and architectural findings were exploratory in nature. We felt it necessary to perform and report on analyses of absolute values across the frequency bands to provide the reader with maximal context (see Supplementary Material). However, as a consequence, this means that we conducted a large number of statistical tests, and did not correct for multiple testing, resulting in an increased risk of type I error. To allow the reader to judge statistical effects, we present all p-values, confidence intervals, and effect size magnitude for all analyses. Regarding results derived from ambulatory PSG, our study protocol did not include a screening or adaptation night. Consequently, we cannot rule out other underlying sleep disorders or first night effects [63]. While the home environment was more comfortable for participants and enabled assessment of sleep under natural conditions, it hindered control over confounding variables such as noise or bed-partners. By using a randomized controlled trial, we expect the impact of confounding variables to be minimal and balanced across arms.
We compared SRT to TBR, a control intervention that, prior to this study, had not been formally tested. We considered TBR as a suitable control arm since it accounts for non-specific treatment factors, yet we recognize that the regularization of sleep times may yield beneficial treatment effects via sleep stabilization (and/or therapist support). If this is true, between-group comparisons of SRT and TBR could, in principle, underestimate the specific mechanistic effects of SRT. Future studies might consider testing SRT against a control group that is matched for non-specific effects but does not involve components that potentially act on sleep (e.g. Imagery relief therapy [64]). Given the strict inclusion/exclusion criteria we recruited a sample without comorbidity, and that turned out to be highly educated; the sample, therefore, may not be representative of the broader clinical insomnia population.
In this study we focussed on what we consider to be the chief and proximal mechanisms of SRT, however, we recognize that there may be other mechanistic variables beyond those assessed here (e.g. better alignment of sleep behavior and circadian phase [65]). A key remaining question for the field is how does SRT drive long-term improvement in insomnia, even after gradual extension of sleep opportunity and sleep time. One parsimonious explanation is that both the principles and practice of SRT (e.g. regular bed/rise-time, matching sleep need to sleep opportunity, and discouraging attempts to “catch-up” on sleep) generalize beyond the acute implementation phase, helping to stabilize the sleep-wake pattern and increase resilience to future disruption (e.g. in the face of stressors). Acute implementation of SRT may also effectively challenge core beliefs about sleep, and re-establish a sense of control, helping to engender long-lasting cognitive (as well as behavioral) change. Future studies should examine the temporal interplay of these psychobiological mechanisms [16].
Conclusion
In conclusion, this study shows that SRT engenders change in both sleep pressure and arousal. Potentiated sleep pressure was evidenced by increased sleepiness, reduced vigilance, and enhanced (relative) NREM delta power, but also by improved sleep consolidation (reduced SOL/WASO) [29] and architecture (particularly reduced SWS latency, less time in N1 and N2, and increased proportion of N3). Parallel changes were observed in measures of arousal. Given the mixed PSA findings, with respect to differences in relative vs absolute values, we suggest that future studies seek to further characterize EEG markers of sleep homeostasis and cortical arousal during SRT.
Clinical Trial. The MARTINI trial is registered with ISRCTN (ISRCTN10974094) at: https://doi.org/10.1186/ISRCTN10974094.
Acknowledgments
We would like to thank Professor Dr. Reto Huber for input when drafting this manuscript and in particular for discussions on sleep homeostasis. We would also like to acknowledge Dr. Jules Schneider for input when writing analysis scripts for the power spectral analysis and Dr. Rachel Sharman for input on scoring of polysomnography recordings.
Funding
SDK and CAE are supported by the National Institute for Health Research (NIHR) Oxford Biomedical Research Centre (BRC) based at Oxford University Hospitals NHS Trust and the University of Oxford. The views expressed are those of the authors and not necessarily those of the NHS, the NIHR, or the Department of Health. This work was also supported by funding from NIHR-HTA (16/84/01; CI SDK) and through a DPhil Scholarship (to LFM) from Dr. Mortimer and Theresa Sackler Foundation.
Disclosure Statement
Financial Disclosure Statement
CAE is co-founder of and shareholder in Big Health Ltd., a company that specializes in the digital delivery of cognitive behavioral therapy for sleep improvement (Sleepio). RE reports personal fees from Big Health Ltd., outside the submitted work. All other investigators report no competing interests.
Nonfinancial Disclosure Statement
SDK reports nonfinancial support from Big Health Ltd. in the form of no-cost access to Sleepio for use in clinical trial research. All other investigators report no competing interests.
References


Comments