


Abstract
Insomnia is one of the most common disorders in the general population. Hypnotic medications are efficacious, but their use is limited by adverse events (AEs). This study evaluated the safety and efficacy of a novel forehead temperature-regulating device that delivers frontal cerebral thermal therapy (maintained at 14–16°C, equivalent to 57–61°F) for the treatment of insomnia.
This was a prospective, randomized controlled trial involving two nights of therapy in 106 adults diagnosed with insomnia. The main outcome measures included latency to persistent sleep and sleep efficiency derived from polysomnographic (PSG) recordings and frequency and severity of AEs.
The safety profile was comparable to sham treatment. Statistically significant differences were not found in the two a priori co-primary endpoint measures absolute latency to persistent sleep (p = 0.092) or absolute sleep efficiency. Frontal cerebral thermal therapy produced improvements over sham in other convergent measures of sleep latency including relative changes from baseline in latency to persistent sleep (p = 0.013), the latency to stage 1 NREM sleep (p = 0.006), the latency to stage 2 NREM sleep (p = 0.002), a trend for the latency to stage 3 NREM sleep (p = 0.055), and an increase in the minutes of sleep during the first hour of the night (p = 0.024).
Two-night frontal cerebral thermal therapy produced improvements in PSG measures of insomnia patients’ ability to fall asleep and had a benign safety profile. Further studies are warranted to determine the role of this therapy in the longer-term management of insomnia.
clinicaltrials.gov Identifier: NCT01966211
The management of insomnia patients is complicated by the adverse safety profiles of hypnotics. Effective treatments for insomnia that are not only effective but also safe are needed. The main findings of this study are that acute two-night use of frontal cerebral thermal therapy has few side effects and produces improvements in insomnia patients’ ability to fall asleep. Additional studies are warranted to determine its role in the long-term management of insomnia.
Introduction
Insomnia is one of the most prevalent health concerns in the general population and in clinical practice. An insomnia disorder is characterized by a predominant complaint of dissatisfaction with sleep quantity or quality and is associated with one or more of: (1) difficulty initiating sleep, (2) difficulty maintaining sleep, characterized by frequent awakenings or problems returning to sleep after awakenings, (3) early-morning awakening with inability to return to sleep [1, 2]. The annual prevalence of insomnia symptoms ranges from 35 to 50 per cent [3], and an insomnia disorder is 22 per cent [4]. Insomnia has been associated with reduced productivity, increased absenteeism, health care costs and risks of mental disorders, metabolic syndrome, hypertension and coronary heart disease [5–9]. The economic burden is estimated at $13.9 billion annually [10].
The medical management of insomnia has largely relied on hypnotic drugs [11–13] and to a lesser extent behavioral therapies. A survey [14] showed that 3 per cent of adults used a medication for insomnia within the preceding month. These are effective in reducing sleep latency, but their use is limited by adverse events (AEs), including morning sedation, impaired driving, anterograde amnesia, increased falls and hip fractures, complex sleep-related behaviors, rebound insomnia, withdrawal, and in at-risk population’s dependence and abuse [15–18]. The U.S. Food and Drug Administration (FDA) required warning language for all hypnotics because of concerns regarding complex sleep-related behaviors. Based on new data regarding the differential kinetics in men and women with zolpidem as well as driving-related psychomotor performance, the FDA required the manufacturers of zolpidem [19] and eszopiclone [20] to lower starting doses for women and men. Safety concerns prompted the FDA to recommend lower starting doses for suvorexant than were primarily studied in their clinical trials [21, 22]. Patient and physician surveys demonstrate that there is a strong need for alternatives to hypnotics [23–25]. Cognitive Behavior Therapy for Insomnia (CBT-I) is recognized as an effective treatment for insomnia. Some limitations on the utility of CBT-I include: (1) a shortage of trained specialists, (2) cost and variable insurance reimbursement, and (3) relatively extended duration of time-intensive treatment. Efforts are underway to determine ways to overcome some of these challenges to make CBT-I more broadly available.
Additional solutions should build on advances in sleep neuroscience and in brain therapeutics that are clinically and economically feasible. It is widely accepted that insomnia is a disorder of hyperarousal [26]. Increased activity in the frontal cortex during sleep may contribute to hyperarousal in insomnia patients, thereby preventing the reduction in metabolism that occurs in normal sleepers [27, 28]. Sleep disturbances have been shown to correlate with frontal metabolism during sleep, and alterations in frontal metabolism have been demonstrated following successful treatment [29–31]. Reduction in brain metabolism by means of cerebral hypothermia is used as a neuroprotective therapy in neurosurgery, emergency medicine, and anesthesiology [32–34]. Studies have shown that the application of a cooling stimulus to the scalp decreases brain temperature in the underlying cortex in both animals and humans [35, 36]. Biomedical engineering models [37, 38] demonstrate that cooling of the brain gray matter can be achieved by selective head cooling on the surface. A pilot functional neuroimaging study showed that frontal cerebral thermal therapy reduced frontal cerebral metabolism during sleep in insomnia patients [39].
This study was a double-blinded, randomized controlled trial conducted to evaluate the efficacy and safety of a noninvasive medical device worn over the forehead that delivered frontal cerebral thermal therapy in relation to a credible device control (sham vestibular stimulation) in insomnia patients. Changes in polysomnographic (PSG) measures of latency to persistent sleep and sleep efficiency were the co-primary outcome measures. Self-reported AEs were assessed as safety outcomes. Additional supportive analyses of objective and subjective measures of sleep were also performed to further clarify the clinical meaningfulness of the device in the treatment of insomnia.
Methods
After recruitment, screening, baseline clinical, and PSG assessments, participants were randomly assigned to two-night frontal cerebral thermal therapy (referred to as the “forehead sleep system” or “active device”) or vestibular stimulation (referred to as the “vestibular sleep system” or “sham device”). Assignment was 1:1, randomized permuted blocks of size 2 and 4, stratified by center, generated using SAS version 9.3, implemented using an interactive web response system with centers enrolling and assigning participants to interventions. Recruitment was stopped when the desired sample size was achieved allowing for attrition. Subjects and technical staff were informed that subjects would be receiving one of two active treatments to blind the study. There were no instructions given that one of the devices would be active and one a sham, nor that one device was intended to be more active than the other. Co-primary outcomes included PSG latency to persistent sleep (absolute minute change) and sleep efficiency (absolute change) and patient reports of AEs. The Copernicus institutional review board approved the study. All participants provided written informed consent and were financially compensated.
Participants included men and women with primary insomnia [40, 41] aged ≥22 years (DSM-IV criteria were used as DSM-5 criteria were not yet in place at the time of study initiation). Participants were recruited through advertisements and clinical referrals and evaluated with a medical history; medication/ substance use history; urine drug and pregnancy screens; psychiatric history using the Mini International Neuropsychiatric Interview (M.I.N.I.) and Structured Clinical Interview for DSM-IV (SCID) [42]; sleep disorder history using the Structured Clinical Interview for DSM-IV Sleep Disorders interviews (to evaluate sleep disorders as defined by the International Classification of Sleep Disorders (ICSD-2) [41]; and DSM-IV [40]; and insomnia presence and severity by the Insomnia Severity Index (ISI) [43]. Subjects completed a sleep–wake diary [44] for at least 7 days. Inclusion criteria included provision of informed consent, a current diagnosis according to DSM-IV criteria, a score >14 on the ISI, and sleep diary assessed sleep efficiency ≤85 per cent on at least 50 per cent of nights over 7 days. Exclusion criteria included significant or unstable medical conditions; current major syndromal mood, anxiety, psychotic, or substance use disorder; current sleep disorder; Raynaud’s disease, a body mass index >34, an apnea hypopnea index (AHI) >10 or a periodic limb movement arousal index (PLMAI) >15; pregnancy, use of medications or substances known to affect sleep–wake function; coffee consumption (or equivalent) of greater than four cups per 24 hours; and alcohol of greater than seven drinks per week. PSG exclusion criteria included latency to persistent sleep <15 minutes and/or sleep efficiency >85 per cent on either of two baseline PSG nights.
Sleep recordings were made in a private, sound-attenuated, and temperature-controlled room (68–72°F). Subjects had a urine screen for drug use and a breath test for alcohol. Subjects underwent two baseline PSG nights, one to screen for sleep disorders and the second to collect baseline sleep measures prior to any interventions, then three to seven nights sleep at home, then two PSG nights on device. Mean data from both baseline and both device nights were used in analyses. Good night times (PSG start) and good morning times (PSG stop) were determined as 4 hours prior to, and 4 hours after, respectively, the mid-point of their sleep diary times in bed at home averaged over the 1-week period of the sleep–wake diary completion. These times were held constant for each patient’s four recordings. The Henry Ford Hospital Central Scoring Service (HFH-CCS) provided standardized, centralized scoring of the PSG data [45]. Sleep scorers were blind to condition. The PSG montage included: left electro-oculogram (E1/M2); right electro-oculogram (E2/M1); submental electromyogram (chin1/chin2); submental electromyogram (chin2/chin3); electroencephalogram (C3/M2); electroencephalogram (O1/M2); electroencephalogram (F4/M1); electroencephalogram (C4/M1); and electrocardiogram (ECG). For the sleep disorder screening night, the following were added: nasal/oral thermal sensor (TFLOW) and left anterior tibialis electromyogram (L LEG).
The active “Forehead Sleep System” included a bedside unit that utilized solid-state thermoelectric cooling and a pump to transport thermal fluid to a urethane forehead bladder. The forehead bladder was held in place by a lycra-based headband and circulated the fluid over the subject’s forehead over the area of the frontal cortex at a precisely regulated temperature across the night. The temperature of the fluid could be adjusted for comfort between five settings (temperatures ranging from 14°C to 16°C, equivalent to 57–61°F). The sham “Vestibular Sleep System” used the same bedside unit, but with no stimulus. This was connected to a control box that subjects were informed controlled the intensity of the vestibular stimulation between five settings. The box was connected via wires to electrode pads placed behind the patient’s ears. Patients were informed that these delivered a sub-sensory threshold electrical stimulus to their vestibular nerve. Patients were informed that they would be assigned to treatment with one of two active devices. There was no differentiation in the informed consent procedures that either would be the hypothesized “active” or “sham” device. So, while subjects knew which device they would be receiving, they were blinded as to whether the device they were receiving was considered “active” or “sham”. A blinding questionnaire was administered at pre- and post-treatment asking subjects to rate whether they “strongly” or “somewhat” believed that one or the other of the interventions was more active than the other treatment, or they “did not know” whether either treatment was more effective.
Subjects wore the devices beginning 60 minutes prior to lights out and throughout the night for two nights in the laboratory. The active device was applied at 30°C, then set to setting three (15°C), which was achieved over 30 minutes. The sham device was applied and set to setting three. After 30 minutes, subjects were given the opportunity to make a one-time change depending on their comfort level to setting one (14°C) or setting five (16°C) for the active device or to setting one (less intense) or setting five (more intense) for the sham device. At the end of the 60 minute period, subjects kept the devices on at these settings for an additional 8 hours in bed.
“Latency to Persistent Sleep,” a co-primary endpoint, was defined as the number of minutes from the beginning of the recording to the first 10 minutes of continuous sleep. “Sleep Latency” was defined as the number of minutes from the beginning of the recording to any stage of sleep (stage 1, 2, 3 or REM). “Latencies to stage 1, stage 2 or stage 3 NREM Sleep” were defined as the number of minutes from lights out to the first epoch of stage 1, 2, or 3 NREM sleep, respectively. “Sleep Efficiency,” the second co-primary endpoint, was defined as the percent of time asleep of the 8 hour bedtime. “Total Sleep Time” was defined as the number of NREM stage 1, 2, 3 and REM stage minutes from the beginning of the recording to the end of the recording. “Wake After Sleep Onset (WASO)” was defined as the number of wake minutes from the onset of persistent sleep to the end of the recording. “Awakenings” was defined as the number of times, after onset of persistent sleep, that there was an entry into wake of at least 1 minute duration. Each entry to be counted must have been separated by stage 2, 3, or stage REM sleep. Results are provided for both absolute within subject changes averaged across patients as well as relative within subject changes in relation to baseline averaged across patients.
Each morning after sleeping in the research laboratory subjects completed the Pittsburgh Sleep Diary [45]. They recorded their subjective estimates of sleep latency (in minutes), sleep quality (very bad to very good), mood (very tense to very calm) and alertness (very sleepy to very alert). Sleep quality, mood, and alertness were assessed by placing an “X” along a 100 mm visual analog scale, so that their responses could be measured along a 0–100 range. Results are provided both in absolute within subject change levels averaged across groups as well as averaged relative changes from each subject’s baseline value.
Data modeling and statistical analysis
The study was powered for two co-primary hypotheses evaluating sleep latency and efficiency. Sample size calculations assumed 80 per cent power, one-sided tests with alpha values of 0.025, adjusted for a planned interim analysis. Estimated effects for the active condition were based on prior studies of the effects of the device in insomnia patients where latencies to persistent sleep averaged 71.8 ± 52.3 and 31.6 ± 30.6 minutes for the baseline and active conditions, respectively, and sleep efficiencies averaged 66.8 ± 12.9% and 79.7 ± 12.6% for the baseline and active conditions, respectively. Sample size calculations assumed a 25 per cent sham improvement in sleep latency relative to baseline (standard deviation = 22) and a 7 per cent sham improvement in sleep efficiency relative to baseline (standard deviation = 11), and assuming effects of the active condition to be comparable to those observed in a prior trial. Latencies to persistent sleep for the sham device were therefore hypothesized as 71.8 ± 52.3 and 53.8 ± 30.6 for the baseline and sham conditions, respectively. Sleep efficiencies were hypothesized as 66.8 ± 12.9% and 71.4 ± 12.6% for the baseline and sham conditions, respectively. The pre-specified analysis cohort was the Intent-to-treat (ITT) cohort consisting of all subjects who were randomized. A pre-specified interim analysis was conducted to consider a possible sample size re-estimation, using the methods of Cui et al. [46]. The Lan-DeMets approach to group sequential analysis using an O’Brien-Fleming–type alpha spending function was used to control the overall study type I error rate. Regression methods were used to impute missing values for sleep latency and sleep efficiency. Each missing value was imputed 10 times resulting in 10 complete data sets for analysis. Categorical data were summarized using frequency tables. Pearson correlation coefficients were used to assess relationships among measures. Fisher’s exact test was used to assess differences in distributions of the categorical data. T-tests were used for continuous variables. For measures with non-normal distributions, we used the non-parametric Wilcoxon Rank Sum test to determine p-values. A Hodges–Lehmann estimate of the treatment difference between the two groups along with 95 per cent confidence intervals is also provided. To analyze the primary outcome measures, a general linear mixed model was used. Each endpoint was modeled using treatment group as the explanatory variable along with the baseline values for that endpoint to adjust for the starting point at baseline (referred to as “adjusted” analyses). Each of the 10 complete (imputed) data sets was analyzed separately, and the results from each analysis were then combined to produce one overall test of the endpoints. The Statistical Analysis System was used to perform all analyses.
Results
Of the 405 participants recruited, 106 met inclusion/exclusion criteria and were randomized (54 to active and 52 to sham) (Figure 1). Seven research sites participated in the study. They individually contributed 28, 24, 22, 18, 11, 8, and 5 subjects to the study. Also, 94 per cent of participants treated with the active device (n = 51 of 54) and 94 per cent with the sham device (n = 49 of 52) completed all scheduled assessments. Age, gender, race, subjective insomnia severity (based on ISI score), mean subjective sleep efficiency based on pre-treatment screening diary reports and PSG measures of apnea, periodic limb movements, latency to persistent sleep, and sleep efficiency did not differ between the groups (Tables 1 and 2). The blinding questionnaire results are displayed in Table 3. The questionnaire was not completed in 17 per cent of individuals at the pre-treatment period and by 3 per cent of individuals at the post-treatment period because at the outset of the study (first 20 subjects) only the post-treatment questionnaire was administered. The most frequent response for both treatments was that they “did not know” which device was supposed to be more effective.
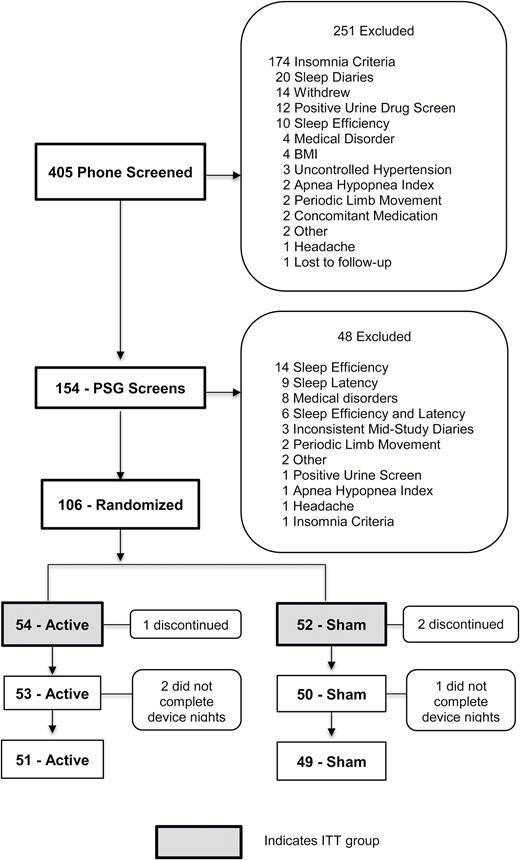
Study flow chart.
Baseline Demographic and Clinical Characteristics
| Characteristic | Forehead sleep system (active) N = 54 | Vestibular sleep system (sham) N = 52 | p |
|---|---|---|---|
| Age (years ± SD) | 49.9 ± 13.8 | 50.3 ± 15.4 | 0.877 |
| Gender | |||
| Female N (%) | 37 (69%) | 37 (71%) | 0.834 |
| Male N (%) | 17 (31%) | 15 (29%) | |
| Race | |||
| Caucasian N (%) | 18 (33%) | 19 (37%) | 0.826 |
| Black N (%) | 24 (44%) | 20 (38%) | |
| Hispanic or Latino N (%) | 12 (22%) | 13 (25%) | |
| ISI (mean score ± SD) | 20.5 ± 3.3 | 20.4 ± 3.5 | 0.886 |
| Screening diary sleep efficiency (mean % over 7 days) | 69 ± 11% | 66 ± 13% | 0.148 |
| Screening polysomnography | |||
| Apnea–hypopnea index (events/hour ± SD) | 1.6 ± 2.3 | 2.3 ± 2.4 | 0.120 |
| Periodic limb movement arousal index (events/hour ± SD) | 1.1 ± 2.5 | 1.5 ± 2.8 | 0.489 |
Polysomnographic Measures
| Sleep measure | Forehead sleep system (N = 54 baseline, N = 53 on device) | Vestibular sleep system (N = 52 baseline, N = 50 on device) | Estimate of difference (95% CI) | p |
| Persistent sleep latency (mean ± SD) | ||||
| Baseline (min) | 69.7 ± 38.6 | 63.3 ± 32.4 | 6.5 (−7.3, 20.2) | |
| On Device (min) | 34.8 ± 26.3 | 40.4 ± 27.5 | −5.6 (−16.1, 4.9) | |
| Change from baseline (min) | −34.8 ± 34.0 | −23.0 ± 32.2 | −7.9 (−18.4, 2.6) | 0.092 |
| Relative change from baseline (%) | −48.1 ± 30.7 | −26.8 ± 50.9 | −19.8 (−37.7, −1.9) | 0.013 |
| Sleep efficiency (mean ± SD) | ||||
| Baseline (%) | 68.3 ± 10.6 | 70.4 ± 10.0 | −2.2 (−6.1, 1.8) | |
| On device (%) | 80.3 ± 9.5 | 80.7 ± 9.6 | −0.4 (−4.1, 3.4) | |
| Change from baseline (%) | 12.3 ± 9.8 | 10.4 ± 12.2 | 0.5 (−3.4, 4.5) | 0.759 |
| Relative change from baseline (%) | 19.9 ± 17.3 | 17.4 ± 24.7 | −0.6 (−7.1, 5.9) | 0.830 |
| Sleep latency (mean ± SD) | ||||
| Baseline (min) | 49.2 ± 29.8 | 41.7 ± 27.5 | 7.6 (−3.5, 18.6) | |
| On device (min) | 21.9 + 19.8 | 31.9 + 27.9 | −9.9 (−19.4, −0.5) | |
| Change from baseline (min) | −26.8 + 27.7 | −10.7 + 26.6 | −12.4 (−20.8, −4.1) | 0.004 |
| Relative change from baseline (%) | −50.2 + 46.0 | −7.6 + 91.0 | −39.0 (−66.4, −11.6) | 0.006 |
| Stage 1 latency (mean ± SD) | ||||
| Baseline (min) | 49.2 + 29.8 | 41.7 + 27.5 | 7.6 (−3.5, 18.6) | |
| On device (min) | 22.0 ± 19.7 | 31.9 + 27.9 | −9.9 (−19.3, −0.4) | |
| Change from baseline (min) | −26.7 + 27.4 | −10.7 + 26.6 | −12.4 (−20.7, −4.1) | 0.004 |
| Relative change from baseline (%) | −50.2 + 45.9 | −7.6 + 91.0 | −38.9 (−66.4, −11.5) | 0.006 |
| Stage 2 latency (mean ± SD) | ||||
| Baseline (min) | 57.3 ± 30.3 | 51.0 ± 32.5 | 6.3 (−5.8, 18.4) | |
| On device (min) | 27.6 ± 22.0 | 37.1 ± 28.1 | −9.5 (−19.3, 0.4) | |
| Change from baseline (min) | −29.3 ± 26.1 | −15.1 ± 29.8 | −11.5 (−19.9, −3.1) | 0.008 |
| Relative change from baseline (%) | −49.0 ± 31.3 | −13.4 ± 71.3 | −33.4 (−54.0, −12.7) | 0.002 |
| Stage 3 latency (mean ± SD) | ||||
| Baseline (min) | 117.9 ± 77.9 | 103.4 ± 51.1 | 14.5 (−12.4, 41.4) | |
| On device (min) | 67.4 ± 61.6 | 77.5 ± 64.9 | −10.1 (−36.0, 15.8) | |
| Change from baseline (min) | −50.9 ± 61.9 | −26.5 ± 63.8 | −17.4 (−39.4, 4.7) | 0.122 |
| Relative change from baseline (%) | −39.8 ± 28.2 | −20.7 ± 57.2 | −17.8 (−35.9, 0.4) | 0.055 |
| Total sleep time (mean ± SD) | ||||
| Baseline (min) | 327.7 ± 50.8 | 338.0 ± 47.9 | −10.4 (−29.4, 8.7) | |
| On device (min) | 385.4 ± 45.8 | 387.1 ± 46.2 | −1.7 (−19.7, 16.3) | |
| Change from baseline (min) | 58.8 ± 47.1 | 49.7 ± 58.8 | −11.7, 29.9 | 0.386 |
| Relative change from baseline (%) | 19.9 ± 17.3 | 17.4 ± 24.7 | −5.8, 10.8 | 0.555 |
| WASO (mean ± SD) | ||||
| Baseline (min) | 90.1 ± 40.1 | 85.8 ± 36.6 | 4.2 (−10.6, 19.0) | |
| On device (min) | 65.4 ± 36.8 | 56.9 ± 43.3 | 8.5 (−7.2, 24.2) | |
| Change from baseline (min) | −26.0 ± 40.0 | −29.4 ± 50.5 | −14.3, 21.2 | 0.703 |
| Relative change from baseline (%) | −18.3 ± 56.8 | −26.0 ± 67.5 | −16.7, 32.0 | 0.533 |
| Awakenings (mean ± SD) | ||||
| Baseline (#) | 9.9 ± 4.6 | 9.2 ± 3.8 | 0.7 (−1.0, 2.3) | |
| On device (#) | 8.7 ± 3.5 | 8.1 ± 3.7 | 0.7 (−0.7, 2.1) | |
| Change from baseline (#) | −1.3 ± 4.0 | −1.2 ± 2.9 | −1.4, 1.3 | 0.960 |
| Relative change from baseline (%) | −1.8 ± 46.5 | −10.5 ± 35.9 | −7.6, 25.0 | 0.292 |
Treatment Expectations Questionnaire
| Visit | Response | Forehead sleep system (n = 54) | Vestibular sleep system (n = 52) |
|---|---|---|---|
| Pretreatment | Questionnaire not completed | 10 (18.5%) | 9 (17.3%) |
| I strongly believe the vestibular sleep system is supposed to be more effective than the forehead sleep system. | 3 (5.6%) | 4 (7.7%) | |
| I somewhat believe the vestibular sleep system is supposed to be more effective than the forehead sleep system. | 2 (3.7%) | 3 (5.8%) | |
| I somewhat believe the forehead sleep system is supposed to be more effective than the vestibular sleep system. | 9 (16.7%) | 5 (9.6%) | |
| I strongly believe the forehead sleep system is supposed to be more effective than the vestibular sleep system. | 5 (9.3%) | 6 (11.5%) | |
| I don’t know which device is supposed to be more effective than the other. | 25 (46.3%) | 25 (48.1%) | |
| Post-treatment | Questionnaire not completed | 1 (1.9%) | 2 (3.8%) |
| I strongly believed the vestibular sleep system was supposed to be more effective than the forehead sleep system. | 3 (5.6%) | 3 (5.8%) | |
| I somewhat believed the vestibular sleep system was supposed to be more effective than the forehead sleep system. | 3 (5.6%) | 11 (21.2%) | |
| I somewhat believed the forehead sleep system was supposed to be more effective than the vestibular sleep system. | 9 (16.7%) | 8 (15.4%) | |
| I strongly believed the forehead sleep system was supposed to be more effective than the vestibular sleep system. | 12 (22.2%) | 3 (5.8%) | |
| I didn’t know which device was supposed to be more effective than the other. | 26 (48.1%) | 25 (48.1%) |
Co-primary endpoint analyses
The active and sham groups did not show statistically significant differences on the two co-primary endpoint measures “absolute change from baseline in Latency to Persistent Sleep” (p = 0.092) and “absolute change from baseline in Sleep Efficiency” (Table 2 and Figure 2).
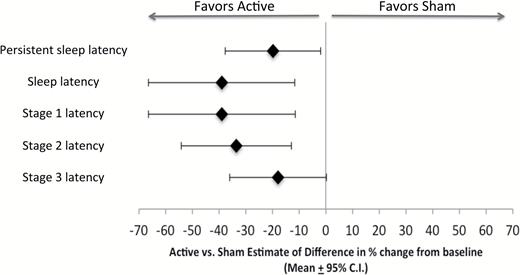
Active vs. sham percent improvements in sleep latencies relative to baseline.
Supportive analyses
The active group showed a statistically significant greater reduction than sham on the measure “relative change from baseline in Latency to Persistent Sleep” (p = 0.013). The active group showed greater improvements from baseline on the measures absolute and relative change in sleep latency (p = 0.004 and p = 0.006, respectively), absolute and relative change in stage 1 latency (p = 0.004 and p = 0.006, respectively), absolute and relative change in stage 2 latency (–p = 0.008 and p = 0.002, respectively), and a trend toward a greater reduction in the relative change in stage 3 latency (p = 0.055). Since subjects do not always exhibit stage 3 NREM sleep during the night, subjects who exhibited no stage 3 sleep were excluded from these analyses (three active and six sham subjects; Table 2 and Figure 2).
Correlations between sleep latency measures
The pre- to post-treatment change in absolute latency to persistent sleep for the entire sample (all 106 subjects randomized) significantly correlated with the pre- to post-treatment changes in sleep latency (r = 0.77, p < 0.0001), latency to stage 1 NREM sleep (r = 0.77, p < 0.0001), latency to stage 2 NREM sleep (r = 0.84, p < 0.0001), latency to stage 3 NREM sleep (r = 0.49, p < 0.0001) as well as subjective sleep latency (r = 0.65, p < 0.0001).
Additional PSG measures
Increases in total sleep time and reductions in WASO and number of awakenings were noted in both the active and sham conditions in relation to baseline. No statistically significant differences between groups in the changes from baseline were noted in these measures. The median (first and third quartiles) minutes asleep for each hour of the night for both the active and sham conditions at baseline and on device are shown in Figures 3 and 4. The active group showed significant increases in the pre- to post-treatment minutes asleep for the first hour of the night in relation to sham (active median [Q1, Q3] = 17.8 [10.5, 27.8] vs. sham median [Q1, Q3] =10.4 [0.3, 21.3]; estimate of difference [95% CI] = −6.9 [−12.8, −1.0]; p = 0.024). No other hourly differences reached statistical significance (Table 2 and Figures 3 and 4).
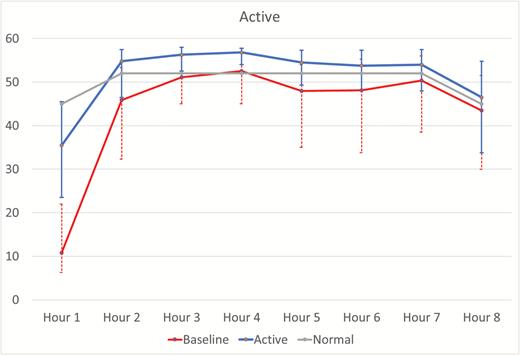
Hour-by-hour minutes of sleep for baseline and device in the active condition. The baseline and active lines represent the median ± first and third quartile minutes per hour of sleep across the night for the baseline and active device nights for subjects in the active condition. The “Normal” line is a hypothetical hour-by-hour minutes per hour of sleep reference line for a good sleeper defined as 85% sleep efficiency with sleep latency of 15 minutes and assuming 45 of 60 minutes of sleep for hour 8.
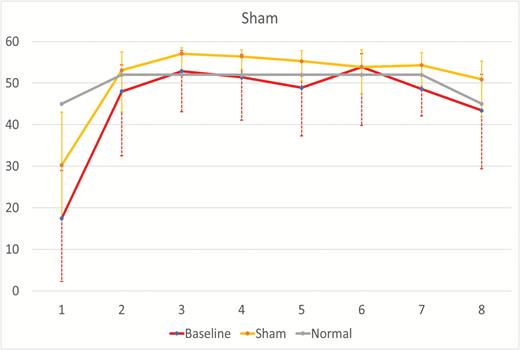
Hour-by-hour minutes of sleep for baseline and device in the sham condition. The baseline and sham lines represent the median ± first and third quartile minutes per hour of sleep across the night for the baseline and sham device nights for subjects in the sham condition. The “Normal” line is a hypothetical hour-by-hour minutes per hour of sleep reference line for a good sleeper defined as 85% sleep efficiency with sleep latency of 15 minutes and assuming 45 of 60 minutes of sleep for hour 8.
Subjective measures
Improvements across all subjective self-report sleep measures were noted for both the active and sham groups. Most subjective measures showed no statistically significant changes from baseline between groups. A trend toward a significantly greater increase from baseline in the active group was noted for the measure relative change in subjective alertness after awakening (p = 0.095). Changes in the latency to persistent sleep correlated significantly with changes in subjective sleep latency (r = 0.65, p < 0.0001; Table 4).
Subjective Sleep Measures
| Sleep measure | Forehead sleep system (N = 54) | Vestibular sleep system (N = 52) | Estimate of difference | p |
|---|---|---|---|---|
| Subjective sleep latency | ||||
| Baseline (mean ± SD minutes) | 61.9 ± 36.5 | 59.9 ± 33.9 | 2.1 (−11.5, 15.6) | |
| On device (mean ± SD minutes) | 43.0 ± 28.0 | 45.7 ± 32.1 | −2.7 (−14.4, 9.1) | |
| Change from baseline (mean ± SD minutes) | −17.6 ± 23.9 | −14.2 ± 21.9 | −3.2 (−10.8, 4.5) | 0.410 |
| Relative change from baseline (mean ± SD%) | −24.7 ± 38.7 | −19.8 ± 32.6 | −4.7 (−18.5, 9.2) | 0.505 |
| Subjective sleep quality | ||||
| Baseline (mean ± SD) | 37.9 ± 16.8 | 32.4 ± 17.3 | 5.5 (−1.1, 12.1) | |
| On device (mean ± SD) | 49.5 ± 18.1 | 45.5 ± 18.8 | 4.1 (−3.2, 11.3) | |
| Change from baseline (mean ± SD) | 11.8 ± 20.6 | 14.2 ± 15.4 | 0.7 (−5.8, 7.3) | 0.822 |
| Relative change from baseline (mean ± SD) | 104.0 ± 389.5 | 70.7 ± 114.8 | 77.4 (−30.1, 184.9) | 0.157 |
| Subjective alertness | ||||
| Baseline (mean ± SD minutes) | 43.1 ± 19.2 | 40.5 ± 17.5 | 2.6 (−4.4, 9.7) | |
| On device (mean ± SD) | 51.9 ± 18.5 | 46.5 ± 20.3 | 5.4 (−2.2, 13.0) | |
| Change from baseline (mean ± SD) | 8.7 ± 20.4 | 7.0 ± 16.7 | 3.4 (−3.3, 10.0) | 0.316 |
| Relative change from baseline (mean ± SD) | 50.5 ± 111.4 | 35.5 ± 82.9 | 26.9 (−4.8, 58.6) | 0.095 |
| Subjective mood | ||||
| Baseline (mean ± SD) | 49.0 ± 20.2 | 45.1 ± 19.5 | 3.9 (−3.8, 11.5) | |
| On device (mean ± SD) | 57.2 ± 20.0 | 54.6 ± 20.3 | 2.5 (−5.3, 10.4) | |
| Change from baseline (mean ± SD) | 8.2 ± 21.9 | 10.3 ± 15.2 | −0.0 (−6.7, 6.6) | 0.991 |
| Relative change from baseline (mean ± SD) | 89.0 ± 440.7 | 34.9 ± 64.5 | 79.1 (−40.0, 198.2) | 0.191 |
Sleep quality, mood, and alertness were assessed by placing an “X” along a 100 mm visual analog scale, so that their responses could be measured along a 0–100 range.
Safety
Seven AEs were reported in 106 subjects: five in the active group and two in the sham group. There were no statistically significant differences between active and sham on AEs. For a comparison of overall AEs, the p-value was 0.438. For the comparison of device-related AEs, the p-value was 0.618. No serious AEs were reported. The most common AE was headache, three in the active group and one in the sham. All AEs resolved without effects or intervention (Table 5).
Adverse Events
| Adverse event | Forehead sleep system (N = 54) N (%) | Vestibular sleep system (N = 52) N (%) |
|---|---|---|
| Headache | 3 (5.6%) | 0 (0.0%) |
| Strep throat | 0 (0.0%) | 1 (1.9%) |
| Right knee contusion | 1 (1.9%) | 0 (0.0%) |
| Leg cramp | 1 (1.9%) | 0 (0.0%) |
| Pain at site of electrodes | 0 (0.0%) | 1 (1.9%) |
| Total AEs | 5 (9.3%) | 2 (3.8%) |
| Total − related AEs | 3 (5.6%) | 1 (1.9%) |
Total AEs refer to all adverse events observed in the trial irrespective of whether they were thought related to the device (active or sham). Related AEs refer to adverse events deemed possibly or probably related to the device (active or sham).
Discussion
These results demonstrate that acute two-night treatment with a novel medical device delivering frontal cerebral thermal therapy relative to a sham device improved objective measures of sleep induction in insomnia patients, increased the amount of time asleep in the first hour of the night, and was associated with a benign safety profile. While these effects were not seen in the two a priori outcome measures absolute minute change in latency to persistent sleep or absolute change in sleep efficiency, these effects were seen in the related endpoint measures relative change in latency to persistent sleep as well as in the absolute and relative changes in latency to stages 1 and 2 NREM sleep, all of which were highly correlated with the latency to persistent sleep. Sham effects were larger than placebo effects seen in other insomnia trials for sleep efficiency, as well as other supportive objective and subjective measures. While numerical increases from baseline on these measures were seen in the active condition, these changes were not statistically significantly different from those seen in the sham condition. Frontal cerebral thermal therapy therefore has a favorable risk/benefit profile in insomnia treatment, aiding physiological sleep onset comparable to that of alternative treatments while having a benign safety profile. While hypnotics are effective in inducing sleep, clinicians are concerned about AEs [25] and while behavioral treatments for insomnia are effective [11, 22], the lack of trained clinicians, the duration and cost of sessions limit their widespread use [47].
Frontal cerebral thermal therapy had effects comparable to meta-analytic effects of hypnotics in improving the latency to sleep [21, 48, 49]. This is even though these meta-analyses summarized effects at some doses higher than those currently recommended by FDA. These effects correlated with changes in the subjective perception of sleep latency. The results of this study, therefore, suggest that the clinical benefit observed with frontal cerebral thermal therapy treatment would be similar in clinical practice to that observed for hypnotic drugs. Results differed minimally as a function of how sleep latency was defined as these measures were highly intercorrelated. The totality of the data showed a high level of consistency, thereby demonstrating a reliable physiological impact on the process of sleep initiation. The Co-Primary outcome measure “latency to persistent sleep” (requiring at least a 10 minute period of uninterrupted sleep following the onset of the first sleep period) showed significant differences when analyzing relative changes from baseline but not when analyzing absolute changes from baseline. The measure “sleep latency” showed highly statistically significant differences between groups when analyzing either absolute or relative changes from baseline. The data for latency to stage 1 sleep were nearly identical to those of the measure “sleep latency” likely related to the fact that stage 1 sleep is generally the first stage of sleep an individual enters. Frontal cerebral thermal therapy shortened the latencies not only to lighter stage 1 NREM sleep, but to deeper stage 2 NREM sleep, and trending to stage 3 NREM sleep. The device also increased the total minutes of sleep in the first hour of the night. High correlations between these measures of sleep latency and the measure latency to persistent sleep were noted. Across all measures, therefore, the device had a meaningful impact on accelerating the discharge of sleep drive in insomnia patients. These findings, while not a direct test of a mechanism of action, are consistent with the theoretical model of the device reversing abnormal hypermetabolism in the frontal cortex of insomnia patients, thereby allowing them to descend more rapidly into the deepest, most restorative aspects of sleep, when metabolism in the frontal cortex would be expected to be at its lowest [27].
These improvements in sleep latency were seen in the presence of a benign safety profile. The most common AEs were headache in 3/54 (5.6 per cent) of the active group. This is less than the 7–30 per cent rate of headache AEs reported in hypnotic trials and less than the 18 per cent incidence of headache reported in the insomnia population [50, 51].
Whether the device has effects on sleep maintenance is inconclusive given the large sham effect seen in this study. The device increased sleep time in the first hour of the night. The improvement for the active condition from baseline in sleep efficiency was notable (a 12.3 per cent absolute improvement or 20 per cent relative improvement) and comparable to improvements in sleep efficiencies from baseline reported for both hypnotics and cognitive behavior therapy [22, 52]. Unexpectedly, there was a large sham effect noted (10.4 per cent absolute improvement or 17 per cent relative improvement in relation to baseline) that was larger than that reported for placebos in both hypnotic and cognitive behavior therapy trials [22, 52]. The hour-by-hour analysis of sleep (Figures 3 and 4) reveals that, at baseline, the insomnia patients in both groups had predominantly sleep onset problems with milder sleep maintenance problems across the night. The median minutes of sleep from hours 2 through 8 on both active and sham devices were above a theoretical 85 per cent sleep efficiency set point, which is considered a lower threshold for a healthy sleeper. A ceiling effect may have prevented any separation between groups. Additional studies using larger sample sizes in patients with more severe sleep maintenance problems are needed to clarify the impact of the device on sleep maintenance measures. Future studies are required to determine if middle of the night applications of the device may benefit individuals who only have sleep maintenance problems.
It is unclear why a vestibular stimulation sham had effects larger than anticipated based on placebo effects in hypnotic and CBTI trials [22, 52]. A psychological expectation may have inflated the sham effect for some individuals. In this study, subjects were informed that they would be randomized to treatment with one of two active treatments. In contrast, in hypnotic trials, subjects are informed that they may receive treatment with either an active medication or an inactive placebo pill. The treatment expectation questionnaire results confirmed that patients were not aware that one device was active and the other a sham. Regression to the mean may account for some of the elevated sham effect although this would not be a complete explanation for why the sham effect in this study was larger than that seen for placebos used in hypnotic. The sham group may have benefited from extra care and attention from staff related to application of a medical device for the treatment of their insomnia.
In general, the results of subjective sleep measures analyses tended to parallel the PSG findings for sleep latencies and other sleep effects and improvements in subjective sleep latency was highly correlated with improvements in the co-primary endpoint measure latency to persistent sleep. Subjects’ estimates of their latencies to sleep showed increases that were greater in the active vs. sham comparison while not reaching the level of statistical significance noted in the objective measures. The self-reported morning questionnaire measures of sleep quality, subjective mood, and subjective alertness all showed similar patterns and increases in subjective alertness trended to be significantly better in the active group. In each case, baseline abnormalities in the sham group were numerically worse in the sham group than in the active group raising the possibility that the sham group was more prone to regression to the mean effects. In each case, these measures showed nearly identical levels of improvement from baseline between active and sham conditions when measured in absolute terms, but when taken as a percent improvement in relation to baseline values, each trended toward significant improvements in the active over sham conditions. The current results on lack of significance in improvement in these subjective measures based on two-night use in a sleep research laboratory require additional study in larger populations during in home use over longer durations prior to determining whether the device improves these measures in environments that more closely simulate clinical practice. In terms of clinical relevance, subjects being treated with the active device would be expected to feel that their sleep is improved with less morning tension, and greater morning alertness, although based on this study, the improvement they experience cannot be attributed solely to the device itself as a significant sham effect was also noted.
Several clinical implications and directions for future research for this therapy can be considered. First, this was a trial of only the acute effects of the device. Longer term trials are needed to determine the durability of effects and longer-term safety of the device. This therapy could be appropriate for insomnia patients who prefer a non-pharmaceutical approach, who are not able to participate in behavioral therapy or who are concerned about potential short-term and long-term adverse effects of hypnotics. Given its distinct mechanism of action, this treatment could be used as an adjunctive therapy to existing treatments. Since this treatment is not ingested like a pill, but rather is time-limited to the period of application, this treatment may be useful for the treatment of insomnia in patients who are concerned about lingering effects of medications that could impair their levels of arousal and motor performance at unwanted times, for example mothers of young children, airline workers, and military personnel. The current results demonstrate that the device predominantly effects the sleep onset process. Sleep onset problems, as defined in the inclusion criteria for this study (sleep latency greater than 15 minutes), are present in about one half (about 150 million individuals) of the general population in the United States [53]. Patients with sleep maintenance problems would be expected to experience benefit from the device although this benefit cannot entirely be attributed to the device as a significant sham effect on sleep maintenance was seen.
In summary, a novel device delivering frontal cerebral thermal therapy for two nights showed effects on sleep induction comparable to results of current hypnotic treatments as reported in meta-analyses and had a benign safety profile. Hypnotics have primarily shown efficacy on sleep latency but have well-known side effects while frontal cerebral thermal therapy showed similar levels of acute efficacy on sleep induction without significant side effects. The effect sizes for frontal cerebral thermal therapy for improving sleep induction were robust and reliable across multiple sleep latency measures and were comparable to placebo-corrected effect sizes reported for hypnotics. Effects on sleep maintenance and subjective sleep quality are inconclusive given the small sample size of this study as well as larger than expected sham effects noted on these measures. Longer duration studies are needed.
Funding
This study was funded by grants from the National Heart Lung and Blood Institute (grant numbers 1R43HL097537 and 2R44HL097537) and by the manufacturer of the device, Ebb Therapeutics, which provided all devices used in this trial.
Other disclosures for other investigators listed here
Nofzinger is founder, director, chief medical officer, Ebb Therapeutics; Roth: consultant to Ebb Therapeutics, Merck, Jazz, Philips, Flamel, SEQ Pharmaceutical, Pernix, Novartis, research funding from Ebb Therapeutics; Mayleben: Research funding from Ebb Therapeutics, Merck, Eisai, Jazz. Feldman: research funding from Ebb Therapeutics, Inspire, Jazz, Apnicure. Lankford: research funding from Ebb Therapeutics. Grant: research funding from Ebb Therapeutics, Merck.
Notes
Conflict of interest statement. All authors have completed and submitted the ICMJE Form for Disclosure of Potential Conflicts of Interest. Also, the frontal cerebral thermal therapy technology has been licensed to Ebb Therapeutics, and both Dr. Nofzinger and the University of Pittsburgh have contractual rights to receive future royalties from this license. But to date, no royalties have been received.
Acknowledgments
The authors gratefully acknowledge the contributions of the staffs at the centers where the participants were recruited and studied, the staff at Henry Ford Health System where the sleep records were scored, Lashlee Design and Consulting for providing data management, NAMSA for providing data analysis and statistical support, and the staff at Ebb Therapeutics, who developed the devices for use in the study and who managed the multicenter trial. Finally, we thank the participants for allowing us to work with them on this study.
References


Comments