


Abstract
Why do foreign-born immigrant workers often concentrate in low-wage, minority-dense workplaces? Do immigrants’ native-born children—who typically acquire better language skills, education, and country-specific knowledge—experience improved access to workplaces in the mainstream economy? Using economy-wide linked employer–employee administrative data from Norway, we analyze both ethnic and economic workplace segregation across immigrant generations. We find that, on average, 32% of immigrants’ coworkers and 16% of second-generation immigrants’ coworkers have immigrant backgrounds, compared to 7% for natives. In terms of economic segregation, the average percentile rank of coworkers’ salaries is 36, 49, and 52 for immigrants, children of immigrants, and natives, respectively. A formal decomposition analysis shows that differences in employee, workplace, and residential location characteristics collectively explain 54–74% of ethnic and 79–84% of economic workplace segregation for immigrants and their children. Key factors driving this segregation in both immigrant generations include education, occupational attainment, industry of employment, having an immigrant manager, and the concentration of immigrant neighbors. This suggests that both skill-based sorting and network-related processes contribute to immigrant–native workplace segregation. However, children of immigrants’ improved access to less immigrant-dense and higher-paying workplaces, compared to immigrants, is primarily driven by differential skill-based sorting (i.e., higher education and shifts in occupation and industry placement). Our findings reveal a sharp decline in workplace segregation relative to natives as children of immigrants advance into the mainstream economy, highlighting the central role of assimilation in skill profiles for workplace integration across immigrant generations.
Introduction
Newcomer immigrants from low-income countries, who often arrive with limited formal qualifications, tend to find work in low-wage segments with high concentrations of ethnic minorities and physically demanding, unskilled jobs that natives defer (Alba and Foner 2015, Friberg and Midtbøen 2019, Heath and Cheung 2007, Piore 1979, Waldinger and Lichter 2003). Early immigrants’ initial clustering within specific occupations, industries, and geographic areas often leads to high workplace concentrations in immigrant niches of the economy (Andersson et al. 2014, Model 1993, Waldinger and Lichter 2003, Wilson and Portes 1980). Consequently, later-arriving immigrants from the same national origins tend to disproportionately work for employers where their more established compatriots are already employed (Andersson et al. 2014, Bygren 2013, Glitz 2014, Åslund and Skans 2010). How these segregating processes play out in the long run is less well understood, but Waldinger and Lichter (2003: 8), for example, claim that “[f]or awhile—the period often coincides with the working life of the migrant’s generation—the newcomers work in the jobs for which they were recruited; however, their children are almost always oriented towards better prospects.” Still, the extent to which workplace segregation between immigrants and natives persists across generations remains an open question.
Immigrants’ lack of workplace integration with natives represents structural barriers to broader societal incorporation, as workplaces are key sites for social interaction and the distribution of status, jobs, and economic resources (Baron and Bielby 1980, DiTomaso, Post and Parks-Yancy 2007, Stainback, Tomaskovic-Devey and Skaggs 2010, Tomaskovic-Devey and Avent-Holt 2019). Neo-assimilation theory suggests that gradual progress across immigrant generations will gradually reduce ethno-racial boundaries and disparities in life chances relative to natives (Alba and Nee 2003, Alba, Kasinitz and Waters 2011, Drouhot and Nee 2019). However, proponents of segmented assimilation theory argue that less-resourced, racially distinct immigrant minorities are at risk of enduring disadvantages in the bottom segments of an ethnically stratified economy (Haller, Portes and Lynch 2011, Portes and Rumbaut 2014, Zhou and Gonzales 2019). In everyday life, assimilation involves inclusion in the mainstream of society, that is the social settings where non migrant majority populations traditionally have dominated (Alba and Nee 2003). In this regard, workplaces constitute such a key organizational setting for adults (Baron and Bielby 1980, Blau 1977, Tomaskovic-Devey and Avent-Holt 2019), where immigrants and natives spend much of their time, establish interethnic friendships, and negotiate the salience of ethnic group boundaries. In this study, we argue that minority workers’ improved access to workplaces in a broadly defined mainstream economy—characterized by higher wages and lower immigrant concentration—is a key metric of economic and social assimilation across immigrant generations.
Prior research using linked employer–employee data quantifies immigrants’ strong propensity to work together, especially with compatriots, and point to sorting across industries, language skills, and residential segregation as key drivers of this concentration (Andersson et al. 2014, Glitz 2014, Strömgren et al. 2014, Åslund and Skans 2010). However, the social dynamics of workplace segregation relative to natives in the second generation remain underexplored. A series of recent studies also show that immigrants’ sorting into lower-paying workplaces is a key factor explaining why they earn less than natives (Arellano-Bover and San 2023, Aydemir and Skuterud 2008, Barth, Bratsberg and Raaum 2012, Dostie et al. 2021, Han and Hermansen 2024, Melzer et al. 2018, Tomaskovic-Devey, Hällsten and Avent-Holt 2015), but evidence on children of immigrants is still limited (Han and Hermansen 2024, Melzer et al. 2018). As a consequence, the current literature on immigrants’ intergenerational labor market progress (e.g., Bratu and Bolotnyy 2023, Bucca and Drouhot 2024, Hermansen 2016) has yet to fully integrate workplace segregation as an empirical dimension of key theoretical relevance.
Drawing on economy-wide linked employer–employee data from Norway, we ask not only what factors explain why many immigrants of disadvantaged origins often work together in low-wage workplaces but also whether and why the second generation move out of workplaces in these immigrant-dense labor market niches and into the mainstream economy. We conceptualize ethnic and economic segregation as the unequal distribution of immigrants and children of immigrants, relative to natives, across workplaces that vary both in the share of immigrant coworkers and wage levels. Assimilation across immigrant generations is understood as the degree to which the distribution of workplace characteristics among children of immigrants converges with that of natives, in contrast to the more distinct distributional differences typically seen among immigrants. Our analysis zooms in on workplace segregation and assimilation immigrant minorities of non Western origin, who often arrive with limited formal education, distinct ethnoracial characteristics, and face elevated risks of enduring labor market disparities across generations (Alba and Foner 2015).
We make several contributions to the literature. First, unlike previous studies focusing exclusively on immigrants (Andersson et al. 2014, Glitz 2014, Strömgren et al. 2014, Åslund and Skans 2010), we conduct a double comparison. We begin by examining workplace segregation relative to natives among immigrants and children of immigrants, identifying the factors that explain this immigrant–native segregation. We then analyze the drivers behind why children of immigrants have better access to mainstream workplaces compared to the immigrant generation. Second, our combined focus on ethnic and ethnic segregation extends the literature by systematically exploring the interplay of these dimensions in workplace sorting across immigrant generations. Third, we use decomposition techniques to quantify the relative contribution of a rich set of characteristics of individual workers, employers, and residential locations to patterns of workplace segregation and assimilation between immigrants, children of immigrants, and natives. This includes the presence of immigrant managers, fine-grained occupational sorting, and detailed measures of industry of employment, residential segregation, and workers’ education, intermarriage, and other demographic traits.
Workplace Segregation Between Immigrants and Natives
To inform our empirical analysis of workplace segregation between immigrant minorities and natives, we differentiate between theories that emphasize (1) skill-based worker sorting; (2) social network dynamics, information flows, and residential segregation; and (3) labor market segmentation, occupational labeling, and employer discrimination. Below, we outline the empirical implications of these theories for our decomposition analysis of the factors driving workplace segregation across immigrant generations.
Skill-based worker sorting
Skill-based worker sorting is likely a significant contributor to workplace segregation between immigrants and natives. For example, Håkanson et al. (2021) show that between-firm sorting by cognitive and non-cognitive skills has become increasingly important in the Swedish labor market. Similar trends of worker sorting and rising between-firm earnings inequality have been documented in both Europe and North America (Song et al. 2019, Tomaskovic-Devey et al. 2020). Skill-based sorting reflects employer demand for specific competencies, such as differences in the skills needed to fill low-skilled routine jobs and high-skilled professional occupations. If employers hire employees with similar skill profiles, this would be a key mechanism underlying immigrant–native workplace segregation. To account for the role of skill-based sorting, we incorporate measures of productivity-related human capital differences, using both traditional indicators, such as formal education and occupation, and more detailed industry-specific skills.
Host-country language proficiency is a fundamental form of human capital for immigrants, since understanding (native) coworkers or customers is essential in most workplaces (Chiswick and Miller 2009, Dustmann and Soest 2002). Shared language and cultural similarities can enhance productivity among (immigrant) coworkers by reducing communication barriers and transaction costs, which may incentivize employers to hire (immigrant) employees who speak the same language or come from the same country (Lazear 1999). Previous research has documented workplace segregation patterns consistent with language-based sorting among immigrants in Germany and the United States (Andersson et al. 2014, Glitz 2014, Hellerstein and Neumark 2008). If employers hire immigrants because of productivity gains linked to better communication in a shared non-native language, we expect a marked tendency of immigrants to work alongside compatriots from the same origin country.
Network dynamics and residential segregation
Network theories emphasize how information flow within social networks match workers to jobs (Granovetter 1995). Research shows that people tend to interact with others who resemble themselves outside of work and often find employment through personal contacts (McPherson, Smith-Lovin and Cook 2001, Topa 2011). Several studies also report a strong reliance on personal contacts and coethnic referral networks among immigrant workers (Dustmann et al. 2016, Elliott 2001, Goel and Lang 2019, Åslund, Hensvik and Skans 2014). In addition, immigrant and minority managers often recruit employees of the same national origin or ethnoracial group (Giuliano and Ransom 2013, Kerr and Kerr 2021, Åslund, Hensvik and Skans 2014). Furthermore, intermarriage with natives may offer immigrants greater access to job-relevant networks, facilitating better access to mainstream workplaces (Strömgren et al. 2014). Network-based recruitment imply that workplaces with immigrant managers are likely to hire workers of immigrant background, while interethnic unions may provide better access to contacts in mainstream workplaces. Accounting for these factors is important in explaining workplace segregation between immigrant and native workers.
Residential segregation structures the diffusion of information and access to jobs, and since immigrants tend to concentrate geographically, their (immigrant) neighbors are likely to be key providers of job referrals (Iceland 2009, Ioannides and Loury 2004). In the US, there is a strong link between immigrants’ neighborhoods of residence and the industries and locations of their workplaces (Ellis, Wright and Parks 2004). Studies using linked employer–employee data show that living in the same census tract is strongly associated with working in the same establishment among immigrants and, in the US, native-born Hispanics with limited English proficiency (Andersson et al. 2014, Bayer, Ross and Topa 2008, Hellerstein, McInerney and Neumark 2011, Strömgren et al. 2014). Consequently, residential segregation—particularly the local share of immigrant neighbors—should play a central role in shaping workplace segregation between immigrants and natives.
Ethnic segmentation, queuing, and discrimination
The sorting of immigrant and native workers across workplaces is, however, not solely a function of skill sorting and network dynamics but may also reflect differences in social status and employer discrimination. According to segmented labor market theory (Doeringer and Piore 1971, Piore 1979), natives may defer certain types of work not only because of low pay but also due to the inferior status these jobs are associated with. In contrast, immigrants are often willing to accept these low-status jobs due to their “dual frames of reference” and limited alternative options in the labor market (Piore 1979, Waldinger and Lichter 2003). Additionally, processes of job labeling, where employers come to prefer members of specific minority groups to fill certain types of work in particular segments of the labor market (Friberg and Midtbøen 2019, Moss and Tilly 2001, Waldinger and Lichter 2003), may further contribute to workplace segregation through the sorting of immigrants into distinct occupational and industrial niches.
Employer discrimination against minority job seekers is well-documented and often persists into the second generation (Quillian et al. 2019). In line with queuing theory (Reskin and Roos 1990), discriminatory hiring practices can steer immigrant applicants into low-status occupations labeled as “migrant jobs,” while natives are funneled into higher-status “native jobs,” thereby contributing to workplace segregation (Ruhs and Anderson 2010, Waldinger and Lichter 2003). Following this logic, market segments dominated by natives may exhibit higher levels of ethnic discrimination, limiting immigrants’ access to better-paying firms. In contrast, immigrants may face less discrimination in immigrant-dense market segments, where minority workers are in greater demand. This dynamic can further reinforce immigrants’ overrepresentation in lower-paying workplaces outside the mainstream economy (Bursell and Bygren 2023).
Assimilation and segregation across immigrant generations
The segregating processes discussed above are likely affect both immigrants and their native-born children, though they may be less pronounced in the second generation. Standard explanations of economic assimilation across immigrant generations emphasize the role of improved country-specific human capital, such as children of immigrants’ acquisition of native-level language proficiency, cultural knowhow, and domestic education and qualifications (Drouhot and Nee 2019, Heath, Rothon and Kilpi 2008). Moreover, members of the second generation often shift their frames of reference from their parents’ country of origin to their own country of birth, which can lead them—like natives—to “devalue and disparage and finally reject the occupations that their parents’ generation performed” (Piore 1979:131). Because of their improved human capital, skill-based factors (i.e., education and occupation) and changes in sorting across industries (i.e., access to broader segments of the economy) should be central to explaining of children of immigrants’ better access to mainstream workplaces.
In contrast, ethnic boundaries in social networks—as captured by residential segregation (Hermansen, Hundebo and Birkelund 2022, McAvay 2018) and intermarriage (Hannemann et al. 2018, Wiik, Dommermuth and Holland 2021)—often persist in the second generation. If the pace of social integration lags behind generational improvements in human capital (Drouhot and Nee 2019), lack of shared job-related networks with natives may still constitute significant barriers. If children of immigrants converge with natives in skill-based dimensions but remain embedded in ethnic communities, network-based factors may—in relative terms—contribute more immigrant–native workplace segregation in the second generation but less to differences in workplace sorting relative to immigrants.
Immigrants in the Norwegian Labor Market
Norway is representative of Europe’s increasingly diverse host societies (OECD 2022). The Norwegian population’s share of immigrants and their native-born descendants grew from 1.5% in 1970 to 21% today (Statistics Norway 2024). Non-European immigration began with labor migration from Pakistan, Turkey, and Morocco in the late 1960s, but in 1975, a moratorium—later made permanent—on unskilled labor immigration was introduced (Brochmann and Kjeldstadli 2008). After 1975, admission to Norway for migrants from low-income countries was primarily restricted to humanitarian grounds and family reunification. Beginning in the late 1970s, refugees and asylum seekers from conflict areas—including Vietnam, Chile, Sri Lanka, and Iran (1980s), the Balkans (early 1990s), and Iraq and Somalia (late 1990s)—grew substantially. Following the enlargements of the European Union in the 2000s, labor migration from new Eastern European member countries surged, with Polish immigrants now forming the largest immigrant minority in Norway (Brochmann and Kjeldstadli 2008).
Immigrants from non-Western origin countries often concentrate in industries dominated by manual and routine occupations, where wages tend to be low, such as construction, food processing, hotels, restaurants, and cleaning (Bratsberg, Raaum and Røed 2014, Friberg and Midtbøen 2019, Østbakken, Orupabo and Nadim 2023). In contrast, second-generation immigrants have made considerable intergenerational progress in education and the labor market, although ethnic disadvantages in access to employment persist (Borgen and Hermansen 2023, Hermansen 2016, Lillehagen and Birkelund 2022, Quillian et al. 2019). However, social integration progresses more slowly, as children of immigrants often settle in immigrant-dense neighborhoods as adults and tend to partner with coethnics (Hermansen, Hundebo and Birkelund 2022, Wiik, Dommermuth and Holland 2021).
Data, Measures, and Analysis Strategy
We use linked employer–employee administrative data covering all employees and formal jobs in the entire Norwegian workforce.1 A system of unique identifiers for individuals and establishments allows us to link each employee to their respective employer. These microdata include detailed information on immigrant background, including nativity, age at arrival, and country of origin, as along with data on education, occupation, intermarriage, the neighborhood of residence, and other sociodemographic characteristics. Our measure of workplaces refers to distinct establishments; these actual workplace contexts are different from the firm level except for single establishment firms. These data include information on the industry and sector of the establishment, and also enables the measurement of organizational demographic composition derived from characteristics of the employees.
We restricted our sample to employees between 25 and 70 years old in 2018. The sample includes employees with native backgrounds (i.e., individuals with two Norwegian-born parents) and immigrant backgrounds (i.e., individuals either born abroad or in Norway with two foreign-born parents). Individuals of mixed background (i.e., one Norwegian-born and one foreign-born parent) are excluded. Our focus is on immigrant minorities from non-Western origin countries, which includes Eastern Europe, Africa, Asia, and Latin America. Additionally, we restrict our focus to the best-paid job an individual holds annually if they are registered with multiple jobs and exclude all establishments with only one employee. Finally, observations without information on key variables were excluded. This leaves us with an analytic sample of 1,773,218 employees across 136,750 unique establishments.
Table 1 presents summary statistics separately for non-migrant natives (n = 1,528,360), immigrants (n = 222,270), and children of immigrants (n = 22,588). Table 2 presents correlation matrices by immigrant background for the variables used in the analysis. Online Appendix Tables A1–A2 present summary statistics separately by country of origin.
Summary statistics for analytic sample.
| Immigrants | Children of immigrants | Natives | |
|---|---|---|---|
| (1) | (2) | (3) | |
| Proportion of immigrant coworkers from all origin countries | |||
| Mean | 32.1 | 16.3 | 7.1 |
| Std. dev. | 29.2 | 20.1 | 10.8 |
| Proportion of immigrant coworkers from other origin countries | |||
| Mean | 21.8 | 14.3 | 7.1 |
| Std. dev. | 21.8 | 16.9 | 10.8 |
| Coworker salary rank (percentiles, 0–100) | |||
| Mean | 36.3 | 49.4 | 52.4 |
| Std. dev. | 26.9 | 29.6 | 28.4 |
| Employee characteristics | |||
| Age | |||
| < 30 | 0.111 | 0.406 | 0.325 |
| 30–39 | 0.394 | 0.466 | 0.420 |
| 40–50 | 0.312 | 0.112 | 0.444 |
| > 50 | 0.183 | 0.016 | 0.486 |
| Female | 0.462 | 0.486 | 0.500 |
| Intermarriage | |||
| Not married | 0.364 | 0.578 | 0.423 |
| Married to native | 0.162 | 0.085 | 0.537 |
| Married to immigrant | 0.474 | 0.338 | 0.040 |
| Education | |||
| No Education | 0.009 | 0.000 | 0.000 |
| Elementary school | 0.027 | 0.000 | 0.000 |
| Lower secondary school | 0.193 | 0.192 | 0.125 |
| Some upper secondary school | 0.023 | 0.006 | 0.061 |
| Completed upper secondary school | 0.249 | 0.250 | 0.310 |
| Non-tertiary postsecondary education | 0.014 | 0.023 | 0.044 |
| Tertiary education, BA or equivalent | 0.194 | 0.336 | 0.326 |
| Tertiary education, MA or equivalent | 0.125 | 0.180 | 0.123 |
| Tertiary education, PhD level | 0.027 | 0.005 | 0.010 |
| Missing | 0.140 | 0.008 | 0.001 |
| Occupation | |||
| Managers | 0.026 | 0.056 | 0.106 |
| Professionals | 0.094 | 0.189 | 0.182 |
| Technicians and associate professionals | 0.122 | 0.285 | 0.273 |
| Clerical support workers | 0.055 | 0.089 | 0.062 |
| Service and sales workers | 0.279 | 0.272 | 0.194 |
| Skilled agricultural, forestry, fishing workers | 0.005 | 0.000 | 0.005 |
| Craft and related trades workers | 0.138 | 0.042 | 0.082 |
| Plant and machine operators, and assemblers | 0.101 | 0.038 | 0.064 |
| Unskilled elementary occupations | 0.178 | 0.024 | 0.026 |
| Armed forces or no occupation reported | 0.000 | 0.003 | 0.006 |
| Workplace characteristics | |||
| Establishment size | |||
| 2–9 employees | 0.153 | 0.136 | 0.144 |
| 10–49 employees | 0.349 | 0.306 | 0.366 |
| 50–99 employees | 0.156 | 0.143 | 0.154 |
| 100–499 employees | 0.246 | 0.239 | 0.215 |
| 500+ employees | 0.096 | 0.175 | 0.120 |
| Establishment age | |||
| 1 year or less | 0.018 | 0.014 | 0.012 |
| 2–4 years | 0.096 | 0.080 | 0.057 |
| 5–9 years | 0.136 | 0.137 | 0.099 |
| 10–19 years | 0.253 | 0.257 | 0.228 |
| 20+ years | 0.496 | 0.511 | 0.604 |
| Industry | |||
| Manufacturing (153 detailed industries) | 0.112 | 0.052 | 0.109 |
| Transportation, communication, utilities (56 detailed industries) | 0.233 | 0.231 | 0.163 |
| Retail (94 detailed industries) | 0.071 | 0.032 | 0.064 |
| Finance, Insurance, Real Estate (23 detailed industries) | 0.072 | 0.103 | 0.094 |
| Services (80 detailed industries) | 0.512 | 0.583 | 0.570 |
| Public sector | 0.307 | 0.365 | 0.436 |
| Immigrant manager | 0.129 | 0.104 | 0.010 |
| Neighborhood characteristics | |||
| Neighborhood network index | |||
| Mean | 0.032 | 0.010 | 0.024 |
| Std. dev. | 0.089 | 0.047 | 0.069 |
| Neighborhood proportion immigrant residents | |||
| Mean | 0.205 | 0.286 | 0.108 |
| Std. dev. | 0.163 | 0.195 | 0.088 |
| Neighborhood proportion with employment | |||
| Mean | 0.875 | 0.868 | 0.889 |
| Std. dev. | 0.050 | 0.043 | 0.031 |
| Neighborhood proportion with higher education | |||
| Mean | 0.332 | 0.356 | 0.333 |
| Std. dev. | 0.133 | 0.138 | 0.135 |
| Number of person observations | 222,270 | 22,588 | 1,528,360 |
Note: The unit of observation is individual workers.
Correlation matrix between measures of workplace composition and other variables used in analysis.
| All | Immigrants | Children of immigrants | Natives | ||||||||||
|---|---|---|---|---|---|---|---|---|---|---|---|---|---|
| 1 | 2 | 3 | 1 | 2 | 3 | 1 | 2 | 3 | 1 | 2 | 3 | ||
| 1 | Coworker immigrant share, all origin countries | 1.00 | 1.00 | 1.00 | 1.00 | ||||||||
| 2 | Coworker immigrant share, other origin countries | 0.88 | 1.00 | 0.72 | 1.00 | 0.93 | 1.00 | 1.00 | 1.00 | ||||
| 3 | Coworker salary rank | −0.30 | −0.30 | 1.00 | −0.38 | −0.38 | 1.00 | −0.40 | −0.39 | 1.00 | −0.23 | −0.23 | 1.00 |
| 4 | Age | −0.07 | −0.05 | 0.04 | −0.01 | −0.02 | 0.05 | −0.03 | −0.04 | 0.15 | 0.00 | 0.00 | 0.01 |
| 5 | Female | −0.02 | 0.01 | −0.21 | −0.15 | 0.00 | −0.13 | 0.00 | 0.02 | −0.07 | 0.03 | 0.03 | −0.23 |
| 6 | Intermarriage: Not married | 0.03 | 0.01 | −0.03 | 0.13 | −0.01 | −0.03 | −0.02 | −0.01 | −0.10 | 0.03 | 0.03 | −0.03 |
| 7 | Intermarriage: Married to non-migrant native | −0.17 | −0.13 | 0.06 | −0.15 | −0.07 | −0.01 | −0.10 | −0.09 | 0.09 | −0.04 | −0.04 | 0.02 |
| 8 | Intermarriage: Married to immigrant | 0.25 | 0.21 | −0.06 | −0.01 | 0.07 | 0.04 | 0.08 | 0.07 | 0.05 | 0.03 | 0.03 | 0.04 |
| 9 | Educational attainment | −0.04 | −0.07 | 0.24 | −0.03 | −0.10 | 0.18 | −0.21 | −0.20 | 0.33 | −0.09 | −0.09 | 0.28 |
| 10 | Occupation: Managers | −0.10 | −0.09 | 0.31 | −0.19 | −0.13 | 0.38 | −0.15 | −0.14 | 0.32 | −0.06 | −0.06 | 0.29 |
| 11 | Occupation: Professionals | −0.13 | −0.11 | 0.13 | −0.18 | −0.12 | 0.24 | −0.15 | −0.14 | 0.21 | −0.07 | −0.07 | 0.10 |
| 12 | Occupation: Technicians and associate professionals | 0.00 | 0.01 | 0.01 | −0.05 | −0.02 | 0.06 | 0.01 | 0.02 | 0.01 | 0.02 | 0.02 | 0.00 |
| 13 | Occupation: Clerical support workers | 0.06 | 0.08 | −0.40 | −0.07 | 0.04 | −0.34 | 0.13 | 0.13 | −0.44 | 0.07 | 0.07 | −0.41 |
| 14 | Occupation: Service and sales workers | 0.00 | −0.01 | −0.03 | 0.00 | −0.02 | −0.04 | −0.01 | −0.01 | 0.00 | −0.01 | −0.01 | −0.02 |
| 15 | Occupation: Armed forces and skilled agricultural, forestry, fishing | 0.08 | −0.01 | 0.03 | 0.15 | −0.14 | 0.10 | 0.01 | 0.01 | 0.05 | 0.01 | 0.01 | 0.04 |
| 16 | Occupation: Craft and related trades workers | 0.06 | 0.05 | −0.02 | 0.07 | 0.07 | −0.02 | 0.13 | 0.12 | −0.03 | 0.03 | 0.03 | −0.01 |
| 17 | Occupation: Plant and machine operators, and assemblers | 0.24 | 0.23 | −0.15 | 0.20 | 0.24 | −0.21 | 0.15 | 0.13 | −0.10 | 0.11 | 0.11 | −0.09 |
| 18 | Occupation: Unskilled elementary occupations | −0.04 | −0.04 | 0.08 | −0.01 | −0.01 | 0.01 | −0.03 | −0.04 | 0.06 | −0.05 | −0.05 | 0.08 |
| 19 | Establishment size | −0.05 | −0.05 | 0.20 | −0.12 | −0.06 | 0.24 | −0.10 | −0.09 | 0.22 | −0.04 | −0.04 | 0.20 |
| 20 | Establishment age | −0.14 | −0.09 | 0.11 | −0.31 | −0.15 | 0.17 | −0.15 | −0.12 | 0.17 | −0.04 | −0.04 | 0.08 |
| 21 | Industry: Manufacturing | 0.01 | 0.00 | 0.14 | −0.02 | −0.09 | 0.16 | 0.00 | 0.00 | 0.10 | 0.03 | 0.03 | 0.15 |
| 22 | Industry: Transportation, communication, utilities | 0.07 | 0.08 | −0.13 | 0.07 | 0.11 | −0.17 | 0.19 | 0.15 | −0.27 | 0.04 | 0.04 | −0.12 |
| 23 | Industry: Retail | 0.02 | −0.03 | 0.06 | 0.11 | −0.09 | 0.10 | −0.01 | 0.00 | 0.08 | −0.02 | −0.02 | 0.06 |
| 24 | Industry: Finance, Insurance, Real Estate | −0.03 | −0.03 | 0.09 | 0.02 | 0.06 | 0.04 | −0.02 | −0.03 | 0.15 | −0.05 | −0.05 | 0.09 |
| 25 | Industry: Services | −0.05 | −0.03 | −0.07 | −0.12 | −0.02 | −0.03 | −0.15 | −0.11 | 0.07 | −0.01 | −0.01 | −0.09 |
| 26 | Public sector | −0.13 | −0.08 | −0.03 | −0.30 | −0.14 | 0.08 | −0.11 | −0.08 | 0.12 | −0.04 | −0.04 | −0.07 |
| 27 | Immigrant manager | 0.42 | 0.30 | −0.12 | 0.49 | 0.30 | −0.20 | 0.43 | 0.32 | −0.27 | 0.18 | 0.18 | −0.04 |
| 28 | Neighborhood network index | 0.06 | 0.00 | −0.16 | 0.15 | −0.02 | −0.10 | 0.21 | 0.09 | −0.14 | −0.01 | −0.01 | −0.16 |
| 29 | Neighborhood proportion of immigrant residents | 0.26 | 0.24 | 0.00 | 0.18 | 0.21 | −0.01 | 0.16 | 0.16 | −0.05 | 0.11 | 0.11 | 0.09 |
| 30 | Neighborhood proportion in employment | −0.13 | −0.11 | −0.06 | −0.11 | −0.10 | 0.00 | −0.11 | −0.11 | 0.05 | −0.04 | −0.04 | −0.11 |
| 31 | Neighborhood proportion with higher education | 0.01 | 0.02 | 0.25 | 0.00 | 0.03 | 0.17 | −0.09 | −0.08 | 0.17 | 0.02 | 0.02 | 0.26 |
Note: Pearson’s r correlation coefficients.
Variable measurement
We define immigrant background using individual and parental country of birth. We differentiate between three groups: (1) natives, defined as individuals with two Norwegian-born parents; (2) immigrants, defined as individuals born abroad to two foreign-born parents; and (3) children of immigrants, defined as individuals born in Norway to two foreign-born parents or individuals with two foreign-born parents who immigrated to Norway at age six or younger.2 Our primary analyses focus on the entire sample of immigrants and children of immigrants from non-Western countries, and we also conduct additional subgroup analyses by national origin.3 Given our interest in how workplace segregation varies across immigrant generations, we concentrate on the countries of origin with the largest number of working-age children of immigrants: Pakistan, Vietnam, Turkey, Bosnia, India, Chile, Iran, Kosovo, Sri Lanka, Morocco, and Poland, as well as a combined group of all remaining non-Western countries.
Measures of workplace segregation
Ethnic workplace segregation is measured by the differences in the share of immigrant coworkers between (children of) immigrants and natives. For an employee i working in establishment j, which has sj employees, this share is calculated as:
where Ik is an indicator of whether employee k has is (a child of) an immigrant of non-Western origin. Additionally, the index employee is excluded when calculating |${C}_{ij}$| (Andersson et al. 2014, Hellerstein and Neumark 2008, Åslund and Skans 2010). For large samples, and in the absence of systematic sorting across workplaces, the share of immigrant coworkers (|${C}_{ij}$|) equals the overall share of immigrants in the workforce across all workplaces and employees (Carrington and Troske 1997, Åslund and Skans 2009). This holds true whether the worker is an immigrant, a child of an immigrant, or a non-migrant native.
We calculate two versions of the coworker immigrant share (cf. Andersson et al. 2014; Åslund and Skans 2010). First, we measure the total share of immigrant coworkers from all non-Western countries. Second, we exclude immigrant coworkers from the same origin country as the index employee, thereby calculating exposure to immigrant coworkers from other countries (i.e., excluding coethnics). For native workers in a given workplace, both measures are identical, while the second measure of coworker immigrant share differs within workplaces for (children of) from different origin countries. By comparing exposure to all immigrant coworkers (including coethnics) with exposure to immigrant coworkers from other origin countries (excluding coethnics), we assess how much of (children of) immigrants’ exposure to immigrant coworkers is due to working with coethnics from the same country of origin versus working with immigrants from other origin countries.
Economic workplace segregation is calculated using the mean monthly salary of all employees in a workplace, excluding the index employee. Each employee is then ranked based on their mean coworker salary relative to all employees in our sample, regardless of age or gender. Similar to rank-ordered measures of individual earnings, this yields a symmetric variable that captures each individual’s percentile rank in the overall distribution of coworker salary means, ranging from 0 (lowest) to 100 (highest). This measure of coworker salary rank shares several properties with our measure for coworker immigrant share. Notably, in the absence of systematic sorting across workplaces by immigrant background, coworker salary rank should, in large samples, average around 50 for both (children of) immigrants and natives. Economic segregation is therefore defined as the difference in coworker salary rank between (children of) immigrants and natives.4
Employee, workplace, and neighborhood characteristics
Employee characteristics
Education is categorized into nine qualification levels, from primary education to doctoral degrees, with an additional category for individuals with no registered education. Detailed occupational information is based on the four-digit Norwegian version of the International Standard Classification of Occupations (ISCO), which distinguishes between ~350 occupations. Intermarriage is classified into three groups: (1) not married, (2) married to a native, and (3) married to an immigrant. We also control for age and gender.
Workplace characteristics
Establishment size is defined by the number of employees, and establishment age refers to the number of years since the establishment first appeared in the data. Industry classification follows four-digit codes from the Statistical Classification of Economic Activities in the European Community (NACE), which distinguishes around 400 detailed industries. We also differentiate between establishments in the public and private sectors. To capture the presence of immigrant managers, we use a dichotomous variable indicating whether the top earner in the establishment is a non-Western immigrant.
Neighborhood characteristics
We use the most disaggregated geographical unit in Norwegian administrative data—the basic statistical unit—to define neighborhoods. These units are designed to capture neighborhoods that are similar in building structure and location. There are ~14,000 basic statistical units in Norway, with an average number of ~350 residents, though this number is considerably higher in urban areas. Following Andersson et al. (2014), we calculate the proportion of each individual’s coworkers who live in the same neighborhood as themselves, which we refer to as the neighborhood network index. To measure ethnic residential segregation, we calculate the share of immigrant-origin residents in each neighborhood. Additionally, we include measures of the neighborhood’s share of adult residents with university education and the share in employment. To account for geographic sorting across local labor market regions, all regressions control for county of residence using one dummy for each county in Norway.
Decomposition of workplace segregation
We decompose workplace segregation by analyzing the contributions of employee, workplace, and neighborhood characteristics using a series of OLS regressions with (i) coworker immigrant share and (ii) coworker salary rank as outcome variables. To account for within-unit correlation between coworkers, we estimate Huber-White standard errors clustered at the establishment level. Following Andersson et al. (2014), we begin by estimating a set of basic regressions using these following specifications:
where |${C}_{ij}$| in Eq. (2) refers to the immigrant coworker share for person i in workplace j, as defined above. In Eq. (3), |${S}_{ij}$|refers to the coworker salary rank of person i in workplace j. In both equations, Ii refers to immigrant status, which is coded 0 for natives and 1 for (children of) immigrants, and countyij refers to a set of county-of-residence dummies. To decompose workplace segregation between immigrant generations, we exclude natives from the estimation sample and recode immigrant status (Iij) as 0 for children of immigrants and 1 for immigrants.
The coefficient |${\gamma}_I^{base}$| in Eqs. (2) and (3) gives the mean within-county difference in the given measure of workplace composition between (a) (children of) immigrants and natives or (b) immigrants and children of immigrants. These estimates serve as our baseline measures of between-group workplace segregation. Next, we add the vector xij, which includes all employee, workplace, and neighborhood characteristics. This provides us with our full model specification:
If the estimate for |${\gamma}_I^{main}$| in Eqs. (4) and (5) is smaller than |${\gamma}_I^{base}$| in Eqs. (2) and (3), the factors included in the vector xij partially explain the observed within-county workplace segregation experienced between (a) (children of) immigrants and natives or (b) immigrants and children of immigrants. To quantify the separate contribution of each factor, we decompose the explained part of the workplace segregation using the approach developed by Gelbach (2016). It is important to note that this decomposition does not allow for causal interpretation of the effects of the covariates in vector xij (Fortin, Lemieux and Firpo 2011).
We define |${\delta}_I=({\gamma}_I^{base}-{\gamma}_I^{main})$| as the share of workplace segregation explained by the covariates in xij (Andersson et al. 2014). Gelbach (2016) uses the equation for omitted variable bias to show that |${\delta}_I$| can be decomposed into K additive terms where |${\delta}_I^k={\beta}^{k, main}\times{\alpha}_I^k$| gives the contribution of the kth variable. The coefficients for |${\alpha}_I^k$| are estimated from K auxiliary regressions:
For a given employee, workplace, or neighborhood characteristic to substantively explain a part of the baseline workplace segregation, two conditions must be met. First, the given variable k needs to be (strongly) correlated (|${\beta}^{k, main}$|) with the coworker outcome, net of adjustment for other variables. Second, there must be substantial within-county differences (xk) between the compared groups for the variable k to account for observed workplace segregation.5
Results
Table 1 reveals substantial differences in workplace composition among natives, immigrants, and children of immigrants. Immigrants have the highest share of immigrant coworkers (32.1%), followed by children of immigrants (16.3%), who, in turn, have considerably higher shares of immigrant coworkers than natives (7.1%). When excluding coethnic coworkers from the measure, the share of immigrant coworkers among immigrants drops by ~10 percentage points (to 21.8%), indicating that about one-third of their immigrant coworkers are from the same origin country. In contrast, coethnics constitute a much smaller portion of the immigrant coworkers for children of immigrants, comprising only 2.0% of their total immigrant coworker share. Additionally, coworkers’ percentile salary ranks are considerably lower among immigrants (36.3) compared to natives (52.4), while children of immigrants (49.4) have coworker salary ranks similar to those of natives.
Table 1 also show that immigrants are less educated than natives and strongly overrepresented in blue-collar occupations. In contrast, children of immigrants show more similarity to natives in both educational attainment and occupational distribution. Moreover, both immigrant generations are distributed differently across industries compared to natives, though many of these differences occur at more granular levels than the five industry groups presented in Table 1. Finally, immigrants and children of immigrants are likely to have immigrant partners, work for immigrant managers, and reside in immigrant-dense neighborhoods.
The correlation matrix in Table 2 reveals a strong negative correlation between the overall share of immigrant coworkers and coworker salary rank for the full samples (r = −.30) and separately for immigrants (r = −.38), children of immigrants (r = −.40), and natives (r = −.23). Several factors are positively correlated with higher shares of immigrant coworkers, such as having an immigrant partner, working in several blue-collar occupations, being employed by an immigrant manager, and living in immigrant-dense neighborhoods. In contrast, coworker salary is positively associated with higher levels of education, employment in managerial and professional occupations, and having many highly educated neighbors.
Figure 1 displays the coworker immigrant share and coworker salary rank by occupational group (panel A) and selected industries (panel B) by immigrant background. Immigrants and children of immigrants have the highest exposure to immigrant coworkers in blue-collar occupations—such as unskilled elementary occupations, plant and machine operators, assemblers, service and sales workers—as well as among managers, likely reflecting employment in immigrant-owned establishments. Additionally, (children of) immigrants face high exposure to immigrant coworkers in industries such as restaurants and hotels, retail sale in food and fish processing. Within occupations and industries, immigrants and children of immigrants tend to have significantly higher exposure to immigrant coworkers compared to natives, though differences in coworker salary rank are less pronounced.
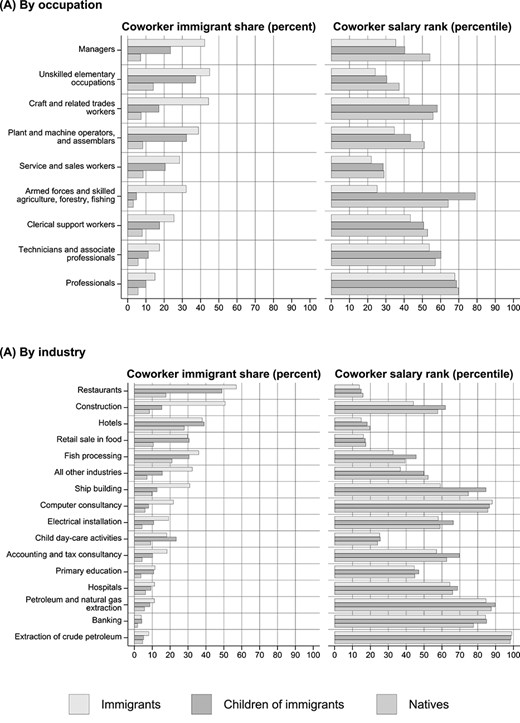
Share of immigrant coworkers and coworker salary rank by occupation and industry of employment separately for immigrants, children of immigrants, and natives. Note: Panel a shows the workplace composition within occupations (1-digit ISCO) by immigrant background. Panel B shows the workplace composition within industries (4-digit NACE) by immigrant background. The selected industries are the three largest 4-digit NACE industries within each of the five broad industry groups shown in Table 1 (manufacturing; transportation, communication, utilities; retail; finance, insurance, real estate; services). The occupations and industries are ranked according to the mean share of immigrant-background coworkers among immigrants.
Visualizing workplace sorting by immigrant generation
We use heat plots to compare the distribution of immigrants and their children to that of natives across workplace contexts. By focusing on whether children of immigrants gain improved access to workplaces in the mainstream economy—characterized by both lower shares of immigrant coworkers and higher wages—we evaluate the extent of multidimensional second-generation assimilation.6
Figure 2 presents heat plots of the bivariate joint distribution of coworker immigrant share (x-axis) and coworker salary rank (y-axis) separately for immigrants (panel A), children of immigrants (panel B), and natives (panel C). In each panel, bright yellow hexagons indicate areas in the joint distribution of workplace characteristics that have a comparatively high concentration of observations within each subpopulation, while dark green-blue areas represent parts of the joint distribution with correspondingly fewer observations. The red lines mark the median for each variable within each group of workers, and the histograms along each axis display the univariate distributions of each variable.7
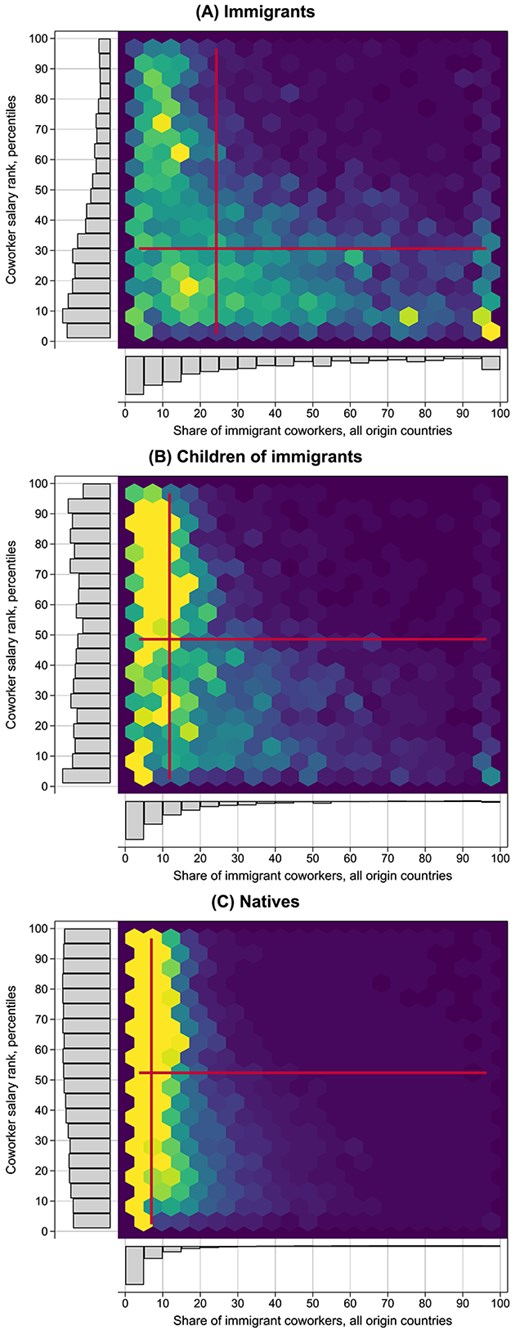
Heat plots of the joint distribution of the workplace share of immigrant coworkers and the coworker salary rank separately for immigrants, children of immigrants, and natives. Note: The color intensity of each hexagon cell describes the percentage of the total number of individual observations within each group in the given cell, from less than .0% (dark blue) to cells with 1% or more (bright yellow). The vertical and horizontal red lines in each plot refer to the median for each variable.
Figure 2 reveals a striking pattern of improved access to workplaces with more high-wage coworkers and fewer immigrant coworkers among children of immigrants compared to immigrants. As shown in panel A, immigrants tend to be concentrated in workplaces at the lower end of the coworker salary distribution (median = 30th percentile) with relatively high immigrant coworker shares (median = 22%). This is illustrated by the tail of brighter hexagons toward the bottom-right of panel A, indicating that immigrants in low-wage workplaces are also more likely to work alongside a disproportionate number of immigrant coworkers.
Turning to the second generation, the bright yellow hexagons found in the upper-left part of panel B indicate that many children of immigrants cluster in high-wage workplaces (median = 49th percentile) with fewer immigrant coworkers (median = 9%) compared to immigrants. Although the coworker salary ranks of children of immigrants are similar to those of natives (median = 53rd percentile), their share of immigrant coworkers remains higher than that of natives (median = 4%). However, a tail of green hexagons toward the bottom-right of the panel is also seen among children of immigrants, though less pronounced than for immigrants. This suggests that children of immigrants in low-wage workplace also tend to have disproportionately more immigrant coworkers.
The hear plots in Figure 3 shows that the pattern of improved representation of children of immigrants in higher-wage workplaces with fewer immigrant coworkers is largely universal across origin countries. For national-origin groups where immigrants are overrepresented in low-wage, immigrant-dense workplaces, the second generation tends to show a higher concentration in higher-paying workplaces with lower shares of immigrant coworkers, indicated by more bright yellow hexagons in the upper-left area of each plot. This pattern is particularly striking for the three largest origin countries—Pakistan, Vietnam, and Turkey—while the differences between immigrant parents and their children are smaller for groups where the immigrant generation is less concentrated in low-wage, immigrant-dense workplace contexts (e.g., Bosnia, India, Kosovo, and Chile). Interestingly, the tail of green hexagons in the lower-right part of each panel is present in both immigrant generations across most origin countries. Similar to immigrants, children of immigrants employed in low-wage workplaces also tend to have disproportionately more immigrant coworkers. However, as this pattern is observed across most origin countries, it appears to reflect increased internal heterogeneity within national-origin groups rather than heightened between-country stratification in the second generation.
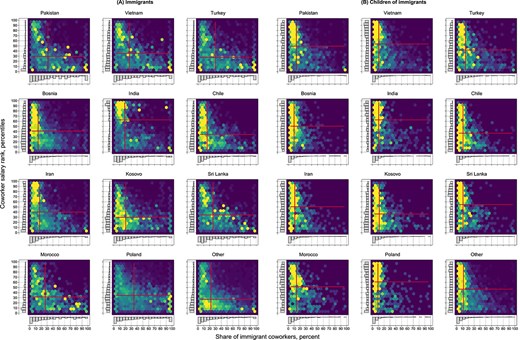
Heat plots of the joint distribution of the workplace share of immigrant coworkers and the coworker salary rank for immigrants and children of immigrants by country of origin. Note: The color intensity of each hexagon cell describes the percentage of the total number of individual observations within each group in the given cell, from less than 0% (dark blue) to cells with 1% or more (bright yellow). The vertical and horizontal red lines in each plot refer to the median for each variable.
Accounting for workplace segregation across immigrant generations
Table 3 provides estimates from the decomposition of workplace segregation for three comparisons: (1) immigrants relative to natives, (2) children of immigrants relative to natives, and (3) immigrants relative to children of immigrants. In each comparison, panel A shows the estimated baseline within-county gaps (|${\gamma}_I^{base}$|) and the full model estimates (|${\gamma}_I^{main}$|) using (i) exposure to immigrant coworkers from all origin countries, (ii) exposure to immigrant coworkers from other origin countries, and (iii) coworker salary rank. In panel B, each row quantifies the contribution of the different factors, showing the percentage of the total within-county gap explained by each set of covariates.
Contribution of employer, workplace, and neighborhood characteristics to workplace segregation between natives, immigrants, and children of immigrants from non-western origin countries.
| Immigrants versus natives | Children of immigrants versus natives | Immigrants versus children of immigrants | |||||||
|---|---|---|---|---|---|---|---|---|---|
| Immigrant coworkers, all origins | Immigrant coworkers, other origins | Coworker salary rank | Immigrant coworkers, all origins | Immigrant coworkers, other origins | Coworker salary rank | Immigrant coworkers, all origins | Immigrant coworkers, other origins | Coworker salary rank | |
| (1) | (2) | (3) | (4) | (5) | (6) | (7) | (8) | (9) | |
| Panel A. Estimated mean gap in model | |||||||||
| County fixed effects (γI base) | 24.4 | 14.1 | −18.5 | 8.0 | 6.0 | −10.6 | 19.0 | 10.5 | −11.6 |
| Full set of controls (γI main) | 10.6 | 3.7 | −3.8 | 3.7 | 1.9 | −2.0 | 6.0 | 3.3 | −1.9 |
| Panel B. Explained share of within-county gap (%) | |||||||||
| Attributable to employee characteristics (total) | 12.4 | 15.0 | 30.4 | 9.0 | 11.7 | 32.7 | 23.5 | 17.2 | 34.7 |
| Age | −0.4 | 0.1 | 0.5 | −0.4 | −0.6 | 3.6 | 2.1 | −1.1 | −1.1 |
| Gender | 0.0 | 0.0 | −0.3 | 0.0 | 0.0 | 0.0 | 0.0 | 0.3 | −0.3 |
| Intermarriage | 0.8 | 4.3 | 0.0 | 5.3 | 6.8 | 1.9 | −1.8 | 1.6 | −1.4 |
| Education | 4.9 | 1.1 | 2.1 | 0.8 | 1.0 | 1.6 | 3.5 | 1.6 | 1.9 |
| Occupation | 7.1 | 9.6 | 28.1 | 3.3 | 4.5 | 25.6 | 19.6 | 14.8 | 35.6 |
| Attributable to workplace characteristics (total) | 40.2 | 53.5 | 46.9 | 32.2 | 40.7 | 45.4 | 45.4 | 56.2 | 46.8 |
| Establishment size | 0.1 | 0.2 | 1.8 | 0.4 | 0.5 | 0.8 | 0.6 | 0.5 | 1.7 |
| Establishment age | 0.7 | 0.5 | 1.0 | 0.5 | 0.7 | 1.1 | 1.4 | 0.9 | 1.1 |
| Industry | 26.0 | 40.0 | 39.0 | 12.2 | 15.9 | 39.3 | 36.4 | 49.4 | 38.9 |
| Sector | −0.1 | −0.3 | 1.6 | −0.1 | −0.1 | 0.6 | 0.4 | −0.2 | 2.4 |
| Immigrant manager | 13.5 | 13.1 | 3.5 | 19.2 | 23.7 | 3.5 | 6.6 | 5.6 | 2.7 |
| Attributable to neighborhood characteristics (total) | 3.8 | 5.0 | 2.0 | 12.5 | 16.0 | 2.5 | −0.2 | −4.6 | 2.3 |
| Neighborhood network index | 0.3 | −0.3 | 1.4 | 0.1 | 0.1 | −0.6 | 1.9 | −1.0 | 1.2 |
| Neighborhood proportion of immigrant residents | 3.5 | 5.6 | 0.1 | 13.0 | 16.6 | 2.0 | −2.0 | −3.3 | 0.8 |
| Neighborhood proportion in employment | 0.1 | −0.1 | −0.2 | 0.1 | 0.1 | −0.9 | 0.0 | 0.0 | 0.1 |
| Neighborhood proportion with higher education | −0.2 | −0.3 | 0.8 | −0.6 | −0.8 | 2.1 | −0.2 | −0.4 | 0.2 |
| Total share explained | 56.4 | 73.6 | 79.3 | 53.8 | 68.4 | 80.6 | 68.6 | 68.8 | 83.8 |
Note: Panel A provides the predicted difference for the relevant workplace measure of between (i) immigrants and natives, (ii) children of immigrants and natives, and (iii) immigrants and children of immigrants before and after control for employee, workplace, and neighborhood characteristics. The county fixed effects model controls only for 18 county FEs. The full model controls for all employee, workplace, and neighborhood control variables. Panel B gives the percentage of the within-county gaps that are accounted for by that given set of control variables for each comparison.
To ease interpretation, Figures 4–6 provide a graphical summary of the decomposition results for our three measures of workplace segregation. Each figure shows the main results for (children of) immigrants from all origin countries (i.e., Total), as reported in Table 3, along with the country-specific results, which are discussed in the next section. In each figure, panel A shows the explained (|${\gamma}_I^{base}$|—|${\gamma}_I^{main}$|) and unexplained (|${\gamma}_I^{main}$|) part of the within-county gaps, while panel B summarizes the separate contribution of employee, workplace, and neighborhood characteristics to the explained part of these gaps.
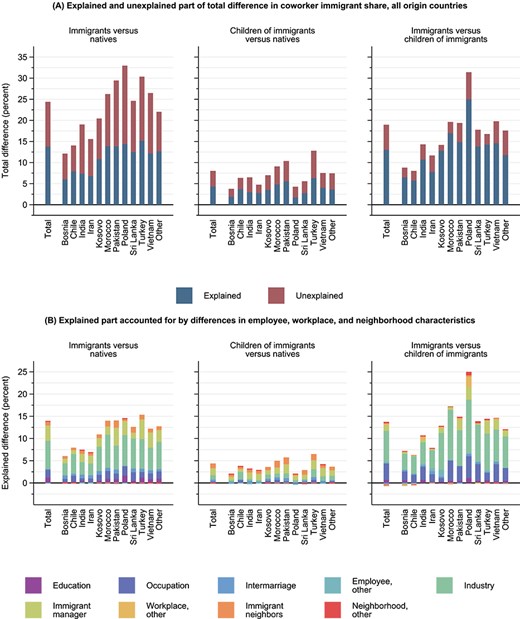
Contribution of employee, workplace, and neighborhood characteristics to differences in coworker immigrant share from all origin countries between natives, immigrants, and children of immigrants. Note: Panel a shows the explained component (γI base—γI main) and unexplained component (γI main) from the multivariate decomposition of the total within-county differences in workplace composition. Panel B shows the relative contribution to the explained component in panel a for sets of explanatory factors used in the multivariate Gelbach (2016) decomposition (see Online Appendix Table A3 for numerical estimates).
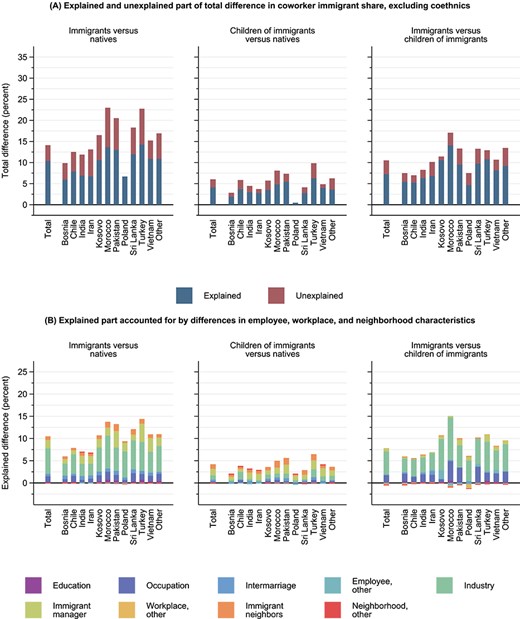
Contribution of employee, workplace, and neighborhood characteristics to differences in coworker immigrant share from other origin countries (i.e., excluding coethnics) between natives, immigrants, and children of immigrants. Note: Panel a shows the explained component (γI base—γI main) and unexplained component (γI main) from the multivariate decomposition of the total within-county differences in workplace composition. Panel B shows the relative contribution to the explained component in panel a for sets of explanatory factors used in the multivariate Gelbach (2016) decomposition (see Online Appendix Table A4 for numerical estimates).
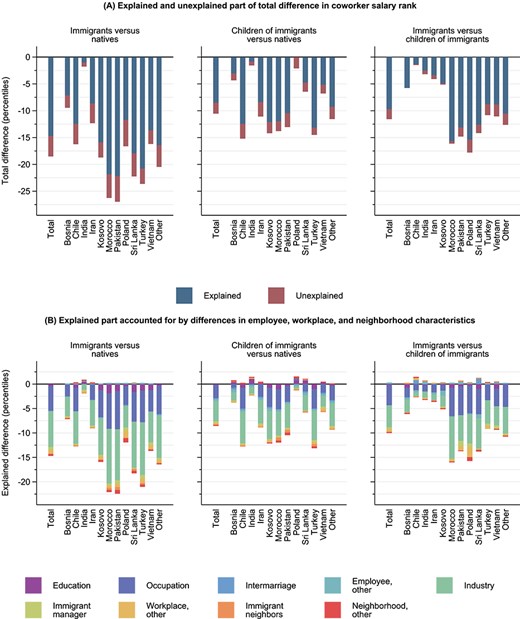
Contribution of employee, workplace, and neighborhood characteristics to differences in coworker salary rank between natives, immigrants, and children of immigrants. Note: Panel a shows the explained component (γI base—γI main) and unexplained component (γI main) from the multivariate decomposition of the total within-county differences in workplace composition. Panel B shows the relative contribution to the explained component in panel a for sets of explanatory factors used in the multivariate Gelbach (2016) decomposition (see Online Appendix Table A5 for numerical estimates).
The three first columns of Table 3 present the decomposition results for workplace segregation between immigrants and natives. In the first column, we see that the average share of immigrant coworkers is 25.1 percentage points higher for immigrants compared to natives living in the same county, which is comparable to the unadjusted gap. Controlling for employee, workplace, and neighborhood characteristics reduces the estimated difference in coworker immigrant share from 25.1 (|${\gamma}_I^{base}$|) to 10.6 (|${\gamma}_I^{main}$|), which implies a reduction of ~56%. Turning to the relative contribution of the different factors, education, occupation, industry of employment, immigrant manager, and the share of immigrant neighbors explain ~55% of the within-municipality gaps, while all other factors combined account for ~1%.
Differences in education and detailed occupation account for ~12% of the overall within-county gap, indicating that traditional skill-based measures make a nontrivial contribution to workplace segregation between immigrants and natives. However, industry alone explains nearly half of the explained part of the gap (i.e., 26% compared to the total explained part of 56%), while the presence of an immigrant manager also plays a significant role (14%). Immigrant neighbors contributes less to the explained part (4%), but still highlights the link between residential segregation and the greater likelihood of immigrants working alongside each other.
Column 2 reports results from a similar decomposition, except that for immigrants the dependent variable is the share of immigrants from other origin countries than their own. This analysis tells us whether immigrants are more likely to work with immigrants from other origin countries (i.e., excluding coethnics) compared to natives working with immigrants of any origin. Comparing the within-municipality immigrant–native gaps in column 1 (24.4) and column 2 (14.1) reveals that the gap for immigrants from other origin countries is 10.3 percentage points lower. This suggests that almost half of immigrants’ excess exposure to immigrant coworkers, relative to natives in the same county, is due to their tendency to work alongside coethnics, highlighting a disproportionately large country-specific component driving immigrants’ workplace concentration.
Further, column 2 shows that controlling for employee, workplace, and neighborhood factors explains about three-quarters of the total gap. The relative importance of the different factors is broadly comparable to the results for exposure to all immigrant coworkers, where industry (40%), occupation (10%), and education (1%), as well as immigrant managers (13%), immigrant neighbors (6%), and intermarriage (4%) emerge as the most important factors.
Overall, these results indicate that immigrants’ excess exposure to immigrant coworkers—both coethnics and those from other origin countries—relative to natives is primarily driven by differences in skills and, most notably, recruitment into immigrant-dense industries. The results also show that a substantial part of immigrants’ workplace concentration is driven by factors related to social networks and residential segregation.
Turning to coworker salary rank, we find that immigrants’ coworker salaries are, on average, 18.5 percentiles lower than those of natives within same county. This gap is slightly larger than the unadjusted difference, indicating that immigrants concentrate in regions with higher wages. Controlling for employee, workplace, and neighborhood factors account for four-fifths of the within-county gap, reducing the adjusted gap to 3.8 percentiles. Skill-related differences in education (2%), occupation (28%), and industry of employment (39%) account for nearly the entire explained part of immigrant–native differences in coworker salary rank.
The next three columns (4–6) present corresponding results comparing children of immigrants to natives, where we focus on whether the gaps to natives are smaller than the corresponding gap for immigrants and whether the contributions of the factors differ. Children of immigrants are exposed to 8 percentage points more immigrant coworkers than natives within the same county (column 4), which is about one-third of the corresponding gap for immigrants. Controlling for observed factors reduces this gap to 3.7 percentage points, leaving just under half of the baseline gap unexplained. The key factors accounting for the explained part are intermarriage (5%), education and occupation (4%), industry of employment (12%), immigrant managers (19%), and immigrant neighbors (13%). These results suggest lower immigrant coworker exposure and a diminished role of skill-based sorting and industry concentration. Given that children of immigrants more closely resemble natives, this is unsurprising. Notably, immigrant managers, residential segregation, and intermarriage more substantially explain second-generation workplace segregation.
For overexposure to immigrant coworkers from other origin countries (column 5), the 6 percentage-point gap relative to natives is comparable to the overexposure to immigrants from all origin countries (i.e., including coethnics). This suggests that ethnic workplace segregation is less driven by coethnic workplace concentration in the second generation. As with immigrants, observed employee, workplace, and neighborhood factors account for a larger share (68%) of the overexposure to non-coethnic immigrant coworkers. However, the relative contribution of these factors is similar for both measures of exposure to immigrant coworkers.
Column 6 results show that children of immigrants have coworker salary ranks averaging 10.6 percentiles lower than natives in the same county. Compared to immigrants, this gap is 7.9 percentiles smaller in the second generation. The within-county coworker salary rank gap is nearly 8 percentiles higher than unadjusted figures, highlighting the role of geographic sorting into high-wage regions. However, four-fifths of the within-county differences from natives are explained, almost exclusively by occupational (36%) and industry (39%) sorting.
To assess drivers of generational change, columns 7–9 decompose within-county gaps in coworker immigrant share and salary rank between immigrants and their children. The results indicate that about half of immigrants’ greater exposure to immigrant coworkers (19.0 percentage points) reflects interactions with coworkers from other origin countries (10.5 points), showing that country-specific workplace sorting is less pronounced in the second generation. Immigrants’ coworkers also have significantly lower salaries (11.6 percentiles) compared to those of children of immigrants. The multivariate decomposition attributes most generation-based differences in coworker immigrant share (68%) and salary rank (83%) to sorting by occupation (14–36%) and industry (36–49%), with smaller contributions from education (2–4%) and working for an immigrant manager (3–7%). Thus, children of immigrants’ lower presence in low-wage, immigrant-dense workplaces is mainly driven by improved skills, industry shifts, and, to a lesser degree, reduced employment under immigrant managers.
Country-specific decomposition
Our final task is to examine how factors driving workplace segregation vary by country of origin, both relative to natives and across immigrant generations. Figures 4–6 summarize the multivariate decomposition for each measure of coworker exposure by origin. Each figure compares (i) immigrants to natives, (ii) children of immigrants to natives, and (iii) immigrants to their children. Panel A shows the proportion of within-county gaps explained by covariates versus unexplained gaps. Panel B breaks down the contribution of specific factors, including education, occupation, intermarriage, industry, immigrant managers, and immigrant neighbors. Detailed estimates for these figures appear in Online Appendix Tables A3–A5.
Figure 4 shows that immigrant coworker overexposure, relative to natives, is highest among immigrants from Poland, Turkey, and Pakistan and lowest among those from Bosnia, Chile, and Iran. Across all origins, children of immigrants experience significantly less overexposure to immigrant coworkers, a decline confirmed by direct comparisons between immigrants and their children. Importantly, Figure 5 shows that immigrants’ overexposure to non-coethnic immigrant coworkers is much lower than their overall exposure to all immigrant coworkers. This is most pronounced among Polish immigrants, where it drops from 34% to 7% without coethnics. This trend is also seen among immigrants from Pakistan, Vietnam, and Turkey, highlighting a strong tendency for working with coethnics. In contrast, children of immigrants show only a small difference between exposure to non-coethnic and total immigrant coworkers across most origin groups, indicating that their workplace concentration is less influenced by coethnic ties. This generational shift in exposure to coethnics is also supported by the comparison between immigrants and their children.
The origin-specific decompositions in Figures 4 and 5 shows that industry, followed by occupation, education, immigrant managers, and immigrant neighbors are key factors in overexposure to immigrant coworkers relative to natives in both immigrant generations. However, children of immigrants’ lower exposure to immigrant coworkers relative to natives is mainly driven by occupational and industry sorting, reflecting their movement into less immigrant-dense workplaces due to improved skills. Nonetheless, the drivers of overexposure to immigrant coworkers relative to natives are complex in both immigrant generations. While skill-based sorting is central, network-related factors and residential segregation (e.g., immigrant managers and neighbors) also play a notable role.
Figure 6 shows that, except for immigrants from India, immigrants generally work in lower-wage workplaces than natives, with coworker salary disadvantages varying by origin (e.g., comparing Bosnia to Morocco and Pakistan). For children of immigrants, these salary rank differences are smaller, though notable gaps remain for those of Pakistani, Turkish, Chilean, Kosovar, and Moroccan descent. In origin countries where the immigrant generation is economically disadvantaged, immigrants consistently have lower coworker salary ranks than their children. For these groups, the decomposition shows that skill-based sorting (i.e., education, occupation, industry) is the primary driver of economic workplace segregation both relative to natives and across generations.
Discussion and Conclusions
Workplace segregation between immigrants and natives is an integral feature of ethnic stratification in the economies of contemporary immigrant-receiving countries, yet less is known about the persistence of this segregation across immigrant generations. Using linked employer–employee administrative data covering the entire Norwegian labor market, we ask why immigrants from non-Western origin countries are concentrated in different workplaces than natives and whether workplace segregation diminishes among children of immigrants. Our multivariate decomposition approach enables us to assess the relative contributions of individual, employer, and neighborhood characteristics to patterns of workplace segregation between immigrants, their children, and natives.
Our analyses reveal several key findings. First, we document a sharp reduction in workplace segregation between immigrant generations, which aligns well with theories predicting a gradual process of assimilation through improved access to into workplaces in the mainstream economy (Alba and Nee 2003, Drouhot and Nee 2019). Immigrants are much more likely to work alongside other immigrants as well as with low-wage coworkers than would be expected by random allocation. In contrast, children of immigrants have a much lower average share of immigrant coworkers (16%) compared to immigrants (32%). With natives’ share of immigrant coworkers at 7%, this implies that overexposure to non-Western immigrants—while still sizeable—is reduced by two-thirds in the second generation. Additionally, the distribution of children of immigrants across workplaces with different pay levels resembles that of natives.
Second, our visualizations of workplace sorting reveal that both immigrants and children of immigrants who remain employed in low-wage workplaces are still disproportionately overexposed to immigrant coworkers. This suggests that less successful children of immigrants often find work within immigrant-dense niches of the economy where their coworkers resemble those of disadvantaged immigrants who also work in low-wage segments (Friberg and Midtbøen 2019, Waldinger and Lichter 2003). Importantly, this pattern does not reflect increased between-group inequality among children of immigrants from different countries of origin, but rather characterizes the second generation within most national origin groups. This is inconsistent with the prediction of segmented assimilation theory, which suggests selective patterns of downward assimilation for specific minority groups. Moreover, this contradicts the notion that being embedded in immigrant-dense niches can be economically beneficial for children of immigrants, as workplaces with high immigrant shares tend to be characterized by low wages. Overall, this highlights a labor market that remains highly stratified along ethnic lines in the immigrant generation, while children of immigrants experience considerable workplace desegregation and economic assimilation.
Third, our results point to changes in skill-based worker sorting as the central explanation of workplace desegregation across immigrant generations. Children of immigrants’ higher access to mainstream workplaces with lower immigrant concentration and better wages is largely explained by generational differences in education, occupation, and industry of employment. This suggests that improvements in (country-specific) human capital drives second-generation advancement out of immigrant-dense occupations and industries. Moreover, differences in skill profiles—i.e., education, occupation, and detailed industry—are also central in explaining why immigrants and natives tend to concentrate in workplaces characterized by differing immigrant densities and wage levels. Finally, differences human capital—while still important—contribute considerably less to the remaining workplace segregation between children of immigrants and natives.
Fourth, we find also find evidence indicating that network-based and spatially segregated recruitment patterns are important sources of workplace segregation in both immigrant generations. Even after accounting for detailed productivity-related worker characteristics, employment in establishments with immigrant managers makes a sizeable contribution to workplace segregation relative to natives in both immigrant generations. Additionally, local immigrant neighbor concentrations—and in some cases, intermarriage—are also important factors in explaining workplace segregation. This suggests a central role of social networks in the process of workplace sorting among (children of) immigrants, with neighbors, spouses, and other network connections providing job-relevant information. These findings align with prior studies showing that immigrant managers tend to hire workers from the same origin (Giuliano and Ransom 2013, Kerr and Kerr 2021, Åslund, Hensvik and Skans 2014) and that immigrants often rely on referral networks to secure employment (Dustmann et al. 2016, Goel and Lang 2019, Strömgren et al. 2014, Åslund, Hensvik and Skans 2014).
Fifth, theories of skill-based worker sorting and network-based recruitment both predict that employers have efficiency-based incentives to hire immigrants from the same country of origin. Notably, nearly half of immigrants’ overexposure to immigrant coworkers can be attributed to working with coethnics from the same origin country. This supports prior research (Andersson et al. 2014, Glitz 2014, Åslund and Skans 2010), suggesting that unobserved country-specific factors such as shared language skills and coethnic referral networks play a critical role for immigrant workplace concentration. However, exposure to coethnic coworkers is much lower among children of immigrants, further highlighting the decline in ethnic segmentation in the second generation.
A strength of our analysis lies the use of rich administrative data, which allow us to disentangle the net contribution of a broad range of factors within a multivariate framework, which allows us to narrow down the relative weight of key drivers behind workplace segregation between immigrants, their children, and natives. Needless to say, our study also has limitations. For example, prior research argue that differential sorting across industries reflect differences in skill profiles between immigrants and natives (Andersson et al. 2014). However, the contribution of industry to immigrant–native workplace segregation, net of adjustment for about 350 different occupational titles, may also reflect industry-specific recruitment practices in immigrant niches (Waldinger and Lichter 2003, Wilson and Portes 1980). Supply-side explanations of skill-based sorting and demand-side perspectives on industry-specific recruitment patterns are, however, not mutually exclusive, as sorting across industries may reflect self-reinforcing dynamics where immigrants, through various recruitment channels, become matched to employers in immigrant-dense niches of the labor market. Additionally, to the influence of immigrant neighbors and immigrant managers may not solely capture network-related processes, but could reflect unobserved heterogeneity, such as in-group preferences for working with (coethnic) immigrants (Strömgren et al. 2014). Future research needs to disentangle the impact of network-related recruitment processes on (children of) immigrants’ workplace sorting from unobserved worker characteristics using more rigorous methods for causal inference.
It is also important to recognize that immigrants and their native-born children likely experience not only segregation between workplaces but also intraorganizational segregation relative to natives across work teams and job structure hierarchies, which shapes who they interact with on a daily basis (e.g., Larsen, Madsen and Hermansen 2024, Tomaskovic-Devey, Hällsten and Avent-Holt 2015). Recent studies document how wage disparities between immigrants and natives are driven not only by sorting into low-wage workplaces but also by the concentration of immigrants in lower-paying jobs within organizations (Han and Hermansen 2024). Therefore, our focus on between-workplace segregation may underestimate the full extent of immigrant–native segregation in social interactions at work. Future research should explore patterns of within-workplace segregation between immigrants, their children, and natives in more detail.
Why do unexplained gaps in workplace segregation relative to natives remain? A key limitation of our study is lack of information on language skills, which could shed light on immigrants’ unexplained overexposure to coethnics, since communication in a shared language is arguably a key explanation of coethnic workplace clustering (Andersson et al. 2014, Glitz 2014, Hellerstein and Neumark 2008). Language barriers should, however, be less relevant for children of immigrants, which is consistent with the considerably lower exposure to coethnics in the second generation. While systematic hiring discrimination can lead immigrants from the same country to concentrate in specific workplaces (Bursell and Bygren 2023, Quillian et al. 2019), unexplained coethnic workplace clustering likely reflects a combination of unobserved group-specific factors, such as (non-residential) coethnic networks and language commonality (Andersson et al. 2014).
On the whole, this study documents sharp declines in workplace segregation relative to natives across immigrant generations as children of immigrants increasingly enter workplaces in the mainstream economy. By examining these dynamics of blending and segregation at work in the Norwegian welfare economy, we contribute to new line of research that positions workplaces as central arenas of intergroup contact and assimilation across immigrant generations. Future research should assess whether similar patterns of intergenerational difference in the sorting of immigrants and their native-born children across workplace contexts are present across a broader and more institutionally diverse set of immigrant-receiving countries. Additionally, more research is needed to better understand the proximate organizational processes—such as ethnic disparities in employee inflows and outflows—that drive generational shifts in workplace segregation between immigrant minorities and native majority populations.
About the author
Mats Lillehagen is an Associate Professor at the Oslo Metropolitan University and a former Postdoctoral Fellow in the Department of Sociology and Human Geography at the University of Oslo. His main research interests include immigrant assimilation, social stratification, and social theory. His recent work has appeared in European Sociological Review, Population Studies, Journal of Education and Work, and Demography.
Are Skeie Hermansen is a Professor of Sociology at the University of Oslo and a Researcher at the Swedish Institute for Social Research at Stockholm University. His current research focuses on immigrant assimilation, social mobility, and inequality in education and the labor market. His recent work has appeared in Industrial and Labor Relations Review, Socio-Economic Review, Demography, and American Journal of Sociology.
Acknowledgements
Earlier versions of this paper was presented at the 2021 Virtual Annual Meeting of the Population Association of America and in seminars at Sciences Po, Stockholm University, University of Oslo, and the Norwegian Academy of Science and Letters. We thank Marianne Bitler, Donald Tomaskovic-Devey, and the participants at the abovementioned events for helpful comments. We also thank the journal’s six anonymous reviewers for constructive feedback.
Funding
The research leading to the results presented in this article has received funding from the European Research Council (ERC) under the European Union’s Horizon 2020 research and innovation program (grant agreement no. 851149) Mats Lillehagen’s work was supported by the Research Council of Norway (grant number 287016).
Conflicts of interest
None declared.
Data availability
The data that support the findings of this study are Norwegian administrative microdata provided by Statistics Norway. Due to confidentiality reasons, these data are not publicly available but can be accessed upon receiving relevant approvals.
Footnotes
Our administrative data lack information on the informal economy, but this is this small in Norway and is calculated to be 0.5–1.2% of the total GDP in Norway (Samfunnsøkonomisk analyse 2017).
Online Appendix Figures A3 and A8 present results from an auxiliary analysis using an alternative measure of economic workplace segregation. This measure is based on estimates from a longitudinal two-way individual and workplace fixed-effect model (Abowd, Kramarz and Margolis 1999, Dostie et al. 2021). It provides us with a more direct measure of immigrant–native segregation in terms of sorting across workplaces that differ in workplace-specific pay premia, net of stable human capital characteristics of employees (i.e., percentile-ranked establishment fixed effects). Additionally, we include a measure of economic workplace context based on the predicted stable earnings potential of coworkers (i.e., percentile-ranked means of coworkers’ individual fixed effects). The results from these analyses support the main findings, showing comparable sorting by immigrant background across economic workplace characteristics and indicating that occupation and industry of employment are the primary factors—explaining 70–94% of the between-group gaps—that drive observed patterns of economic workplace segregation.
The key strength of this additive linear regression decomposition approach is that it allows us to quantify the relative contribution of a comprehensive set of explanatory factors that account for group differences in exposure to coworker characteristics, such as the share of immigrant coworkers (Andersson et al. 2014). However, other less parametrized approaches have been developed to account for more complex interactions between factors contributing to observed patterns of workplace segregation (Carrington and Troske 1997, Åslund and Skans 2009, Åslund and Skans 2010). While these non-parametric approaches offer flexibility, a key limitation is their inability to provide a transparent, multivariate decomposition that quantifies the relative contribution of individual factors.
Online Appendix Figure A4 shows the age distribution of coworker immigrant share and coworker salary ranks for natives and immigrants and children of immigrants, both overall and broken down by country of origin.
Online Appendix Figures A5–A6 present similar heat plots for a subsample of the children of immigrants (approximately 82%) where we are able to link information on workplace characteristics of immigrant parents to their own children. This provides a more direct description of changes in workplace sorting across immigrant generations and the results reveal a strikingly similar pattern of improved access to higher-paying and less-immigrant dense workplaces in the second generation. This pattern is also found within each of the major countries of origin.
