


Abstract
While prior research has widely acknowledged the consequences of specific family transitions (e.g., parental death, parenthood, grandparenthood) for individual wealth holdings, the interplay of multiple family transitions and positions occurring at different life stages and in various orderings has received little attention. This is despite the fact that these transitions and positions most likely jointly shape wealth accumulation, both in the shorter and longer run. We apply (1) sequence analysis to identify typical family life course clusters defined by the timing of the death of the parent generation, the timing of the transition into parenthood, and grandparenthood and (2) regression analysis to describe how the accumulation of wealth between ages 40 and 64 differs by family life course cluster. Using Norwegian register data of individuals born in 1953 (N = 47,945), we identified six clusters of family trajectories ranging from childless individuals to individuals who were sandwiched between their parents, children, and grandchildren because of relatively early (grand)parenthood and late parental death. Individuals experiencing patterns with a later transition into (grand)parenthood occupied stable and high wealth positions over time. Individuals without children exhibited a steady increase in their wealth position. Additionally, experiencing parental death later in life was associated with increasing wealth, whereas early parental death was not. These results held net of gender and education. Pronounced and even increasing wealth differences over the life course seem to be associated with the interplay of multiple family transitions.
Introduction
Wealth is a crucial indicator of social inequality at different life stages because it determines—and is determined by—access to important resources, such as educational achievement, labor market outcomes, and health services (for an overview, see Killewald et al. 2017). The family context is highly relevant for wealth accumulation over the life course. While partnerships, particularly marriages, positively affect individuals’ wealth accumulation potential, for instance, by pooling resources and—in some contexts—by reducing the tax burden (Lersch and Schunck 2023), the intergenerational family context plays a crucial role in individual wealth accumulation, too. Various family transitions and positions have been shown to be associated with the accumulation of wealth directly through monetary transfers or via more indirect channels, such as socialization and education (e.g., Galster and Wessel 2019). Considering intergenerational transitions and direct transfers, the death of parents is typically associated with an inheritance for children and even grandchildren, and the birth of a grandchild often co-occurs with the transfer of housing from parents to children (Adermon et al. 2018; Leopold and Schneider 2011; Nekoei and Seim 2023). Also, being in a specific family position is usually linked to typical financial support patterns, such as parents and grandparents supporting their children and grandchildren throughout their life courses (Albertini and Kohli 2013). Next to such direct transfers, holding a family position might affect one’s incentives, opportunities, or necessities to accumulate or decumulate wealth (Galster and Wessel 2019, Lersch et al. 2017; Pfeffer and Killewald 2018; Van Winkle and Monden 2022).
So far, prior research has mostly focused on the (average) consequences of single family-transition or positions for individual wealth holdings. However, throughout the life course, individuals might experience the death of their parents and become a parent or (later on) a grandparent. These family transitions and associated positions might jointly affect individuals’ wealth holdings. For instance, parents’ ability to optimize the returns to inheritances may be constrained compared to that of childless individuals, as they tend to prioritize covering child-related expenses over investing in stocks or real estate. Moreover, the life stage (timing) in which such family transitions occur might also play a role (Kapelle and Vidal 2022; Lersch et al. 2017). Lastly, changes in wealth might not only arise immediately after transitions occur but gradually or at a later point in life (Goda and Streeter 2021). Considering heterogeneous family life courses and their associations with wealth instead of examining average estimates, thus, seems highly relevant (Gruijters et al. 2023).
Addressing the co-occurrence of multiple family transitions and positions as well as their timing, this study asks: Which long-term wealth trajectories are associated with typical intergenerational family life courses? Next to the quality of intergenerational relationships (Min et al. 2022), previous research has demonstrated that the mere occurrence of intergenerational family events and their timing seems relevant for wealth accumulation, particularly the death of parents (e.g., Adermon et al. 2018; but see Black et al. 2022) and the transition into parenthood (e.g., Lersch et al. 2017). Therefore, we focus on experiencing the death of the parent generation and distinguish between parents and individuals without children. Moreover, we directly observe wealth accumulation around the transition into grandparenthood as a central life course event in later life (e.g., Leopold and Schneider 2011). We aim to provide an encompassing description of how different typical patterns of intergenerational family transitions and positions are related to wealth accumulation over the individual life course. Against this background, we do not intend to investigate their causal relationship but focus on the description of their association over time. A thorough description of interrelated processes of social inequality embeds existing research into its larger context, guides future research zooming in on specific issues, informs policy and practice about wealth accumulation in groups with different family trajectories, and identifies potentially vulnerable groups based on fairly basic indicators, such as parenthood or timing of parental death.
Our analyses are based on Norwegian register data containing wealth measures available for the period 1993–2017. In order to cover the death of the parents and the transition into grandparenthood for many individuals, we include individuals born in 1953, resulting in an age range from 40 to 64 years. The choice of this birth cohort also allows us to observe the long-term associations between parenthood and wealth. In the first step, typical life-course family trajectories, so-called generational placement trajectories (Hünteler 2022), are identified using sequence and cluster analysis. They combine information about whether, when, and in which order parental death and the transitions into (parent- and) grandparenthood occurred. Subsequently, wealth accumulation patterns across the observation period are compared between the family clusters using linear regression models while accounting for a potential selection based on sociodemographic characteristics.
Background
Family over the life course
Following the family life course perspective, we understand the family system as a dynamic concept that changes its composition across the individual life course and in alignment with the current socio-temporal context (Bengtson and Allen 1993). Within the family system, family members are linked across generations and affect each other’s lives by transmitting and exchanging values, norms, behavior, and resources like wealth (Elder 1994; Gilligan et al. 2018; Mare 2011; Pfeffer and Killewald 2018).
In the current study, we focus on multiple intergenerational family transitions—parental death and the birth of children and grandchildren, which define the structure of the family—and how they might jointly be associated with wealth accumulation. Therefore, we apply the concept of generational placement (Hünteler 2022), which describes one’s vertical position in the family system, that is, whether an individual is a child, parent, and/or grandparent at a given point in time. Generation in this sense refers to the genealogical embeddedness of an individual in their family, as has been similarly described using the concept of “family generations” (Attias-Donfut and Arber 2000). Generational placements account for the possibility of occupying multiple positions at the same time. Over time and by experiencing specific family transitions, individuals can transition from one generational placement (e.g., being a child and a parent) to another (being a parent only). Generational placement trajectories describe the progression of an individual through different positions within the intergenerational family system over the life course and thus consider the family structure as a process (Hünteler 2022). The generational placement is associated with social roles as well as normative expectations and legal requirements regarding the provision or receipt of intergenerational support (Bengtson and Allen 1993). It also determines the so-called kinship reservoir, a specific form of social reserve comprising family members whom individuals can activate as resources in times of need (Cullati et al. 2018; Sauter et al. 2021; see also “latent kin matrix” by Riley 1983). For the current study, generational placement trajectories provide a means to characterize combinations of multiple family positions, which result from transitions and mirror the timing and ordering of the latter.
Family and wealth
Wealth accumulation is a life course process (Killewald et al. 2017) that is shaped by two interrelated pathways, namely, saving and investment of self-generated surplus income and receipts (or transfers) of wealth (e.g., Hällsten and Pfeffer 2017). This process is influenced by a person’s financial means, that is, whether and how much wealth a person owns in the first place, with more wealth facilitating not only accumulation through compound interest but also enabling transfers. Wealth accumulation also develops in interdependence with generational placement trajectories. For instance, individuals’ capacities to save or invest are restricted during and after financially burdensome family events, such as parenthood (Lersch et al. 2017). The receipt and transfer of wealth is also often related to intergenerational family transitions and positions, such as parental death (Boserup et al. 2016), parenthood (Lersch et al. 2017), and grandparenthood (Leopold and Schneider 2011). Wealth holdings might also change by the anticipation of a transition to happen (Boserup et al. 2016, for parental death). Lastly, multiple family transitions might interact in their association with wealth (Benton and Keister 2017). Saving, investing, and receiving financial assets generally results in wealth increases, while transferring wealth to family members or others decreases it. The next paragraphs discuss, based on previous literature and theoretical considerations, how specific transitions and positions are linked to wealth accumulation over the life course.
Having parents alive and parental death
Parents’ financial support varies over their child’s life course, possibly starting with saving and eventually paying for their education or other long-term needs during childhood and continuing during significant life events in their adulthood like marriage, divorce, or home purchase (Albertini and Kohli 2013; Leopold and Schneider 2011). Parents’ death also often results in the transfer of money or property in the form of bequests, which can increase the wealth of subsequent generations notably around the time of and long after parental death (Adermon et al. 2018; Benton and Keister 2017; Black et al. 2022). Some individuals also receive inheritance advances to minimize potential tax deductions (Boserup et al. 2016), while others receive them specifically in times of need (Gulbrandsen and Langsether 2003).
Importantly, whether and how much wealth parents (can) transfer to their children depends on the parents’ initial wealth level. From the child’s perspective, next to the absolute value of an inheritance (Nekoei and Seim 2023), the life stage (timing) at which they experience parental death can impact their wealth accumulation. Most inheritances are received in mid- to late-adulthood when children have established their own wealth and families (Gulbrandsen and Langsether 2003). Earlier parental deaths (occurring earlier in an individual’s life course relative to the population under study) result in earlier receipts of inheritances. This may accelerate repayment of mortgage or debts of other earlier-life investments, thus extending the time for investing in value-generating assets that facilitate greater wealth accumulation. Also, assuming an inverse u-shaped form of wealth accumulation over the life course, parents who pass away earlier, that is, in their mid-adulthood and around pre-retirement age, are likely to pass on larger bequests, as they have accumulated wealth close to their maximum to secure their economic well-being during retirement.
In contrast, later parental deaths might allow for more or better targeted inter vivos transfers because parents, while they are alive, can support their children longer and provide advice or function as credit-worthy guarantors for their children’s real estate purchases (Galster and Wessel 2019)—which is particularly important in the Norwegian housing market (Hansen and Toft 2021). Also, receiving inheritances later, that is, when the children themselves are in the pre-retirement stage and already have accumulated more wealth, was associated with larger financial benefits for them (Benton and Keister 2017). Children in this established life stage might directly invest the received inheritance in larger and more profitable assets compared to younger individuals with a smaller financial base. However, parents who pass away later in life might have dissaved (larger shares of) their wealth throughout retirement, thus bequeathing smaller values to their heirs.
In sum, while parents can support their children throughout the whole life course, we expect the death of the second parent—as the time where most bequests to children occur (Norwegian Ministry of Children and Equality 2009)—to be associated with an increase in individuals’ wealth. Regarding differences in timing of parental death, associations in either direction seem plausible.
Birth of grandchildren and grandparenthood
When individuals become grandparents, they might transfer financial resources to their children who have become parents for support, also in anticipation of the transition. For example, real estate appeared more likely to be transmitted the year before individuals’ own children became first-time parents and at consecutive births of grandchildren in Germany (Leopold and Schneider 2011). In another study from Germany, financial support from parents declined around childbirth compared to the years before (Min et al. 2022). Country-comparative research concluded that direct financial transfers of money from grandparents to their children were not associated with the presence of grandchildren in Scandinavian or Mediterranean countries, unlike in Continental Europe (Albertini and Kohli 2013). When grandchildren became adults, grandparents were shown to support them directly in acquiring (more expensive) housing through inheritances and gifts in Norway (Galster and Wessel 2019). Accordingly, grandparents’ wealth should decrease through the support they provide to their grandchildren. With regards to the timing of grandparenthood, a younger age at the transition into grandparenthood implies a longer period of potential financial transfers to younger generations and therefore a prolonged reduction in wealth holdings. While direct transfers from grandparents to grandchildren may play a smaller role in our study due to the young age of grandchildren, we expect to see changes in grandparents’ wealth due to transfers to the parents of their grandchildren.
Birth of children and parenthood
Although the current study does not observe wealth accumulation around the time of first childbirth, long-term associations between parenthood and wealth are likely to persist until later life.
Two scenarios are possible when comparing wealth of parents to that of individuals without children (Van Winkle and Monden 2022). Transitioning into parenthood might decrease the possibilities to generate disposable income because parenthood can limit labor market participation while it simultaneously increases household costs. Also, as children grow older, parents continue to support them financially, oftentimes linked to children’s economically critical life events, such as marriage or divorce (Leopold and Schneider 2011). In contrast, individuals planning to become parents might save more money to afford children and to bequeath their wealth to following generations (Van Winkle and Monden 2022). The acquisition of larger housing might also result in higher wealth levels for parents (Feijten and Mulder 2005). Previous research of the parenthood-wealth-nexus has, however, been inconclusive and context sensitive (Van Winkle and Monden 2022). Considering the timing of parenthood, parenthood in early adulthood might reduce opportunities to accumulate wealth in a life phase when saving for large-scale investments like housing is crucial. In contrast, delaying parenthood allows for longer wealth accumulation, leading to better housing quality (see also early investment advantage in Lersch et al. 2017), independent of the socioeconomic status (Feijten and Mulder 2005). For those who became parents later in life, receiving an inheritance also resulted in stronger wealth growth (Benton and Keister 2017). Cumulative advantage could lead to long-term wealth advantages for those with later parenthood. Importantly, other mechanisms might contribute to the correlation between timing of parenthood and wealth; for example, postponement of family formation due to lack of sufficient security might be a reversed causal pathway (Su and Addo 2023).
The role of the family of origin
We acknowledge that the associations between wealth trajectories and family patterns partly exist because both are inherited from the family of origin. For example, individuals with wealthier (grand)parents are likely (1) to accumulate more wealth through financial intergenerational support, larger educational investments that lead to higher income returns, or the provision of a safety net allowing for riskier investments (Galster and Wessel 2019); (2) to become (grand)parents later because of educational investments and the associated postponement of childbirth (Kravdal and Rindfuss 2008); and (3) to experience a later death of their own parents, given a higher life expectancy of wealthier individuals (Attanasio and Hoynes 2000). Over time, the transmission of family (Riise et al. 2016) and health behavior may further reinforce these associations (Gilligan et al. 2018; Mare 2011). Ideally, we would like to account for the wealth of the family of origin empirically, but the earliest available measure for parental wealth is when our focal individuals are 40 years old. Thus, parental wealth at this point likely reflects something different than wealth of the family of origin. For example, parents might already have transferred wealth to their offspring or used shares of it to maintain their living standard during retirement. As alternative indicators of the socio-economic position and demographic behavior of the family of origin, we include the number of siblings and parents’ highest education as additional control variables in a robustness check.
The Norwegian case
The case of Norway is particularly interesting because—despite being considered among the most equal countries regarding income in Europe—wealth inequalities are comparatively high and have increased in recent years (Hansen and Toft 2021; Pfeffer and Waitkus 2021; Wiborg and Grätz 2022). The birth cohort 1953 under study accumulated wealth in times of expanding economic opportunities in Norway in the second half of the twentieth century. They were born at the beginning of the “golden era,” where they benefitted from Norway’s adoption of the Nordic model with a comprehensive welfare system (Grytten, 2020). Although the Norwegian system follows universal and egalitarian policies, offers generous public benefits, and strongly regulates employees’ working lives, capital is only weakly regulated. Norway introduced the deregulation of its economy in the mid-1980s and turned to marketized policies regarding housing and financial assets (Hansen and Toft 2021; Poppe et al. 2016). As the financial market facilitated access to mortgages and financial credits, Norway turned toward a high-homeownership country between 1960 and 1980, where rental housing has become associated with economic insecurity (Sørvoll and Nordvik 2020). The periods of wealth accumulation for the 1953 cohort were thus characterized by affordable homeownership and economic prosperity—particularly driven by the high profits of Norway’s petroleum sector since the 1970s. In 2020, 81 percent of the adult population were homeowners compared with 66 percent in the Euro area (Eurostat 2022) and around 63 percent in the United States between 2012 and 2014 (Pfeffer and Waitkus 2021). After the 1990s, however, housing wealth has become more unequally distributed in Norway, as the share of homeowners from low-income groups decreased considerably (Sørvoll and Nordvik 2020).
Norway’s economic structures favor the intergenerational transmission of wealth, particularly of housing property. Next to direct inheritances, inter vivos transfers from the parental (Albertini et al. 2007; Hansen and Wiborg 2019) and the grandparental generations to their (grand)children (Galster and Wessel 2019), are highly relevant for descendants’ housing wealth in Norway—particularly in urban areas (Galster and Wessel 2019). Considering other dimensions of wealth, children with wealthy ancestors are economically secure enough to invest in more profitable but risky assets (Toft and Friedman 2021). Additionally, a comparatively large share of Norway’s population is in debt. Acquiring it might constitute a successful investment strategy for children with a wealthier background, while it may be a downward spiral for individuals with less favorable financial backgrounds (Hansen and Toft 2021).
Norway has a progressive tax system, in which tax rates are linked to the levels of income and wealth. A wealth tax was introduced in 1893 (Gabrielsen 1992, 17). After a reform in 1992, the wealth tax comprised a municipal wealth tax ranging between 0.0 and 1.0 percent and a state wealth tax ranging between 0.0 and 0.5 percent, depending on the amount of wealth owned and only applicable to those exceeding a free basic amount. Norway underwent some tax reforms that gradually reduced the total wealth tax rate, amounting up to 0.85 percent from 2015 to 2017, the end of our observation period (Ministry of Finance, email message to author, August 8, 2024). Capital income from savings, shares, and the like was taxed as regular income until 2006, with basically tax-free dividends for shares held in Norwegian businesses (Gabrielsen 1992, 57). As of 2006, a higher taxation of capital gains was introduced for individual taxpayers but not for companies (Hansen 2014; Hansen and Wiborg 2019). Additionally, the tax for inheritances and gifts was introduced in the Inheritance Tax Act (Arveavgiftsloven) in 1792 (NOU 2000). Similar to the wealth tax, the inheritance tax rate gradually declined, also in recent years (Statistics Norway 2012). For illustration, the inheritance tax rate on taxable inheritance was 6–8 percent for smaller (NOK 470,000–800,000) and 10–15 percent for larger transfers (NOK > 800,000) in 2012, with the low tax rate applying to direct heirs and the high tax rate to non-direct heirs. In 2014, the right-wing government abolished the inheritance tax.
Inheritance in Norway is subject to mandatory inheritance regulations. With few exceptions among the very rich, the largest portion of an inheritance goes to the direct legal heirs, mainly children and spouses (Asland 2021). The intergenerational transfer of property to the children is typically postponed until the surviving spouse has passed away (Norwegian Ministry of Children and Equality 2009). The right to “uskifte” (meaning “unchanged”) is a basic right of Norwegian inheritance law for the surviving spouse to keep the community property of the marriage (more information on wealth related to marriage in the Appendix). Although the surviving spouse might downsize wealth or transfer it to the children, we assume that most direct transfers occur upon the death of the second parent. Norway does not have any further legal obligations toward parents or adult children (Herlofson et al. 2011).
In conclusion, Norway is a context in which the family context is highly relevant for wealth accumulation over the life course through the accumulation of advantage and disadvantage across multiple generations.
Data and methods
Data
This study draws on data from the Norwegian Population Register and the Norwegian Tax Register that have unprecedented potential to analyze the relationship of generational placement and wealth trajectories. The population register contains information of all individuals born since 1953 in Norway, their parents, and their descendants. Wealth data are available for the years 1993–2017. The analyses were based on individuals born in 1953 (n = 73,149; here referred to as focal individuals or generation G2), so we observed their wealth between ages 40–64 and covered many transitions into grandparenthood as well as parental deaths. In addition, we distinguished between individuals with and without children. Therefore, we directly observed family transitions and their resulting generational placements spanning four generations.
We restricted the cases to only include observations without gaps or censoring, so the dataset was balanced over the full observation period. Additionally, both parents had to be identified to determine their death, which was not feasible if the individuals were born outside of Norway and their parents never migrated to Norway (see also fig. 1). Thus, we case-wise deleted individuals who were not born in Norway (n = 12,074). Also, we excluded individuals who passed away before 2017 (the end of the observation period, n = 6,581), or ever emigrated during the observation period (n = 2,863) because we do not (reliably) observe their wealth for the periods when they are not alive or in the country. Lastly, we limited the analyses to individuals whose both parents could be identified and were born in Norway (n = 3,345 dropped). The analyses relied on couple-equivalized individual wealth, representing the individual’s or, when individuals were married, the individual’s and spouse’s wealth divided by two (see Appendix for details). Therefore, individuals’ spouses needed to be identified (n = 219 dropped) and their wealth holdings recorded (n = 145 dropped). The final analytical dataset contained complete family and wealth trajectories of 47,945 individuals covering the years 1993–2017, resulting in 1,198,625 person-years (balanced panel).
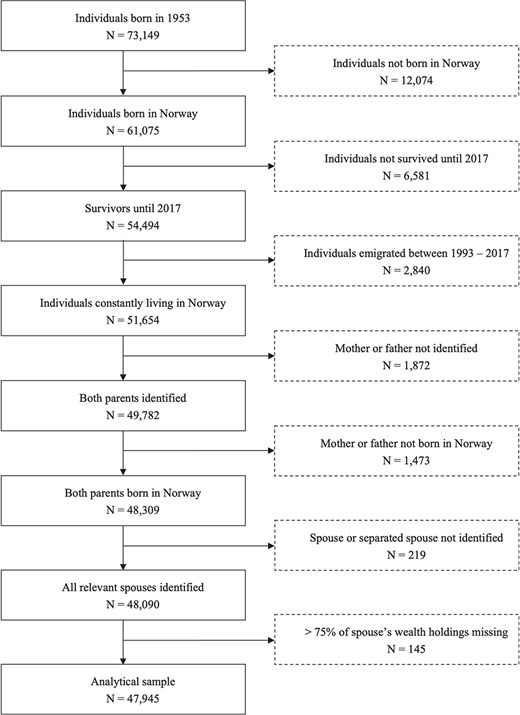
Sample selection process. Note: N refers to individuals.
Generational placement trajectories
We ran sequence and cluster analyses to identify typical generational placement trajectories (Hünteler 2022) (see section Family over the Life Course). Generational placements were defined by the death of the parents, birth of the first child, and birth of the first grandchild. Thus, each individual could hold multiple generational positions simultaneously, including the presence of alive parents (G1), own children (G3), and own grandchildren (G4). Generational placements ranged from focal individuals (G2) without any intergenerational biological ties to those being a child, parent, and grandparent simultaneously. We used the chi-square distance measure, which is sensitive to variations in timing (Studer and Ritschard 2016), to calculate the differences between all individual trajectories. The partitioning around medoids cluster algorithm identified typical patterns of these trajectories that were similar within but different between each of the clusters (Studer 2013). The observation of the family trajectories was restricted to the observation period of wealth (1993–2017) to examine their association with wealth in this period. We used additional information on family transitions prior to 1993, most importantly whether and when individuals became parents, in additional descriptive analyses.
Wealth accumulation
We used percentile ranks for individual gross and net wealth as well as debts to measure wealth (see, for instance, Hansen and Toft 2021). While gross wealth represents financial and taxable real capital, net wealth equals gross wealth minus debts. Because housing plays a crucial role for wealth in Norway (Sørvoll and Nordvik 2020) and is often associated with larger debts due to mortgages, considering both gross and net wealth is relevant. Considering debt separately is also important because debt does not just reflect negative wealth. Having more debt can also correspond to having more resources because (larger) credit is usually given to financially more secure or potent individuals and (further) enlarges their investment potential (acquiring gross wealth, like housing) and relative financial advantage (see Dräger et al. 2023).
Financial capital refers to taxable wealth in bank accounts, stocks, and bonds. Due to the exclusion of unlisted stocks, taxable financial capital might be underestimated for the very rich (Hansen and Toft 2021). Real capital contains the total taxable value of real estate, land and forest, and business assets. We adjusted for changes in the taxable amount of real estate over time and region (Statistics Norway 2022) (see Appendix). Debts included debt (also mortgages) owed to any Norwegian or foreign creditors. In the Appendix (figs A5–A9), we descriptively show absolute wealth accumulation by these different components of wealth.
We analyze percentile ranks of wealth for each year, in relation to all other focal individuals in the analytical dataset (Hansen and Toft 2021). Ranks make the trajectories independent from the absolute wealth levels, thus minimizing the problem of outliers within the left-skewed wealth distribution, and tackle the issue of underestimation of absolute wealth of the very rich. In light of comparably high levels of wealth inequality in Norway, where the relative position should also reflect unequal absolute wealth holdings, the relative wealth position should thus indicate the individuals’ economic standing in the society. Details on the identification of spouses’ wealth and missing values can be found in the Appendix.
Accounting for confounders
The relationship between grandparenthood and wealth might be influenced by gender, as women tend to become grandparents earlier (Leopold and Skopek 2015) and hold lower levels of wealth (Killewald et al. 2017). Not accounting for gender could lead to misinterpreting results as early grandparenthood causing less favorable wealth trajectories, when in reality, it may be due to women being more likely to select into both early grandparenthood and low wealth. Additionally, individuals with different educational levels might also select into different family and wealth trajectories. Therefore, we also controlled for highest education (Grundy and Kravdal 2010; Killewald et al. 2017) (ISCED-11: low [0–2], medium [3–5], high [6–8]).
Because gender and highest education are typically established before the observation period (age forty onward) and remain relatively stable over time, they are not dependent on consecutive wealth trajectories. Other potential confounders, like marital status, might not only predict wealth but also simultaneously constitute a mediating pathway between family and wealth. Including such time-varying variables would provide ambiguous information about whether associations change because of accounting for selection or blocking a causal pathway. Therefore, we refrained from including them. Even though we account for some potential selection into family and wealth trajectories, we emphasize that our analyses do not examine the mechanisms or underlying causes of the wealth trajectories. Rather, we provide a description of individual wealth accumulation trajectories and how they are stratified by experiencing typical intergenerational family life courses.
Analytical strategy
To investigate how wealth accumulation is associated with intergenerational family transitions and positions, we, first, identified clusters of typical generational placement trajectories from 1993 to 2017 using sequence and cluster analyses.
Second, we plotted average predicted percentile ranks by age and family cluster to illustrate the wealth accumulation process. The estimates were based on a regression model with wealth percentile ranks as the dependent variable and family cluster, age, and their interaction as independent variables. They also accounted for potential selection into the clusters by gender and education. To achieve this, we regressed wealth ranks on gender and education separately for each year in a first step. From these regressions, we calculated the residual wealth as the difference between observed and expected wealth (based on gender and education). We then ran our regression models of interest with residual wealth ranks as the dependent variable. These resulting wealth trajectories describe average cluster differences in relative wealth, unexplained by gender and education. Using residualized wealth offers two key advantages: first, the predicted wealth ranks can be interpreted as differences that cannot be explained through a selection into specific family clusters based on gender or education. Second, by estimating the association of control variables with wealth separately for each year, accounting for age-dependent effects, we capture the varying influence of these variables over time.
In a last step and to better understand wealth accumulation related to time since the death of the second parent and birth of the first grandchild, we used fixed-effects regression models to estimate within-person changes in wealth. All code used to prepare and analyze the data can be found at https://osf.io/43e6w/.
Results
Description of family patterns
Using sequence and cluster analyses, we identified six typical generational placement patterns (fig. 2). Cluster 1 (5%) consisted of childless focal individuals (G2) whose parents (G1) had died relatively early, that is, when they were 45 years, on average (see also table 1). In contrast, individuals in Cluster 2 (6%) were also childless but lost their parents (G1) later (age 59, on average). Therefore, we distinguished between the childless, early and the childless, late. Cluster 3 (18%) was characterized by early parental death (G1) when the focal individuals were, on average, aged 45 years, and a late transition into parenthood (G3) and grandparenthood (G4) (average ages of 28 and 60, respectively). Thus, focal individuals in this cluster spent the longest average period in a two-generation family in which they had children (G3) but their own parents were no longer alive. On average, the birth of grandchildren (G4) occurred around 14 years after their own parents (G1) had passed. Focal individuals in Cluster 4 (20%) experienced early parental death (G1) at an average age of 48, and early parenthood (G3) and grandparenthood (G4) at average ages 23 and 50, respectively. Focal individuals in Cluster 6 (27%) experienced these transitions relatively late (parenthood (G3) at average age 28, grandparenthood (G4) and death of second parent (G1) at average age 60). Both Clusters 4 and 6 represented a three-generation family structure, in which the birth of grandchildren (G4) and the death of the second parent (G1) occurred within a short period of 1–2 years, so the family always consisted of three generations alive at the same time—albeit in a changing composition (G1-G2-G3 and G2-G3-G4). Cluster 5 involved an early transition into parenthood (G3) and grandparenthood (G4) at average ages 22 and 48, respectively, and a late parental death (G1) (average age 60), so all four generations under consideration were alive simultaneously for approximately 15 years, and great-grandparenthood (G1–G4) occurred. These patterns are consistent with findings from Germany (Hünteler 2022).
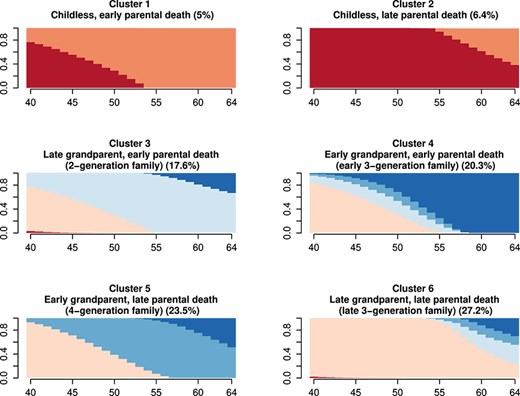
State distribution plot of generational placement patterns. Note: Vertical bars indicate distribution of generational placements (y-axis) by age (x-axis); N = 47,945.
Description of cluster characteristics at age 64; means and standard deviations (in parentheses).
| (1) | (2) | (3) | (4) | (5) | (6) | ||
|---|---|---|---|---|---|---|---|
| Childless, early parental death | Childless, late parental death | Late grandparent, early parental death | Early grandparent, early parental death | Early grandparent, late parental death | Late grandparent, late parental death | ANOVA/χ2 P-value | |
| Parent | 0.00a | 0.01a | 1.00 | 1.00 | 1.00 | 1.00 | .00 |
| Number of children | 0.01a | 0.01a | 2.22 | 2.44 | 2.50 | 2.24 | .00 |
| (0.08) | (0.13) | (0.92) | (0.95) | (0.98) | (0.92) | ||
| Age at transition to parenthood | 55.90a | 54.66a | 28.18 | 23.12 | 22.44 | 28.04 | .00 |
| (3.25) | (2.24) | (6.00) | (3.44) | (3.15) | (5.45) | ||
| Grandparent | 0.00 | 0.00 | 0.33 | 1.00 | 1.00 | 0.44 | .00 |
| Number of grandchildren | 0.00 | 0.00 | 0.57 | 2.28 | 2.38 | 0.78 | .00 |
| (0.00) | (0.00) | (0.89) | (0.83) | (0.89) | (0.97) | ||
| Age at transition to grandparenthood | . | . | 59.74 | 50.25 | 48.48 | 59.73 | .00 |
| (.) | (.) | (2.83) | (5.00) | (5.03) | (2.52) | ||
| Both parents dead | 1.00 | 0.62 | 1.00 | 1.00 | 0.49 | 0.62 | .00 |
| Age at death of second parent | 45.18 | 59.42 | 45.42 | 48.32 | 60.12 | 59.77 | .00 |
| (7.17) | (2.81) | (7.43) | (7.09) | (2.93) | (2.68) | ||
| Observations | 2,388 | 3,087 | 8,434 | 9,749 | 11,248 | 13,039 | |
| Percentage of total | 5 | 6 | 18 | 20 | 24 | 27 |
Note: N = 47,945; significance testing on group differences is based on ANOVA for continuous and on χ2-tests for categorical variables, two-tailed.
Because individual trajectories are sorted by an algorithm into the clusters according to the similarity to other trajectories (which is sensitive to timing), some individuals who became parents at a high age were sorted into the childless cluster.
Table 2 contains the sociodemographic composition of the clusters. In addition to gender and education, we display marital status (unmarried, married, widowed, divorced, separated), the region the individual lived in, and absolute wealth holdings in 1993 and 2017, respectively. Most notably and in line with previous research (Grundy and Kravdal 2010; Leopold and Skopek 2015), the earlier three-generation and four-generation family patterns (Clusters 4 and 5)—characterized by early (grand)parenthood—contained the highest shares of women, individuals with low or medium education, and residents in rural areas. Contrasting, cluster differences based on the timing of parental death were less pronounced. The childless clusters were characterized by most individuals being male, unmarried, living in Norway’s capital, Oslo, and the highest share of individuals with low education (if they also experienced earlier parental death, childless early).
Sociodemographic composition of clusters (means).
| (1) | (2) | (3) | (4) | (5) | (6) | ||
|---|---|---|---|---|---|---|---|
| Childless, early parental death | Childless, late parental death | Late grandparent, early parental death | Early grandparent, early parental death | Early grandparent, late parental death | Late grandparent, late parental death | ANOVA/χ2 P-value | |
| Female | 0.40 | 0.41 | 0.46 | 0.56 | 0.58 | 0.46 | .00 |
| Highest education | |||||||
| Low (0–2) | 0.26 | 0.21 | 0.15 | 0.23 | 0.20 | 0.12 | .00 |
| Medium (3–5) | 0.47 | 0.48 | 0.51 | 0.57 | 0.59 | 0.49 | .00 |
| High (6–8) | 0.27 | 0.32 | 0.34 | 0.20 | 0.21 | 0.40 | .00 |
| Marital status 1993 | |||||||
| Unmarried | 0.74 | 0.71 | 0.12 | 0.04 | 0.03 | 0.10 | .00 |
| Married | 0.19 | 0.21 | 0.75 | 0.79 | 0.80 | 0.78 | .00 |
| Widowed | 0.00 | 0.00 | 0.01 | 0.01 | 0.01 | 0.00 | .55 |
| Divorced | 0.06 | 0.06 | 0.09 | 0.12 | 0.13 | 0.09 | .00 |
| Separated | 0.01 | 0.01 | 0.03 | 0.04 | 0.04 | 0.03 | .00 |
| Marital status 2017 | |||||||
| Unmarried | 0.61 | 0.59 | 0.07 | 0.03 | 0.02 | 0.06 | .00 |
| Married | 0.26 | 0.28 | 0.67 | 0.69 | 0.70 | 0.68 | .00 |
| Widowed | 0.03 | 0.03 | 0.04 | 0.05 | 0.05 | 0.04 | .01 |
| Divorced | 0.09 | 0.10 | 0.20 | 0.21 | 0.21 | 0.20 | .00 |
| Separated | 0.01 | 0.01 | 0.01 | 0.01 | 0.01 | 0.01 | .00 |
| Region 1993 | |||||||
| Oslo, Bærum | 0.20 | 0.22 | 0.13 | 0.06 | 0.05 | 0.13 | .00 |
| Rest of Akershus | 0.06 | 0.07 | 0.09 | 0.08 | 0.07 | 0.09 | .00 |
| Stavanger, Bergen, Trondheim | 0.12 | 0.12 | 0.10 | 0.10 | 0.10 | 0.11 | .39 |
| Rest of Norway | 0.62 | 0.59 | 0.68 | 0.76 | 0.78 | 0.66 | .00 |
| Region 2017 | |||||||
| Oslo, Bærum | 0.16 | 0.19 | 0.11 | 0.06 | 0.05 | 0.13 | .00 |
| Rest of Akershus | 0.07 | 0.07 | 0.09 | 0.07 | 0.07 | 0.09 | .01 |
| Stavanger, Bergen, Trondheim | 0.11 | 0.10 | 0.10 | 0.09 | 0.10 | 0.11 | .30 |
| Rest of Norway | 0.66 | 0.64 | 0.70 | 0.78 | 0.79 | 0.67 | .00 |
| Median wealtha | |||||||
| Total gross 1993 | 138,407 | 136,376 | 176,439 | 168,663 | 168,502 | 181,654 | .00 |
| Total gross 2017 | 311,559 | 351,893 | 342,286 | 292,868 | 307,608 | 391,833 | .00 |
| Total net 1993 | 89,160 | 86,824 | 121,362 | 115,769 | 114,973 | 123,318 | .00 |
| Total net 2017 | 269,378 | 311,714 | 286,825 | 240,802 | 254,471 | 335,760 | .00 |
| Total debt 1993 | 33,738 | 32,567 | 52,043 | 49,170 | 50,873 | 55,236 | .00 |
| Total debt 2017 | 13,131 | 11,374 | 36,409 | 33,789 | 35,461 | 36,911 | .00 |
| Observations | 2388 | 3087 | 8434 | 9749 | 11,248 | 13,039 | |
| Percentage of total | 5 | 6 | 18 | 20 | 24 | 27 |
Note: N = 47,945; significance testing on group differences is based on ANOVA for continuous and on χ2-tests for categorical variables, two-tailed.
US dollar, adjusted for inflation.
Wealth accumulation by family pattern
Family-wealth trajectories net of gender and education
Figure 3 depicts the average residual wealth percentile ranks across age by family pattern, calculated as the difference between observed and predicted (through gender and education) wealth ranks, together with the mean age of family transitions during the observation period (find more details in the Analytical Strategy; results in table A1, Models 2, 5, and 8).
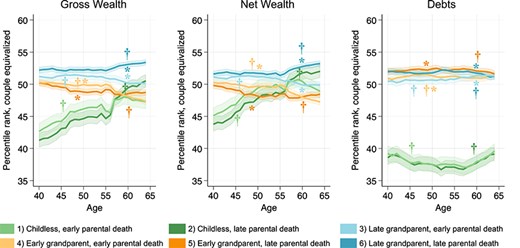
Predicted residual wealth percentile ranks (after accounting for gender and education) across age by family cluster (95% confidence intervals, two-tailed). Note: N = 47,945; †Mean age at death of second parent; *Mean age at birth of first grandchild; rescaled y-axis to match original rank scale from 0 to 100. Based on Models 2, 5, and 8, table A1.
The clusters differed in the level as well as the development of wealth over time, similarly in gross and net wealth. Net wealth trajectories appeared slightly more concentrated and less dispersed. Differences in debts by family pattern were rather stable but slightly decreasing over time. Because the timing of the transitions to parenthood and grandparenthood within each cluster is strongly correlated, in the following, we sometimes describe the results in relation to both transitions simultaneously, although their underlying links with wealth likely differ.
Three main patterns emerged based on the occurrence and timing of (grand)parenthood: first, childless individuals (Clusters 1 and 2) exhibited the lowest gross and net wealth positions at age 40 but reached the wealth levels of individuals with children by the end of their fifties considering gross and, by the end of their forties, considering net wealth. They even surpassed most of the parent-clusters’ net wealth ranks and, if experiencing parental death later (Cluster 2), also their gross wealth ranks. Second, individuals with early transitions into (grand)parenthood (Clusters 4 and 5, earlier three-generation and four-generation family) exhibited a medium wealth position at age 40, which consistently decreased and resulted in the lowest gross and net wealth ranks at age 64. Conversely, the consistently highest levels of wealth were observed for those with late transitions into (grand)parenthood (Clusters 3 and 6, two-generation and later three-generation family). Third, debts were substantively lower for the patterns characterized by childlessness compared to those by parenthood. The shape of the relative debt holdings of childless individuals followed a shallow u-shape, resulting in the smallest debt differences between parents and individuals without children at ages 40 and 64.
Over time, gross and net wealth differences fanned out, which seems to be associated with the timing of parental death: from age 55 onward, individuals in the later three-generation-family pattern (Cluster 6) started to experience the death of the second parent (see fig. 2), coinciding with a pronounced increase in wealth (see fig. 3). However, for the cluster with earlier parental death given a similar average age at the transition into (grand)parenthood (Cluster 3, two-generation family), no major change in the average wealth trajectory was observed when the share of individuals experiencing parental death increased. The same pattern is observable for the two childless clusters (Clusters 1 and 2). For the two clusters with early (grand)parenthood, individuals with a later parental death (Cluster 5, four-generation-family) first showed a slightly lower wealth position between their late forties to their late fifties compared to those with an earlier parental death (Cluster 4, earlier three-generation family). Once individuals in the four-generation-family started to experience parental death, this pattern also reversed, so they had higher relative wealth at age 64 than those in the earlier three-generation family. Relative debts also seemed to be associated with the timing of parental death for parents: Between ages 40 and 57, those who experienced parental death later (Clusters 5 and 6, four-generation and later three-generation family) exhibited higher levels of debts compared to those experiencing it earlier (Clusters 3 and 4, two-generation and earlier three-generation family).
These findings illustrate that wealth trajectories differ not only by whether but also by when individuals experience parental death or become parents and grandparents, which highlights the need for a long-term investigation of the (grand)parenthood-wealth-nexus. Furthermore, wealth trajectories also differed by combinations of (the timing of) the transitions into (grand)parenthood and parental death.
Differences in relative wealth translated into substantial absolute wealth differences that increased over the observation period. In 1993, the absolute difference between the lowest and highest average predicted gross wealth ranks was around 23,200 USD (inflation-adjusted and net of differences by gender and education; 12,100 USD for debts). In 2017, the difference between the average predicted highest and lowest ranks was associated with an absolute difference of around 32,600 USD (18,500 USD for debts). For net wealth, these differences were even larger (16,400 USD vs. 35,900 USD).
Differences in the wealth accumulation patterns were consistent but, as would be expected, more pronounced in a regression model that did not account for differences in gender and highest education (table A1, Models 1, 4, and 7; fig. A1).
Lastly, we must consider potential bias in real capital estimates due to changes in the Norwegian tax authorities' evaluation process in 2010. Prior to 2010, property values were based on the construction year. After 2010, hedonic price calculation was used, factoring in property size, number of rooms, etc. The shift in wealth levels between 2009 and 2010 may reflect this change rather than being associated with family patterns, leading to an overestimation of the family-wealth link. A robustness check with individuals born in 1956 indicates that this disruption around age 55–57 is indeed likely related to the changed evaluation strategy (period effect), though the overall trend remained stable. However, we cannot rule out that the evaluation change affected wealth in each family cluster differently.
Fixed-effects results
In addition to the more holistic description of the wealth accumulation across family transitions, we estimated individual fixed-effects models to describe average wealth development in relation to time since the death of the second parent and birth of the first grandchild. These analyses included individuals from the main model who had not experienced these transitions by age 40, with 44,626 at risk of losing a second parent and 47,157 at risk of becoming grandparents. Of those, 32,674 experienced parental death, and 28,802 became grandparents by age 64.
The models use binary variables (0 vs. 1) for time since family transitions (in years) and age. Individuals without the transition were assigned a constant value to estimate age coefficients. The coefficients for time since family transition indicate the within-person wealth difference compared to the reference period, 24 years before the transition, net of age. This assumes that those experiencing the transition would have had the same age-wealth trajectory as those not experiencing it if the transition had not occurred.
The results indicate that both net and gross wealth increased sharply by about three percentile ranks in the year of death of the second parent, compared to the reference period 24 years before (fig. A2, left column). Note that the percentile rank up until the final year before the parent’s death (−1) was not substantially or statistically different from the reference period, pointing to a wealth-enhancing effect through the receipt of inheritances immediately after the second parent’s death. The increase in wealth rank was maintained for about 6 years, although declining in size, before subsequently returning to initial levels. A smaller and statistically insignificant drop in debt of about 0.9 percentile ranks was observed in the first year after the second parent’s death.
As regards wealth accumulation around the time of the birth of the first grandchild, the fixed-effects models showed an inverse u-shape for gross and net wealth percentile ranks, with increasing ranks from the reference period 24 years ahead of grandchild birth until the start of a decline approximately 15 years ahead of grandchild birth. The wealth levels fell below those observed 24 years ahead of grandchild birth within a few years after the birth of the grandchild. The wealth rank trajectories showed no sign of discontinuity closely linked to the birth of the first grandchild, suggesting no larger single transfer of wealth related to grandparenthood, but not precluding smaller and/or continuous saving and dissaving of wealth related to grandparenthood. Percentile ranks for debts were stable across the time since grandchild birth.
Robustness checks
We conducted several robustness checks. First, to account for potential confounding of the results by the family of origin, we added the number of siblings and parents’ highest education (both measured in 1993) when calculating the year-specific residualized wealth ranks. Our main findings remained unchanged, except that level differences slightly decreased, as would be expected (see fig. A3). Thus, we find some evidence to strengthen our expectation that differences in wealth accumulation by the focal individuals’ intergenerational family life courses exist and that they do not solely root in differences in the family of origin.
Second, we used the alternative specification of a multivariate linear regression model that included gender and education to control for potential selection by these variables (without interactions with age). Results were highly similar between the multivariate and the “residual” models, thus strengthening the robustness of our findings (see fig. A4 and table A1).
Third, we replicated the analyses with individuals born in 1956, that is, 3 years later than the focal individuals. The identified clusters were highly comparable, with differences occurring in the expected direction. Notably, the shares of the later three-generation family and the childless with a later parental death were larger, reflecting the postponement and the reduction of fertility and mortality of the second demographic transition (see also Hünteler 2022). Results of the regression analyses were also very similar, supporting the robustness of our conclusions. The small fluctuations in overall wealth accumulation trajectories around 2001/2002 and 2008–2010 seemed related to period rather than age effects. Possible explanations might concern the introduction of the Euro and its effect on the Norwegian Krone as well as the 2008 financial crisis and the changed value assessment of housing (see description in Results above).
Fourth, to address potential reporting bias among individuals living in couples, we analyzed individually reported instead of couple-equivalized wealth percentile ranks. As expected, the stratification of wealth accumulation by family clusters differed between both operationalizations, mostly in terms of the levels of wealth and to a lesser extent in their development over time. In line with our assumption, it seems as if the wealth reports differ by gender, which can subsequently explain wealth differences by family pattern. For instance, because men are more likely childless paired with higher wealth ranks than women, the childless clusters ranked overall higher and increased less steeply over time compared to the couple-equivalized rank. Couple-equivalized wealth ranks seem to reduce this reporting bias.
Discussion
This study provided an encompassing description of the association of individual wealth holdings with multiple intergenerational family transitions and their resulting positions across the life course. It extends existing research in that it moves beyond average associations of single family transitions with wealth toward accounting for heterogeneities in family life courses (see also Gruijters et al. 2023). The analyses utilized registers for virtually the full Norwegian population born in 1953. In a two-step procedure, we first identified distinct family clusters that differed in the occurrence, timing, and ordering of the death of the second parent and the transitions into parent- and grandparenthood, using a combination of sequence and cluster analysis. In a second step, we ran linear regression analyses to describe wealth accumulation during ages 40–64 for these family clusters.
Gross and net wealth levels and accumulation were most strongly stratified by the occurrence and timing of (grand)parenthood: the highest relative wealth rankings were observed among those experiencing (grand)parenthood later in life, and only the two clusters with earlier (grand)parenthood transitions showed a long-term decline in their wealth ranks. Individuals without children had the lowest wealth position at age 40 but caught up with (and partly overtook) the clusters with early (grand)parenthood during the observation period. Debts were clearly and almost exclusively stratified by the occurrence of (grand)parenthood, with childless individuals having substantively less debts than individuals with children. These differences remained fairly stable over age. Regarding the loss of own parents, clusters with a later (vs. earlier) parental death held relatively more gross and net wealth from the mid- and later-fifties onward, compared to individuals from the respective clusters with similar occurrence and timing of (grand)parenthood.
Wealth accumulation stratified by family patterns was similar for gross and net wealth ranks, though net wealth ranks showed less pronounced differences with larger absolute wealth gaps. Notably, net wealth ranks of individuals without children were overall higher compared to gross wealth ranks, which is also reflected in childless individuals having substantially fewer debts (but also less real capital, see figs A2, A6, and A7 in the Appendix). This may correspond to larger investments for parents during mid-adulthood, who usually acquire larger housing, often associated with a large amount of debt. At the same time, a large share of the childless individuals was not married and may be perceived as less credit-worthy, also explaining why they may have had fewer debts. However, they seem to be able to increase their gross wealth more strongly as they aged than any other group, potentially because of larger expenses for individuals with children (household costs or costs related to larger debt, for example).
Our study suggests that the benefits of having a larger intergenerational kinship reservoir (Cullati et al. 2018), for instance, for mental well-being (Hünteler and Hank 2023), may not extend to wealth. We found that individuals experiencing the four-generation family pattern exhibited one of the lower and decreasing relative wealth trajectories. In contrast, both childless and the two-generation family, characterized by few simultaneously living generations, showed the strongest increase in relative wealth (from the lowest to medium or second-highest levels considering net wealth) or a high and largely stable wealth position, respectively. Thus, our analyses imply that wealth as a reserve seems bound to the family as a whole, meaning that family wealth is distributed among living kin, resulting in less individually owned wealth in families with more generations alive (see also Hansen 2014; Keister 2003).
Nonetheless, large differences in individual net and gross wealth positions between both three-generation-family clusters were observed in which individuals experience the same intergenerational family compositions but with a different timing of the transitions. First, this supports the life-course principle that the life stage of (family) transitions and the duration spent in resulting positions is relevant. Second, (non)conformity with standard life courses might matter because individuals in the most common family cluster, the late three-generation family, consistently held the highest wealth position over the observation period while also holding (and being granted) most debts. This matches the notion that standard life courses align with societal norms and welfare state structures, thus facing optimal conditions to accumulate wealth (Kapelle and Vidal 2022).
Lastly, wealth stratification seemed to be simultaneously associated with the occurrence and timing of all considered family transitions. For instance, although childless individuals who experienced parental death earlier had significantly lower wealth ranks than almost all other clusters at age 40, by age 64, they had reached similar wealth levels as those experiencing early (grand)parenthood. This points to the importance of accounting for the embeddedness of single family transitions (or their absence) into the larger life course because the association of one life event (parenthood) with wealth may be outbalanced or reinforced by experiencing another life event (parental death).
Considering single family transitions and positions, we demonstrate, particularly for the association between parenthood and wealth, that wealth differences vary over the life course (see Van Winkle and Monden 2022). The lower wealth and debts rankings observed for individuals without children at age 40 may stem from their lower needs and fewer incentives to acquire (larger) housing and family savings. Their increase in wealth, in turn, could have been facilitated by parents’ larger consumption and lower disposable income. Parents might also transfer wealth to their (grand)children as inter vivos, which does not equally apply to childless persons. Importantly, these explanations should not apply to all childless individuals equally because these clusters are likely heterogeneous in their family and socio-economic (including wealth) composition (see also Gruijters et al. 2023). Also, childless individuals were shown to direct their financial transfers more strongly toward charitable giving than parents as their support networks were more diverse (Albertini and Kohli 2009). Regarding the timing of parenthood our results supported the expected (long-lasting) association of later parenthood with higher relative wealth holdings compared to earlier parenthood. This underscores the importance of access to wealth in early adulthood as a life phase critical for large-scale investments—which can be disrupted by an early parenthood—as well as the cumulative advantage of such investments over time (see Lersch et al. 2017, for instance).
Our results suggest that parental death and its timing are important for wealth accumulation. The findings support previous research implying that later (vs. earlier) inheritances are associated with higher returns to net and gross wealth (Benton and Keister 2017) and that potential initial advantages of “early inheritance-receivers” may not prevail over age—potentially because individuals use inheritances differently depending on the life stage. Earlier inhertiances might primarily be used for consumption and to pay off debts, while later inheritances might be used to invest in assets. This might be particularly feasible for those becoming a parent later or childless individuals who might have accumulated a considerable amount of assets until late adulthood, coinciding with the receipt of inheritances. Additionally, childless individuals might benefit from not sharing potential inheritances with their own children. Lastly, individuals who experienced the death of their parents later in life might have also benefited from a larger generational overlap in which they could be supported by their parents—financially, instrumentally, and emotionally.
Finally, our results regarding the association of grandparenthood and wealth accumulation are inconclusive. We did not find consistent divergences in wealth accumulation patterns for any family cluster when individuals became grandparents nor a change in the overall average wealth holdings around the birth of the first grandchild. Also, previous research has remained inconclusive whether the grandparent–grandchild association was driven by direct financial transfers or the transmission of social capital (Galster and Wessel 2019; Pfeffer and Killewald 2018). Thus, grandparents might support their grandchildren more indirectly and transfer financial resources on several occasions (prior to, upon, or (long) after the birth of grandchildren). In Norway, grandparents were shown to be important for their grandchildren’s acquisition of (more expensive) housing through direct financial transfers (Galster and Wessel 2019; Hansen and Wiborg 2019). However, our study’s observation period might not fully cover this transmission channel, as the oldest grandchildren were still very young during our observations. The channels of wealth transmission related to grandparenthood and the timing of the transition into grandparenthood pose challenges for reliable investigation.
Limitations
Despite using population-wide Norwegian administrative data, this study is not free from limitations. First, family transitions may be underestimated due to examining a still-living cohort and the right-censored observation period, meaning some individuals had not yet experienced parental death or grandparenthood. We also excluded individuals with first- or second-generation migration backgrounds, limiting generalizability. Second, the family trajectories focus on vertical, biological family relationships, excluding stepfamily ties or partnership transitions like marriage and divorce or the partner’s family transitions, which could impact wealth. Third, our wealth measure is an approximation of the market value of real and, in parts, financial capital that might underestimate wealth, particularly of the very rich. Moreover, we cannot account for the changed assessment of real estate in 2010. Fourth, the identified associations might be subject to reversed causality, so family transitions may not only affect wealth but also (expected) wealth might affect family transitions. Lastly, our findings might reflect prior wealth inequalities inherited from the family of origin. Across multiple generations, the availability and transmission of wealth determines the pathways for future generations (Gilligan et al. 2018; Mare 2011). Although we were not able to account for all possible family background characteristics, such as parental social class (Hansen and Toft 2021), robustness checks support our overall conclusions that the experience of parent- and grandparenthood as well as parental death depict one channel of how these wealth inequalities could be transmitted across generations, possibly leading to cumulative inequalities over individual life courses.
Conclusion
The (intergenerational) family network plays a crucial role in transferring wealth and contributing to social inequalities in today’s societies. Our study is the first to provide a long-term description of the family–wealth association across individual life courses, considering the interplay of the occurrence, timing, and ordering of multiple family transitions and positions. Future research could build on this study to examine wealth accumulation within typical generational placement trajectories and to investigate the life-course consequences of specific family transitions over a longer time period. In the future, the family–wealth associations might change in their kind and strength because of the continuously changing demographic rates that determine the family composition (Hellstrand et al. 2021) as well as changing returns to typical family trajectories across time (Gruijters et al. 2023). Compared to later-born cohorts, intergenerational transmission of wealth might be of lower relevance for the studied birth cohort 1953 because their parents’ wealth accumulation was largely affected by the periods of war, reducing the possibility and extent of intergenerational financial transfers. Also, housing was more affordable for the 1953 cohort, which reduced the importance of inherited housing for their wealth accumulation. Country-comparative research or analyses with more recent cohorts could provide further insights into the contribution of the family–wealth associations to social inequalities.
Acknowledgments
The authors thank Elin Halvorsen for sharing her invaluable expertise on using the Norwegian tax register to assess and analyze wealth and her thoughts on our statistical models, Marianne Nordli Hansen for her explanations on how to correct the assessment of wealth for a potential bias in the estimation of real capital, as well as Øystein Kravdal, Jardar Sørvoll, Karsten Hank, Thomas Leopold, and Davide Gritti for their inspiring thoughts on earlier versions. A thank you also goes to the colleagues discussing our ideas during the RC28 Spring Conference 2022, the DGS Congress 2022, the Norwegian Institute of Public Health lunch seminar, the ISS research colloquium in Cologne, and the ECSR Gender and Wealth Inequality Network workshop in Birmingham.
Funding
This research was supported by the Research Council of Norway through its Centres of Excellence funding scheme (project number 262700), and it was conducted while the first author received a scholarship from the Cologne Graduate School in Management, Economics and Social Sciences of the University of Cologne.
Conflicts of interest
None declared.
Data availability
The data underlying this article encompass the Norwegian Population Register, Education Database, and Tax Register for entire cohorts of the Norwegian population. Researchers can access the data by application to the Regional Committees for Medical and Health Research Ethics and the data owners (Statistics Norway). The authors cannot share the data due to the sensitive nature and potential for identification. However, other researchers can contact the authors if they have questions concerning the data.
