


Abstract
Social and academic adjustment deteriorate in the years preceding a psychotic disorder diagnosis. Analyses of premorbid adjustment have recently been extended into the clinical high risk for psychosis (CHR) syndrome to identify risk factors and developmental pathways toward psychotic disorders. Work so far has been at the between-person level, which has constrained analyses of premorbid adjustment, clinical covariates, and conversion to psychosis.
Growth-curve models examined longitudinal trajectories in retrospective reports of premorbid social and academic adjustment from youth at CHR (n = 498). Interaction models tested whether known covariates of premorbid adjustment problems (attenuated negative symptoms, cognition, and childhood trauma) were associated with different premorbid adjustment trajectories in converters vs non-converters (ie, participants who did/did not develop psychotic disorders within 2-year follow-up).
Converters reported poorer social adjustment throughout the premorbid period. Converters who developed psychosis with an affective component reported poorer academic adjustment throughout the premorbid period than those who developed non-affective psychosis. Tentatively, baseline attenuated negative symptoms may have been associated with worsening social adjustment in the premorbid period for non-converters only. Childhood trauma impact was associated with fewer academic functioning problems among converters. Cognition effects did not differ based on conversion status.
Premorbid social function is an important factor in risk for conversion to psychosis. Negative symptoms and childhood trauma had different relationships to premorbid functioning in converters vs non-converters. Mechanisms linking symptoms and trauma to functional impairment may be different in converters vs non-converters, suggesting possible new avenues for risk assessment.
Introduction
Retrospective studies of individuals with psychotic disorders often find deteriorating psychosocial adjustment in the premorbid period, from childhood through late adolescence or early adulthood.1–3 Not only does adjustment deteriorate over time prior to symptom onset,4 but the extent of deterioration correlates with later symptom severity.5 Similar patterns have been observed in family members of individuals with psychotic disorders,3,6,7 suggesting that deteriorating psychosocial adjustment is a risk factor for psychotic disorders. Premorbid adjustment can also be assessed prior to the emergence of a psychotic disorder (ie, in the clinical high risk for psychosis syndrome). However, studies in this population have so far been conducted at the between-person level (eg, through group comparisons), which has constrained analyses of relationships between premorbid adjustment and clinical covariates. Notably, it is currently unknown whether clinical correlates (eg, symptoms, trauma exposure, neurocognition) may have different impacts on premorbid functioning in individuals who go on to develop psychotic disorders, compared to those who do not. Growth-curve modeling can address these limitations by estimating individual differences in change over time, offering a more dynamic understanding of clinical variables affecting risk for psychotic disorders, and providing valuable insights into the etiology of these disorders.
Premorbid Functioning in Clinical High Risk
Due to the importance of identifying risk factors for psychotic disorders, research has now begun to examine premorbid adjustment in the clinical high risk for psychosis (CHR) syndrome, a high-risk state characterized by attenuated psychotic symptoms, brief intermittent psychotic symptoms, and/or genetic risk and functional decline.8 Individuals at CHR are typically identified in late adolescence or emerging adulthood and are at dramatically increased risk of psychotic disorders, with roughly 25% developing a psychotic disorder within 3 years of identification.9 Research on CHR is particularly valuable for identifying longitudinal trajectories of symptoms and functioning prior to the onset of a psychotic disorder eg.10 A number of studies have now examined premorbid adjustment in CHR, finding that individuals meeting CHR criteria have poorer premorbid adjustment compared to their normatively developing peers,11,12 that premorbid adjustment relates to symptom severity13 and structural cortical abnormalities,14 that premorbid adjustment problems tend to carry over into persistent functional impairment at 1-year follow-up,15 and that worse premorbid adjustment—particularly in the social domain—predicts higher rates of conversion to psychotic disorders13,16,17 and higher rates of conversion to schizophrenia than to other psychotic disorders.18
Clinical Correlates of Premorbid Functioning
Specific clinical correlates often accompany patterns of deteriorating premorbid adjustment. In CHR samples, individuals with more severe attenuated negative symptoms tend to report poorer premorbid adjustment.19 For instance, Lyngberg and colleagues13 found that attenuated negative symptoms were highest for individuals at CHR whose social adjustment had deteriorated from childhood through late adolescence. Note that attenuated negative symptoms refer to subclinical negative symptoms reported in CHR samples, but there is some debate as to how distinct these symptoms are from mood symptoms.20–22 Trauma and other adverse experiences (eg, bullying, neglect) in childhood are another important piece of the puzzle. Individuals at CHR tend to report more frequent and severe childhood adverse experiences.23,24 Two first-episode psychosis studies25,26 and one study with a small CHR sample12 have found poorer premorbid adjustment among individuals experiencing more severe childhood trauma, suggesting that trajectories of adjustment may reflect the lingering effects of childhood trauma. Finally, several studies of individuals with schizophrenia or first-episode psychosis suggest a role for cognitive factors, with overall intelligence quotient (IQ),3,27 and verbal learning5,28 both tending to be more impaired in individuals with poorer premorbid adjustment. These cognitive variables have not yet been tested in CHR samples.
Growth Curve Modeling
Although the CHR syndrome provides a unique opportunity to study clinical correlates proximally to premorbid adjustment, previous studies have typically analyzed data at the between-person level, eg, by examining premorbid functioning in specific developmental periods, eg,17,29 or collapsing developmental periods together eg.28 More recently, studies have clustered participants into discrete trajectories of premorbid adjustment and compared conversion rates and covariates between groups.13,30 However, the resulting analyses assign all individuals in each group to a single trajectory, rather than allowing trajectories to vary at the within-person level. Building on these previous studies, an important next step is to examine longitudinal trajectories of premorbid adjustment as within-person change over time in a growth curve modeling framework.
Growth curve modeling (an application of multilevel modeling to longitudinal data) offers a dynamic approach to understanding premorbid adjustment by quantitatively modeling within-person change over time. After fitting within-person slopes for change over time in premorbid adjustment, cross-level interactions between time and conversion status can test whether rates of change in premorbid adjustment were different for individuals at CHR who later develop psychotic disorders (“converters”) vs those who do not (“non-converters”). Three-way interactions between time, conversion status, and clinical correlates can take these analyses a step further to test whether clinical correlates are associated with different rates of change in premorbid adjustment for converters vs non-converters. Findings from growth curve models can aid in prediction of psychotic disorders by identifying relationships between covariates and premorbid adjustment that are common to both converters and non-converters, and differentiating these from relationships between covariates and premorbid adjustment that are unique to converters. For example, it may be the case that neurocognition has an especially strong effect on premorbid adjustment for individuals who later convert to psychosis. Such interactive effects can provide important insight into the etiology of psychotic disorders and support ongoing efforts at risk assessment.
The Current Study
The current study fit growth curve models to define longitudinal trajectories in retrospective reports of premorbid adjustment among individuals meeting CHR criteria (n = 498). Then, interaction effects were tested to determine whether retrospective trajectories differed for converters vs non-converters, and converters who developed affective vs non-affective psychosis. Finally, three-way interaction effects were tested to determine whether clinical covariates (attenuated negative symptoms, cognition, and childhood trauma) were associated with different retrospective trajectories of premorbid adjustment in converters vs non-converters. Based on previous research, we hypothesized that premorbid social adjustment would be worse in converters than non-converters and that clinical covariates would tend to have stronger associations with premorbid adjustment trajectories in converters than in non-converters.
Methods
Participants
Participants included 498 individuals meeting CHR criteria, 53 of whom (10.6%) developed a psychotic disorder within 2 years of recruitment. Participants were recruited as part of the North American Prodrome Longitudinal Study (NAPLS-3), a multicenter study of psychosis risk conducted across nine sites in the United States and Canada. Participants were recruited through self-referral or provider referrals (eg, from health care providers, schools, or social service agencies) between February 2015 and November 2018 and followed for 2 years. Sample characteristics are shown in table 1. Further details on NAPLS-3 recruitment, procedures, and baseline characteristics have been previously reported.31
Sample Characteristics (n = 498)
| Variable | n or Mean | % or SD |
|---|---|---|
| Age (years) | 19.88 | 3.48 |
| Education (years) | 12.78 | 2.46 |
| Sex at Birth (male) | 287 | 57.6% |
| Transgender | 14 | 2.8% |
| Racial identity | ||
| Asian/Pacific Islander | 61 | 12.2% |
| Black | 53 | 10.6% |
| Central/South American | 23 | 4.6% |
| First Nations | 11 | 2.2% |
| Middle Eastern | 7 | 1.4% |
| White | 279 | 56.0% |
| Multiple Races | 63 | 12.6% |
| Hispanic/Latino Ethnicity | 95 | 19.1% |
| Attenuated Negative Symptoms (SIPS) | 2.12 | 1.21 |
| Verbal Learning (HVLT raw score) | 26.77 | 5.09 |
| Full-Scale IQ (WAIS-II) | 105.98 | 15.46 |
| Childhood Trauma Incidence | 217 | 43.6% |
| Childhood Trauma Impact | 7.06 | 4.62 |
| Converted to psychotic disorder (within 2 years) | 53 | 10.6% |
| Conversion diagnosis | ||
| Some affective componenta | 8 | 15.1% |
| Non-affectiveb | 41 | 77.3% |
| Unable to determinec | 4 | 7.5% |
Note: aDiagnoses with an affective component included six schizoaffective, one major depressive disorder with psychotic features, and one bipolar disorder with psychotic features. Note that traditional categorization of affective/non-affective psychosis would classify schizoaffective disorder as a non-affective disorder, in which case the affective disorder subgroup would be n = 2 and too small to support a subgroup analysis (see text for further discussion).
bNon-affective diagnoses included 19 schizophrenia, 5 schizophreniform, 2 delusional disorder, 14 unspecified schizophrenia spectrum or other psychotic disorder, and 1 other specified schizophrenia spectrum or other psychotic disorder.
cDiagnosis could not be confirmed in a minority of cases in which the SCID could not be administered.
NAPLS-3 inclusion criteria were age 12–30 and the presence of a psychosis-risk syndrome assessed by the Structured Interview for Psychosis-Risk Syndromes (SIPS) version 5.6.8 Exclusion criteria included lifetime presence of a psychotic disorder, IQ < 70, history of a central nervous system disorder, and attenuated psychotic symptoms better explained by the presence of a diagnosable nonpsychotic disorder. The larger NAPLS-3 sample included 710 individuals meeting CHR criteria. The current study includes all CHR participants who had complete premorbid adjustment data for childhood, early adolescent, and late adolescent periods. This exclusion limited the final sample to ages 16–30 (mean age = 19.9, SD = 3.48), as younger participants did not have late adolescent premorbid adjustment data. Additionally, included participants were more likely to be male, 56% vs 47%, χ2 = 4.77, P = .029, to have experienced childhood trauma, 41% vs 29%, χ2(1) = 7.97, P = .004, and to have better verbal learning performance, d = 0.27, t = 3.39, P < .001, compared to participants who were excluded due to incomplete premorbid adjustment data. Included vs excluded participants did not differ on other demographic and clinical variables (race, ethnicity, attenuated psychotic symptoms, IQ).
Procedures
Clinician-administered interviews at baseline assessed premorbid adjustment, attenuated psychotic symptoms, cognition, and trauma exposure. Diagnostic determinations of CHR status were made in weekly consensus calls with clinical raters at all nine sites chaired by J. Addington. Conversion to psychosis and conversion diagnosis within the 2-year follow-up period was established by the Structured Clinical Interview for DSM-5 (SCID-5)32 administered at the time of conversion. See Supplementary figure S1 for a study flow diagram. For analyses, diagnoses were separated into purely non-affective diagnoses (schizophrenia, schizophreniform, delusional disorder, and unspecified/other specified schizophrenia spectrum disorder) and diagnoses with at least some affective component (schizoaffective disorder, depression with psychotic features, bipolar with psychotic features). Although schizoaffective disorder is often labeled a non-affective diagnosis, it has been shown to occupy a dimensional middle ground between purely non-affective and affective psychosis.33 This affective element is relevant for understanding premorbid adjustment trajectories: relationships with premorbid adjustment relate to the severity of mood symptoms rather than the presence of a mood diagnosis,34 and multiple studies have found meaningful differences between premorbid adjustment patterns in schizophrenia vs schizoaffective disorder.18,35 For these reasons, and because of the small numbers of individuals in the sample with purely affective diagnoses (ie, mood disorder with psychotic features), the present study differentiated diagnoses with any affective component (including schizoaffective) vs no affective component. NAPLS-3 study procedures were approved by institutional review boards at all participating sites, and all participants or their parents (for participants under 18) provided written informed consent.
Measures
CHR status and attenuated positive and negative symptom severity were assessed by the Structured Interview for Psychosis-Risk Syndromes (SIPS),8 a widely used clinician-rated interview for attenuated psychotic symptoms and CHR syndromes. To avoid confounding between SIPS negative symptom content and social functioning, analyses of attenuated negative symptoms were restricted to putative persistent negative symptoms aligned with current structural models of negative symptoms (operationalized as the mean of SIPS social anhedonia, avolition, and expression of emotions items).22,36 As a note on terminology, premorbid adjustment was assessed retrospectively for periods prior to the emergence of a CHR syndrome, and some participants went on to develop psychotic disorders at follow-up (see study flow diagram in Supplemental Material S1). The SIPS was administered at baseline, at which time all participants met CHR criteria, meaning that “attenuated positive/negative symptoms” is an appropriate description of these symptoms.
Premorbid adjustment was assessed by the Premorbid Adjustment Scale (PAS),2 a semi-structured, clinician-rated interview in which participants retrospectively report on adjustment problems prior to the onset of a psychotic disorder. The PAS assesses five functional domains (sociability, peer relationships, school performance, school adaptation, and sociosexual adaptation) across four developmental periods (childhood, early adolescence, late adolescence, and early adulthood), with higher scores indicating more serious adjustment problems. The sociosexual adaptation subscale was not included in the current study, as it is only relevant in late adolescence and adulthood. Adjustment was assessed up to 1 year prior to the emergence of a CHR syndrome, to avoid confounding with acute effects of attenuated psychotic symptoms.37 Thus, participants only had data for developmental periods up to 1 year prior to CHR onset. If this fell partway through a period, scores were still assigned for that period. Eg, if CHR onset was at age 18, then the late adolescent period (age 16–18) would be scored based on adjustment in the age 16 and 17 years. The present study examined the childhood, early adolescence, and late adolescence periods, as few participants had data for the adult period. Scores were calculated for previously validated social and academic PAS factors27 as unit-weighted means of subscales making up each factor.
Childhood trauma was assessed by the Childhood Trauma and Abuse Scale,38 a clinician-rated trauma measure. This measure assessed the presence vs absence of various categories of trauma (psychological and physical bullying, emotional neglect, psychological abuse, physical abuse, and sexual abuse) in different age ranges (0–6 years, 7–12 years, 13–17 years). An impact score was also assigned for each category of trauma, ranging from 1 = “none” to 5 = “an extreme amount.” Two trauma variables were derived from this measure. Incidence of childhood trauma was defined as the presence/absence of any trauma endorsed before age 12. For participants who had experienced childhood trauma (n = 217, 44.2%), the impact of childhood trauma was defined as the sum of impact scores for each category of trauma experienced before age 12. To avoid overlap with recent research on bullying in the NAPLS-3 dataset,30 psychological and physical bullying were excluded from the current study.
Verbal learning was assessed by the Hopkins Verbal Learning Test-Revised (HVLT-R).39 General cognitive ability was assessed by the Wechsler Abbreviated Scale for Intelligence Second Edition (WASI-II) 2-subtest IQ estimate.40
Data Analysis
Trajectories of premorbid adjustment were examined in a series of growth curve models calculated in the R statistical programming language, v4.2.2,41 primarily using the lme4 package v1.1-31.42 Models were fit with restricted maximum likelihood estimation and nlotwrap optimization. All growth curve models included a random intercept and random slope for the PAS developmental period within participants. PAS developmental period was centered on early adolescence. Continuous independent variables were grand mean-centered prior to analyses. To account for developmental differences, all models included age and sex at birth as covariates.
To test differences in premorbid adjustment trajectories as a function of conversion status, a first set of models were calculated with PAS scores entered as dependent variables and developmental period, conversion status, and the developmental period × conversion status interaction entered as independent variables. Second, to test differences in premorbid adjustment trajectories as a function of conversion diagnosis, models were calculated with PAS scores entered as dependent variables and developmental period, conversion diagnosis, and the developmental period × conversion diagnosis interaction entered as independent variables.
Third, to test whether the effects of clinical correlates differed based on conversion status, additional models were calculated with PAS scores entered as dependent variables and developmental period, conversion status, the relevant clinical correlate, and the three-way developmental period × conversion status × clinical correlate interaction entered as independent variables. Four clinical correlates were tested in separate models (attenuated negative symptoms, verbal learning, trauma incidence, and trauma impact). Additionally, IQ was tested in a supplemental model. All models were calculated once with PAS social adjustment as the dependent variable and a second time with PAS academic adjustment as the dependent variable. Test of focal hypotheses (ie, significance tests for cross-level interaction coefficients) were adjusted for multiple comparisons via Benjamini & Hochberg’s False Discovery Rate correction,43 with the test family defined as all interactions predicting a given outcome.
Finally, it has been suggested that main effects and interaction effects are not interpretable when higher-order interaction effects are included in the model, regardless of whether or not the higher-order interaction is significant.44 Therefore, supplemental sets of intermediate models were calculated with main effects only, and main effects + two-way interactions. These models are reported in Supplementary material and interpreted in the main text. In most cases, coefficients in the supplemental models did not meaningfully differ from coefficients in the main models (eg, coefficient estimates within 0.00–0.02 of those reported in the text, with similar P values). For simplicity, the results section refers to coefficients from the tables presented in the main text, except in one case (impact of childhood trauma) where the interpretation of supplemental models was meaningfully different.
Results
Overall Premorbid Adjustment Trajectories in Full Sample
As shown in Supplementary table S3, social functioning, coefficient = 0.156, SE = 0.034, P < .001, and academic functioning, coefficient = 0.294, SE = 0.034, P < .001, tended to deteriorate over time in the sample as a whole (without considering the effects of conversion status or covariates).
Premorbid Adjustment and Conversion
Conversion Status
As shown in table 2 and figure 1a, social adjustment tended to be poorer in converters than in non-converters throughout the premorbid period, coefficient = 0.358, SE = 0.157, P = .022. The interaction effect was non-significant, uncorrected P = .670, indicating that the rate of change in social adjustment did not differ between converters and non-converters. As shown in table 2 and figure 1a, premorbid academic adjustment did not differ between converters and non-converters, main effect, and interaction Ps > .391.
Fixed Effect Estimates From Growth Curve Models Estimating Premorbid Adjustment as a Function of Conversion Status (Converted vs Not Converted) and Conversion Diagnosis (Affective vs Non-affective Psychosis) [With 95% Confidence Intervals]
| Conversion Status | Conversion Diagnosis | |||
|---|---|---|---|---|
| Social Adjustment | Academic Adjustment | Social Adjustment | Academic Adjustment | |
| Within-person | ||||
| Time | 0.15*** [0.08, 0.22] | 0.30*** [0.23, 0.37] | 0.12 [−0.42, 0.67] | 0.34 [−0.14, 0.83] |
| Between-person | ||||
| Age | −0.02 [−0.04, 0.01] | −0.01 [−0.04, 0.02] | −0.01 [−0.11, 0.10] | −0.04 [−0.13, 0.04] |
| Sex | 0.08 [−0.07, 0.25] | −0.34*** [−0.51, −0.17] | 0.14 [−0.58, 0.88] | −0.70* [−1.31, −0.10] |
| Conversion status | 0.36* [0.05, 0.66] | 0.13 [−0.20, 0.44] | ||
| Conversion diagnosis | 0.33 [−0.69, 1.35] | −0.98* [−1.81, −0.15] | ||
| Interactions | ||||
| Conversion status × Time | 0.05 [−0.17, 0.27] | −0.05 [−0.26, 0.17] | ||
| Conversion diagnosis × Time | 0.04 [−0.55, 0.64] | −0.10 [−0.64, 0.43] | ||
Note: Bold indicates uncorrected P < .05. To minimize inflation of the Type II error rate, FDR correction was limited to tests of focal hypotheses (interactions). No interaction effects were significant after FDR correction.
*Uncorrected P < .05; **uncorrected P < .01; ***uncorrected P < .001.
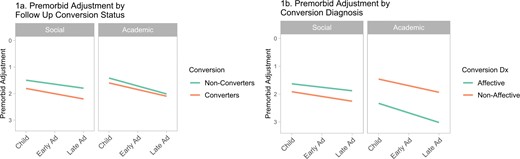
Trajectories of premorbid social and academic adjustment in 498 youth at clinical high risk for psychotic disorders, 53 of whom developed psychotic disorders within 2 years of assessment (“converters”) and 445 of whom did not (“non-converters”). (a) Shows differences in premorbid adjustment trajectories between converters and non-converters. (b) Shows differences in premorbid adjustment trajectories between participants who converted to affective vs non-affective disorders. Note that higher scores indicate more severe premorbid adjustment problems (plotted down).
Conversion Diagnosis
As shown in table 2 and figure 1b, among converters, fully non-affective psychotic disorders were associated with poorer academic adjustment throughout the premorbid period, coefficient = -0.978, SE = 0.433, P = .029. As a supplemental analysis, conversion diagnosis was restricted to high-confidence diagnoses (omitting unspecified and other specified diagnoses, see Supplementary table S1). Results were similar for academic adjustment, conversion diagnosis coefficient = −1.32, SE = 0.486, P = 011. Premorbid social adjustment did not differ based on conversion diagnosis in the full or restricted conversion diagnosis models, main effect, and interaction Ps > .508.
Attenuated Negative Symptoms, Premorbid Adjustment, and Conversion
Social Adjustment
As shown in table 3 and figure 1a, a trend suggested a three-way interaction between attenuated negative symptoms, conversion status, and developmental period in predicting premorbid social adjustment, coefficient = −0.170, SE = 0.087, uncorrected P = .051, FDR-corrected P = .121. Statistical evidence for this potential trend is weak. This potential trend would indicate that converters had similar rates of deteriorating social adjustment regardless of their level of attenuated negative symptoms, whereas non-converters had more deteriorating social adjustment when attenuated negative symptoms were more severe.
Premorbid Social Adjustment: Fixed Effect Estimates From Growth Curve Models Estimating Premorbid Social Adjustment as a Function of Conversion Status (Converted vs Not Converted) and Clinical Covariates in 498 Youth at Clinical High Risk for Psychosis [With 95% Confidence Intervals]
| Clinical Covariate | ||||
|---|---|---|---|---|
| Attenuated Negative Symptoms | Verbal Learning | Presence of Childhood Trauma | Impact of Childhood Trauma | |
| Within-person | ||||
| Time | 0.17*** [0.10, 0.23] | 0.16*** [0.09, 0.24] | 0.16** [0.06, 0.27] | 0.15** [0.03, 0.27] |
| Between-person | ||||
| Age | −0.02 [−0.04, 0.01] | −0.01 [−0.04, 0.02] | −0.03 [−0.06, 0.00] | −0.03 [−0.07, 0.01] |
| Sex | 0.10 [−0.07, 0.28] | 0.03 [−0.16, 0.23] | 0.05 [−0.14, 0.24] | −0.01 [−0.28, 0.27] |
| Conversion | 0.07 [−0.23, 0.37] | 0.32 [−0.01, 0.64] | 0.27 [−0.17, 0.70] | 0.44* [0.01, 0.88] |
| Covariate | 0.37*** [0.30, 0.45] | −0.00 [−0.02, 0.02] | 0.28** [0.07, 0.49] | 0.04* [0.00, 0.08] |
| Interactions | ||||
| Conversion × Time | 0.03 [−0.20, 0.26] | 0.03 [−0.21, 0.26] | −0.09 [−0.22, 0.40] | 0.05 [−0.28, 0.38] |
| Covariate × Conversion | 0.11 [−0.11, 0.33] | 0.05 [−0.00, 0.11] | −0.12 [−0.48, 0.74] | −0.07 [−0.15, 0.01] |
| Covariate × Time | 0.18***,c [0.12, 0.24] | −0.02**,a [−0.03, −0.01] | −0.00 [−0.15, 0.14] | −0.01 [−0.04, 0.02] |
| Covariate × Conversion × Time | −0.17† [−0.34, −0.00] | −0.01 [−0.05, 0.03] | −0.10 [−0.56, 0.34] | −0.02 [−0.08, 0.04] |
Note: Bold indicates uncorrected P < .05. To minimize inflation of the Type II error rate, FDR correction was limited to tests of focal hypotheses (interactions).
aFDR-corrected P < .05.
bFDR-corrected P < .001.
*Uncorrected P < .05; **uncorrected P < .01; ***uncorrected P < .001.
†Uncorrected P = .051.
Academic Adjustment
As shown in table 4 and figure 1a, all participants reported trajectories of worsening academic adjustment, coefficient = 0.304, SE = 0.036, P < .001, and participants with more severe attenuated negative symptoms reported poorer academic adjustment throughout the premorbid period, coefficient = 0.161, SE = 0.043, P < .001. These effects did not differ based on conversion status (interaction Ps > .297).
Premorbid Academic Adjustment: Fixed Effect Estimates From Growth Curve Models Estimating Premorbid Academic Adjustment as a Function of Conversion Status (Converted vs Not Converted) and Clinical Covariates in 498 Youth at Clinical High Risk for Psychosis [With 95% Confidence Intervals]
| Clinical Covariate | ||||
|---|---|---|---|---|
| Attenuated Negative Symptoms | Verbal Learning | Presence of Childhood Trauma | Impact of Childhood Trauma | |
| Within-person | ||||
| Time | 0.30*** [0.23, 0.38] | 0.30*** [0.22, 0.37] | 0.29*** [0.20, 0.39] | 0.31*** [0.19, 0.43] |
| Between-person | ||||
| Age | −0.01 [−0.04, 0.01] | −0.06 [−0.08, −0.04] | −0.03 [−0.05, 0.00] | −0.01 [−0.05, 0.03] |
| Sex | −0.33*** [−0.52, −0.14] | −0.23* [−0.42, −0.03] | −0.38*** [−0.57, −0.20] | −0.49*** [−0.76, −0.21] |
| Conversion | 0.10 [−0.23, 0.43] | −0.01 [−0.03, 0.02] | 0.15 [−0.27, 0.58] | 0.16 [−0.28, 0.59] |
| Covariate | 0.16*** [0.08, 0.24] | 0.05*** [−0.26, 0.37] | 0.47*** [0.27, 0.68] | 0.03 [−0.01, 0.06] |
| Interactions | ||||
| Conversion × Time | −0.05 [−0.28, 0.19] | −0.01 [−0.24, 0.22] | −0.02 [−0.32, 0.29] | −0.09 [−0.46, 0.28] |
| Covariate × Conversion | −0.13 [−0.37, 0.11] | 0.03 [−0.05, 0.08] | −0.12 [−0.72, 0.49] | −0.11**,a [−0.20, −0.02] |
| Covariate × Time | 0.08**,a [0.02, 0.14] | 0.01 [−0.01, 0.02] | 0.02 [−0.12, 0.16] | −0.01 [−0.04, 0.02] |
| Covariate × Conversion × Time | −0.10 [−0.27, 0.08] | −0.00 [−0.04, 0.04] | −0.08 [−0.51, 0.36] | 0.01 [−0.04, 0.06] |
Note: Bold indicates uncorrected P < .05. To minimize inflation of the Type II error rate, FDR correction was limited to tests of focal hypotheses (interactions).
aFDR-corrected P < .05.
*Uncorrected P < .05; **uncorrected P < .01; ***uncorrected P < .001.
Cognitive Variables, Premorbid Adjustment, and Conversion
Verbal Learning
Social Adjustment
As shown in table 3 and figure 2b, participants with worse verbal learning tended to report trajectories of worsening social adjustment in the premorbid period, verbal learning × developmental period interaction coefficient = −0.020, SE = 0.007, uncorrected P = .008, FDR-corrected P = .024. This pattern did not differ based on conversion status (interaction Ps > .073).
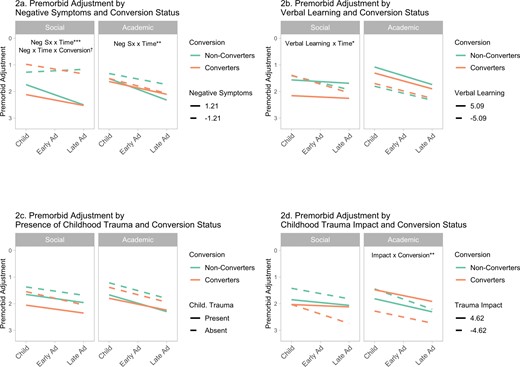
Trajectories of premorbid social and academic adjustment in 498 youth at clinical high risk for psychotic disorders, 53 of whom developed psychotic disorders within 2 years of assessment (“converters”) and 445 of whom did not (“non-converters”). Note that higher scores indicate more severe premorbid adjustment problems (plotted down). Continuous variables are shown as 1 standard deviation above and below the sample mean. Model results and significance levels are shown in table 3 (social adjustment), and table 4 (academic adjustment). Significant interactions indicated here by †P = .051; *P < .05; **P < .01; ***P < .001. FDR-corrected P values can be found in tables 3 and 4.
Academic Adjustment
As shown in table 4 and figure 2b, participants with worse verbal learning tended to report more academic adjustment difficulties throughout the premorbid period, coefficient = −0.064, SE = 0.010, P < .001. This pattern did not differ based on conversion status (interaction Ps > 321).
IQ
As a supplemental analysis to test more general cognitive deficits, the verbal learning analysis was repeated with WASI-II IQ. Results were similar to those for verbal learning (see Supplementary table S2), social: IQ × developmental period coefficient = −0.007, SE = 0.002, P = .004; academic: IQ coefficient = −0.024, SE = 0.003, P < .001.
Childhood Trauma, Premorbid Adjustment, and Conversion
Presence of Childhood Trauma
As shown in tables 3 and 4 and figure 2c, the presence of childhood trauma was associated with poorer premorbid social adjustment, coefficient = 0.228, SE = 0.107, P = .009, and academic adjustment, coefficient = 0.473, SE = 0.105, P < .001 throughout the premorbid period. These effects did not differ based on conversion status (interaction Ps > .661).
Impact of Childhood Trauma
Social Adjustment
As shown in table 3 and figure 2d, among participants who had experienced childhood trauma (n = 217, 44.2%), the subjective impact of childhood trauma appeared to be associated with poorer overall social adjustment throughout the premorbid period, coefficient = 0.036, SE = 0.017, P = .037. However, in the model limited to main effects only (Supplementary table S4), this effect was not significant, coefficient = 0.026, SE = 0.016, P = .107. Therefore, we cannot conclude that trauma impact affected premorbid social adjustment. Effects did not differ based on conversion status (interaction Ps > .087).
Academic Adjustment
As shown in table 4 and figure 2d, the subjective impact of childhood trauma interacted with conversion status to predict premorbid academic adjustment, coefficient = −0.112, SE = 0.041, P = .007, FDR-corrected P = .024. Contrary to study hypotheses, among converters, academic adjustment was worse when childhood trauma was reported as being less impactful.
Discussion
Premorbid Social Adjustment
The present study replicated a common finding that social adjustment tends to be poorer throughout the premorbid period for individuals who later convert to psychosis.13,16,17 Importantly, the current study found this finding by testing a difference in intercepts, indicating that the effect was consistent throughout the premorbid period. Previous studies have tended to find significant effects within specific developmental periods, either early adolescence,16,17 or late adolescence.13 The present study suggests an alternate interpretation, that the underlying effect may be an overall difference in social adjustment throughout the premorbid period. However, it is important to note that the number of data points per participant did not permit the estimation of nonlinear effects in the current study. More frequent measurement of adjustment or functioning in the premorbid period would be required to model nonlinear effects. The current study also replicated the specificity of the relationship between social adjustment and conversion, finding that academic adjustment did not differ between converters and non-converters.
The present study also found a novel result of poorer academic adjustment in CHR individuals who later converted to diagnoses with at least some affective component (eg, schizoaffective disorder), as opposed to purely non-affective psychosis (eg, schizophrenia). The present results should be interpreted cautiously as they were based on a small number of confirmed diagnoses. Notably, the sample size of disorders conventionally classified as “affective psychosis” (ie, mood disorders with psychotic features) was too small to support analyses. Conversion to these diagnoses is rare in CHR (only 11% as of a 2013 meta-analysis),45 and low rate in the present study is most likely a result of sampling error. The current results should be seen as an analysis of the transdiagnostic dimension of internalizing symptoms rather than a traditional test of affective vs. non-affective psychosis.
Retrospective studies of premorbid adjustment in schizophrenia vs schizoaffective disorder have found somewhat inconsistent results, but have tended to find poorer premorbid adjustment in schizophrenia.35,46 One prospective CHR study18 has also found that conversion to schizophrenia (compared to conversion to any other psychotic diagnosis) was associated with more severe social adjustment problems in late adolescence. There has been considerable variation in study designs, sample compositions, definitions of diagnostic groups, and analytical approaches in studies on premorbid adjustment in affective vs non-affective psychotic diagnoses, including in the present study. The available evidence suggests that premorbid adjustment trajectories are heterogeneous, and that the severity of affective symptoms may help to unpack this heterogeneity. Future studies with larger sample sizes of confirmed affective conversion diagnoses would be valuable in this regard.
Clinical Covariates of Adjustment Problems
Attenuated Negative Symptoms
For all participants, more severe attenuated negative symptoms were associated with poorer overall social adjustment throughout the premorbid period (see figure 2a and Supplementary table S4). This main finding replicates prior research linking attenuated negative symptoms to premorbid social adjustment problems in CHR.13,19,37 In addition, weak evidence suggested that converters and non-converters may have differed in the relationship between attenuated negative symptoms and premorbid trajectories of social adjustment. This observed effect fell slightly outside the traditional range of statistical significance (uncorrected P = .051) and did not approach significance after FDR correction (corrected P = .121). Although findings around P = .05 are interpretable in many cases,47,48 evidence regarding this effect is only suggestive, should be interpreted cautiously, and would be a good candidate for targeted replication in independent samples.
For non-converters, this potential effect would suggest that more severe attenuated negative symptoms were associated with worsening social adjustment, while less severe attenuated negative symptoms were associated with improving social adjustment. It would also suggest that this pattern was absent in converters. One possible interpretation might be that, in non-converters, attenuated negative symptoms may be more directly or acutely related to social adjustment; whereas, in converters, attenuated negative symptoms and poor social adjustment may both be outcomes of underlying illness processes. By focusing on persistent negative symptoms,36 the present analyses protected somewhat against confounding from shorter- vs longer-duration negative symptoms19 and item content overlap between attenuated negative symptoms and social functioning.22 However, attenuated negative symptom item content is known to overlap with internalizing symptoms, leaving open the possibility that any potential effects may relate to mood symptoms rather than traditional negative symptoms.20–22
Cognitive Function
Both verbal learning and IQ were associated with persistent difficulties in academic adjustment and increasing difficulties with social adjustment during the premorbid period. Cognition was assessed at baseline, and premorbid cognition was not assessed. Two explanations are therefore plausible. Longstanding cognitive impairment may have caused persistent functional difficulties. Alternatively, persistent premorbid functional problems may have preceded acute cognitive impairment associated with increasing symptoms around the time of the baseline assessment. While links between verbal learning, IQ, and premorbid adjustment have been established in chronic schizophrenia3,27 and first-episode psychosis,5,28 the present study is the first to replicate these links in a CHR sample. Compared to previous research in psychotic disorder samples, the current findings are more proximal to premorbid functioning and less susceptible to retrospective recall biases or the cognitive effects of psychotic episodes or antipsychotic medication.49,50 No findings differed for converters vs non-converters, in line with previous findings that cognition is more closely related to functional outcomes than specific clinical outcomes.51,52 Relationships between cognitive deficits and premorbid adjustment may represent common impairments across converters and non-converters and may therefore be less relevant for risk assessment.
Childhood Trauma
The presence of childhood trauma was associated with poorer social and academic adjustment throughout the premorbid period. The present study reinforces previous findings on the consequences of trauma for youth at CHR12,25,26 and extends this prior work by showing that childhood trauma affects social and academic functioning regardless of conversion status.
The present study also found that the impact of childhood trauma related differently to premorbid academic functioning in converters vs non-converters. Surprisingly, among converters who had experienced childhood trauma, academic adjustment was worst when childhood trauma was reported as least impactful. Trauma severity was operationalized as its subjective impact, so this finding reflects participants’ own subjective understandings about the impact of trauma, which could be influenced by multiple factors including impaired insight, low self-esteem, and global negative self-beliefs.53–55 For instance, low self-esteem and negative self-beliefs have been shown to mediate relationships between childhood adversity and psychotic experiences.56 for a review, see57 Such global negative self-beliefs could lead individuals to discount the effect of childhood trauma and report it as having little impact. This would suggest that participants who subjectively discount the effects of trauma due to impaired insight or global negative self-beliefs may be at elevated risk for psychotic disorders. Future research comparing objective and subjective measures of trauma severity would be valuable to clarify relationships between trauma and adjustment in CHR.
Study Limitations
This study had some important limitations. As premorbid adjustment was assessed retrospectively, it may be subject to low reliability of recall. Growth curve trajectories in retrospective data will to a certain extent conflate historical data with current recall biases and serve as hypothesis generation and supporting evidence for more direct (ie, longitudinal) analysis of trends in adjustment during childhood and adolescence. The small number of observations per participant also prohibited tests of nonlinear effects. Furthermore, although the sample size of converters (n = 53) was large compared to typical CHR studies, it still represented a relatively low rate of conversion (10.6% over 2 years) c.f.9 However, the low transition rate may not reflect characteristics of the current study sample, but rather a broader trend in the literature toward lower transition rates over time.58,59 Finally, although the study sample was recruited across nine sites, all participants were help-seeking individuals recruited through universities or academic medical centers in North American urban areas. The present results may not generalize outside of those parameters, eg, to non-help-seeking individuals or individuals in other countries. Moreover, growth curve models in CHR samples only pertain to individuals who develop psychosis after passing through a CHR state, who have been shown to differ systematically from individuals who develop psychosis without first passing through a CHR state.60 The current results may not generalize to individuals who develop psychosis without passing through a CHR state.
Supplementary Material
Supplementary material is available at https://dbpia.nl.go.kr/schizophreniabulletin/.
Conflict of Interest
The authors have declared that there are no conflicts of interest in relation to the subject of this study.
Funding
This work was supported by the National Institute of Mental Health (grant U01MH081984 to Dr Addington; grant U01MH081928 to Dr Stone; grant U01MH081944 to Dr Cadenhead; grant U01MH081902 to Drs Cannon and Bearden; grant U01MH082004 to Dr Perkins; grant U01MH081988 to Dr Walker; grant U01MH082022 to Dr Woods; grant U01MH076989 to Dr Mathalon; grant UO1MH081857 to Dr Cornblatt).
