


Abstract
Cognitive deficits in schizophrenia are linked to dysfunctions of the dorsolateral prefrontal cortex (DLPFC), including alterations in parvalbumin (PV)-expressing interneurons (PVIs). Redox dysregulation and oxidative stress may represent convergence points in the pathology of schizophrenia, causing dysfunction of GABAergic interneurons and loss of PV. Here, we show that the mitochondrial matrix protein cyclophilin D (CypD), a critical initiator of the mitochondrial permeability transition pore (mPTP) and modulator of the intracellular redox state, is altered in PVIs in schizophrenia.
Western blotting was used to measure CypD protein levels in postmortem DLPFC specimens of schizophrenic patients (n = 27) and matched comparison subjects with no known history of psychiatric or neurological disorders (n = 26). In a subset of this cohort, multilabel immunofluorescent confocal microscopy with unbiased stereological sampling methods were used to quantify (1) numbers of PVI across the cortical mantle (20 unaffected comparison, 14 schizophrenia) and (2) PV and CypD protein levels from PVIs in the cortical layers 2–4 (23 unaffected comparison, 18 schizophrenia).
In schizophrenic patients, the overall number of PVIs in the DLPFC was not significantly altered, but in individual PVIs of layers 2–4 PV protein levels decreased along a superficial-to-deep gradient when compared to unaffected comparison subjects. These laminar-specific PVI alterations were reciprocally linked to significant CypD elevations both in PVIs and total DLPFC gray matter.
Our findings support previously reported PVI anomalies in schizophrenia and suggest that CypD-mediated mPTP formation could be a potential contributor to PVI dysfunction in schizophrenia.
Introduction
Disruptions of cognitive processes are important symptoms in the pathophysiology of schizophrenia which often present prior to the onset of psychosis.1–3 Converging lines of evidence link these disturbances to dysfunctional microcircuits in the dorsolateral prefrontal cortex (DLPFC), where reciprocal connections between pyramidal neurons and parvalbumin (PV)-expressing interneurons (PVIs) are altered.4,5 Abnormalities in PVIs, including a reduced density of immunoreactive neurons as well as lower PV mRNA and protein levels are frequently replicated in human postmortem studies of schizophrenia.6,7 Although the exact cause of these changes is unclear, redox dysregulation and oxidative stress may present a convergence point for pathologies in schizophrenia, causing dysfunction of GABAergic interneurons and loss of PV.8,9 As the primary source of reactive oxygen species (ROS) in neurons, mitochondria are both crucial contributors and amplifiers of oxidative stress in pathological states.10–13 Transcriptomic, proteomic, and metabolomic studies have shown that schizophrenia is associated with changes in mitochondrial genes, proteins, and pathways involved in energy production, ROS formation, and antioxidant defense systems.14–17 Cell type-specific studies have further linked these mitochondrial alterations to deep layer 3 pyramidal neurons and PVIs in the DLPFC.18,19 Fast-spiking PVIs are particularly vulnerable to oxidative stress-driven impairment due to their enriched mitochondrial profile necessary to satisfy their high energy demands.11 Increases in mitochondrial matrix calcium, especially when coupled to additional factors such as oxidative stress, trigger opening of the mitochondrial permeability transition pore (mPTP), a multiprotein complex that forms a large, nonselective channel that plays a critical role in regulating mitochondrial function, cellular homeostasis, and cell death.20,21 The mitochondrial matrix protein Cyclophilin D (CypD) is a mitochondrial peptidyl-prolyl cis-trans isomerase (encoded by the PPIF gene)20 that functions as a key regulator of the formation and opening of the mPTP.22,23 Under conditions of chronic cellular stress, elevated levels of CypD can lead to maladaptive changes in mitochondria, including decreased adenosine triphosphate (ATP) production and increased release of ROS into the cytosol.21,24,25 These alterations contribute to a feed-forward cycle of ROS generation and release, metabolic changes, and eventual loss of cell function.20,23 Despite mitochondria’s importance in redox regulation and extensive evidence for the contribution of oxidative stress to the pathophysiology of schizophrenia,8,9,12,26 the contribution of CypD to these processes remains unclear. We hypothesized that PVI alterations in schizophrenia are associated with increased CypD protein levels. To test this idea, we investigated the relationship between CypD and PVIs in postmortem DLPFC tissue collected from schizophrenic patients and unaffected comparison subjects. Using a combined approach of western blotting, immunohistochemistry, and confocal microscopy with unbiased stereological sampling, we measured CypD expression levels in DLPFC gray matter homogenates, and quantified PV and CypD protein levels in PVIs from cortical layers 2–4. Our findings suggest that schizophrenia is linked to changes in DLPFC mitochondria which may be part of a larger network of pathologic cellular processes tying oxidative stress to alterations in cortical PVIs.
Methods and Materials
Human Subjects
Human brain tissue samples (n = 105) of area 9 and 46 were sourced from the National Institute of Health (NIH) NeuroBioBank (NBB), with contributions from the following biorepositories: Harvard Brain Tissue Resource Center, University of Maryland Brain and Tissue Bank, University of Miami Brain Endowment Bank, Sepulveda Research Corporation, and the Mount Sinai/JJ Peters VA Medical Center. Procedures for written informed consent and collection of tissue were reviewed and approved by each bank’s Institutional Review Board. Samples were obtained as frozen (n = 54), formalin-fixed (n = 43), and formalin-fixed paraffin-embedded (FFPE, n = 8) tissue preparations. Patients with schizophrenia were matched as closely as possible for age, sex, postmortem interval (PMI) to unaffected comparison subjects, and tissue samples from members of a pair/triad were always processed together. Subject groups did not differ in mean age or PMI. Brain specimens were allocated to western blot (n = 53) and immunohistochemistry (n = 41) experiments as outlined in table 1 and supplementary table 1. Some samples were excluded from the final reported analysis due to immunolabelled PV+ somata or protein intensity measurements being more than 4 standard deviations below their group average. See supplementary methods for details. Supplementary table 1 includes detailed information about all subjects, including which subjects were used for paired or triadic comparisons, and which samples were excluded from analysis.
Summary of Human Subject Characteristics
| Western Blotting | Immunofluorescence | |||||||
|---|---|---|---|---|---|---|---|---|
| Comparison Group (N = 26) | Schizophrenia Group (N = 27) | Comparison Group (N = 23) | Schizophrenia Group (N = 18) | |||||
| N | % | N | % | N | % | N | % | |
| Sex | ||||||||
| Male | 20 | 76.9 | 21 | 77.8 | 19 | 82.6 | 14 | 77.8 |
| Female | 6 | 23.1 | 6 | 22.2 | 4 | 17.4 | 4 | 22.2 |
| Tissue preparation | ||||||||
| Frozen | 26 | 100 | 27 | 100 | 0 | 0 | 0 | 0 |
| Formalin-Fixed | 0 | 0 | 0 | 0 | 20 | 87.1 | 14 | 77.8 |
| FFPE | 0 | 0 | 0 | 0 | 3 | 12.9 | 4 | 22.2 |
| Mean | SEM | Mean | SEM | Mean | SEM | Mean | SEM | |
| Age | 50 | 1.6 | 47.9 | 2.0 | 49.7 | 1.8 | 50.5 | 2.0 |
| PMI | 20.5 | 1.2 | 20.4 | 2.1 | 19.8 | 1.1 | 20.6 | 2.3 |
Note: FFPE, formalin-fixed paraffin-embedded; PMI, postmortem interval. Values are mean ± SEM; P > .2 for all comparisons.
Western blotting
Frozen DLPFC tissue samples were processed using antibodies against CypD and glyceraldehyde-3-phosphate dehydrogenase (GAPDH), then visualized with chemiluminescent substrate. CypD band strength was normalized to GAPDH protein intensity. All samples were run at least twice, and values were averaged for statistical analysis. See supplementary methods for details.
Tissue Processing and Immunohistochemistry
FFPE and formalin-fixed DLPFC tissue samples were sectioned rostral-caudally at either 40 µm (formalin-fixed) or 15 µm (FFPE) on a sliding microtome. Because of the difference in thickness, only formalin-fixed sections were used in experiments that compared PVI density across the layers. Three sections per subject were selected for immunohistological staining, with each section separated by ~400 µm to ensure a representative sampling of the regions of interest. Tissue from subject pairs/triads were processed together using antibodies against PV, CypD, and counterstained with Neuronal Nuclear marker protein (NeuN) or 4ʹ,6-diamidino-2-phenylindole (DAPI). See supplementary methods for details.
Microscopy
Data were collected on an Olympus IX83 motorized inverted microscope equipped with a FV3000RS confocal laser scanning module, ultrasonic automated stage, using 1.25× (numerical aperture, N.A. 0.04), 20× (N.A. 0.75), and 100× (N.A. 1.35) air or oil immersion objectives. Z-stacked images were collected at low magnification (20× air objective, 1024 × 1024 frame size, 30 µm thickness, 2 µm step size) and high magnification (100× silicone objective, 1024 × 1024 frame size, 0.25 µm step size) using FV3000 Fluoview Acquisition and Analysis software. Exposure times during image capture were optimized to prevent saturated conditions for each channel within each image stack and differences in exposure times were corrected before processing.
Stereological Methods and Image Capture
To map cellular and subcellular changes, we integrated a stratified stereologic sampling scheme informed by a previously published protocol27 which provided a systematic, unbiased approach to (1) chart the distribution of PVIs across cortical layers and to (2) randomly select individual PVIs in layers 2–4 for fluorescence intensity measurements of PV and CypD. See supplementary methods for details.
Image Processing and Analysis
Images were imported into Imaris (Oxford Instruments, version 9.0.2) and pixels from z-stacks were converted into 3D voxels. Images were then subjected to intensity histograms for each channel and independently adjusted to identical settings across all subjects allowing PV+ and CypD+ cells to be masked under identical conditions. The surface and spot detection functions were used to count PVI across all six layers of the neocortex. For each subject, the number of PVI was then averaged for each layer within each coronal section. For individual PVIs, a region of interest was traced across the depth of the z-plane and the surface wizard was used to mask individual channels. Mean fluorescence intensity measurements were then recorded for PV and CypD and values were averaged for each subject.
Statistics
Four analysis of covariance (ANCOVA) models were used to compare the dependent variables between schizophrenia and unaffected comparison subject groups. Age, sex, PMI, tissue preparation, fixation duration, and the hemisphere used in each respective study were included as covariates. The assessment of comorbid factors from all ANCOVA models are presented in supplementary table 2. In western blot experiments, a one-way between-subjects ANCOVA was used to evaluate CypD protein levels in the DLPFC. For immunohistochemistry experiments, three mixed-factor ANCOVA models were used to evaluate PVI density across the cortical mantle, or PV and CypD levels from individual neurons, respectively. Clinical diagnosis was used as the between-subjects factor with repeated measures on comparisons of cortical layers. If Mauchly’s test indicated that the assumption of sphericity had been violated (P < .05), then degrees of freedom were corrected using either Greenhouse-Geisser (ε < 0.75) or Huynh-Feldt (ε > 0.75) estimates of sphericity. Diagnosis and diagnosis-by-layer effects were tested using F tests, followed by Bonferroni-adjusted P values in each layer. Effect size, denoted by partial eta squared (ηp2), was quantified to determine the proportion of variance in the dependent variable that can be explained by the between-subjects independent variable. Groupwise Pearson correlation analyses were performed to examine the linear relationship between PV and CypD in each cortical layer. All data are presented as mean ± standard error of the mean (SEM). Given the unique clinical profile of schizophrenia, which often includes a history of pharmacotherapy and other comorbid conditions that could potentially impact levels of our dependent variables, we assessed the influence of each comorbid factor—history of substance abuse, use of benzodiazepines, antiepileptics, and antidepressants—within the schizophrenia cohort. For each factor, we implemented ANCOVA models with the comorbid factor of interest as the main effect, controlling for age, sex, PMI, fixation duration, and hemisphere used in each study as covariates. The results of these analyses are presented in supplementary table 3.
Results
CypD Expression Levels Are Elevated in the DLPFC for Patients With Schizophrenia as Measured by Western Blot
We used frozen tissue samples from 53 subjects (26 unaffected comparison, 27 schizophrenia) to measure CypD protein expression levels in the DLPFC using western blot (figure 1). Expression levels were normalized to the housekeeping protein GAPDH to account for potential differences in protein loading. Mean values for GAPDH did not significantly differ (F1,48 = 1.050, P = .311, ηp2 = 0.021) between tissue from unaffected comparison subjects (1.11E + 7 ± 7.91E + 6) and patients with schizophrenia (9.27E + 6 ± 6.10E + 6; figure 1). There was a significant main effect of diagnosis on GAPDH-normalized CypD expression levels (F1,47 = 10.390, P = .002, ηp2 = 0.181), with a 34.9% increase in the CypD/GAPDH ratio for schizophrenia patients (0.873, ±0.065) compared to unaffected comparison subjects (0.569, ±0.66; figure 1). Subsequent examination of comorbid factors within the schizophrenia cohort revealed these elevations in CypD protein levels were not significantly influenced by medication status at time of death or other assessed comorbidities (see supplementary table 3). Taken together, these results provide evidence for an altered mitochondrial redox state in the DLPFC of patients with schizophrenia.
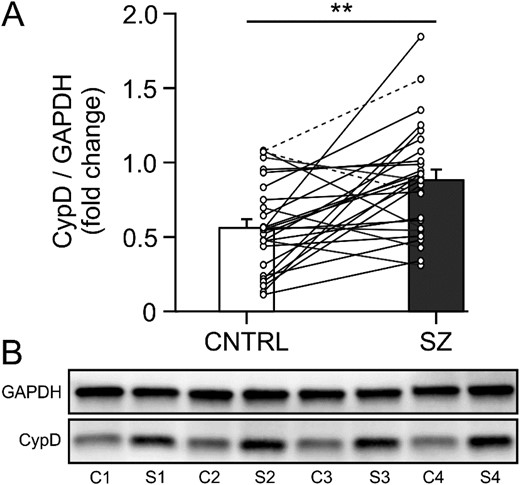
CypD protein levels are elevated in the DLPFC of patients with schizophrenia. (A) Hybrid bar graph and scatter plot showing that in 21/26 matched pairs (including one triad, indicated by dashed connector lines) patients with schizophrenia (SZ) showed significantly higher GAPDH-normalized CypD protein levels than unaffected comparison subjects (CNTRL). Error bars = SEM, P < .01. (B) Lanes from a representative western blot loaded with tissue from 4 matched comparison (C1-4) and schizophrenia (S1-4) subject pairs. CypD, cyclophilin D; DLPFC, dorsolateral prefrontal cortex; GAPDH, glyceraldehyde-3-phosphate dehydrogenase.
The Density of PVIs in the DLPFC Does Not Differ Between Schizophrenic and Matched Comparison Subjects
To determine if cortex-wide increases in CypD are associated with PVI abnormalities in patients with schizophrenia, we mapped the distribution of immunoreactive PV+ somata across all six layers of the DLPFC in 34 matched subjects (20 unaffected comparison, 14 schizophrenia) and quantified the PVI density in each cortical layer. There was a significant main effect for the cortical layer variable on the number of PVI somata (F1.925,51.978 = 8.149, P = .001, ηp2 = 0.232), indicating that the density of PVIs significantly varied across cortical layers (figure 2). In both schizophrenia and matched comparison subject groups, the distribution of PVIs across the cortical layers were as follows: ~ 9% in layer 2, 38% in layer 3, 31% in layer 4, 16% in layer 5, and 5% in layer 6. We detected little to no PV labeling in cortical layer 1 (figure 2). This distribution pattern is consistent with previous reports about the laminar distribution of PVIs in human and monkey PFC.28,29 We did not find a significant main effect of diagnosis on the PVI density (F1,27 = 3.054, P = .092, ηp2 = 0.102), nor was there a significant interaction between cortical layer and diagnosis (F1.925,51.978 = 2.387, P = .134, ηp2 = 0.081), indicating that on average PVI density did not significantly differ between patients with schizophrenia and unaffected comparison subjects (figure 2).
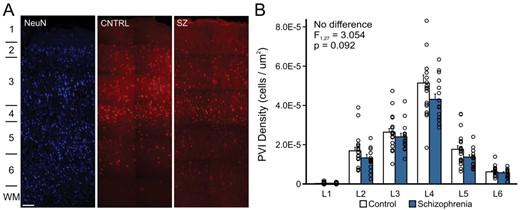
The density of cortical PVIs is not altered in schizophrenia. (A) Representative images (using a × 20 objective) showing the laminar organization of the NeuN (left) and PVI in unaffected comparison subjects (middle, CNTRL) and patients with schizophrenia (right, SZ). The location of cortical layers is indicated on the left. Scale bar = 200 um. (B) Bar graph showing the distribution of PVIs per square micron in each cortical layer for unaffected comparison subjects (open bars) and patients with schizophrenia (solid bars). Error bars = SEM. PVI, parvalbumin interneuron; NeuN; neuronal marker.
PVI From Patients With Schizophrenia Show a Decreasing Gradient of PV Expression Across Layers 2–4 That Is Inversely Correlated With an Increasing Gradient of CypD Expression
We used tissue from the same 34 subjects as in Experiment 3.2, plus an additional 7 FFPE samples (3 unaffected comparison; 4 schizophrenia) to quantify expression of PV and CypD at the soma of 1266 randomly sampled PVIs (690 unaffected comparison, 576 schizophrenia, ~30 PVI per subject) from layers 2 to 4 (figure 3). First, we computed Pearson correlation coefficients between PV and CypD levels across all neurons in layers 2–4 (figure 3A–C, D–F). In unaffected comparison subjects, we found significant negative correlations between higher PV and lower CypD levels in PVIs from layer 2 (r113 = −0.228, P = .014, figure 3A and D), layer 3 (r343 = −3.88, P < .001, figure 3B and E), and layer 4 (r228 = −0.319, P < .001, figure 3C and F). In patients with schizophrenia, we found significant negative correlations in the opposite direction, with lower PV and higher CypD levels in PVIs from layer 2 (r93 = −0.303, P = .003, figure 3A and D), layer 3 (r283 = −0.314, P < .001, figure 3B and E), and layer 4 (r194 = −0.387, P < .001, figure 3C, F). In a second analysis, we ran ANCOVA models to compare mean PV and CypD levels in PVIs across layers 2–4 (figure 3A–C, G–I). This method of data analysis attempts to balance diagnostic groups while controlling for the potential influence of covariates and the parallel processing of tissue samples.30–33 In the first ANCOVA our results revealed a significant main effect of diagnosis on somatic PV intensity (F1,36 = 103.637, P < .001, ηp2 = 0.742). PMI (F1,33 = 10.180, P = .003, ηp2 = 0.236) was a significant covariate, consistent with prior postmortem studies of schizophrenia that measured PV protein levels.31,32 Although there was no main effect of cortical layer on somatic PV expression (F2,66 = 1.844, P = .160, ηp2 = 0.054), there was a significant interaction between diagnosis and cortical layer (F2,66 = 7.054, P < .01, ηp2 = 0.176). Post hoc analyses using Bonferroni corrections showed that in patients with schizophrenia PV levels were significantly decreased in PVI from layer 2 (−19.10%, F1,33 = 30.572, P < .001, ηp2 = 0.481, figure 3A and G), layer 3 (−14.44%, F1,33 = 28.918, P < .001, ηp2 = 0.462, figure 3B and H), and layer 4 (−26.27%, F1,33 = 97.129, P < .001, ηp2 = 0.746, figure 3C and I). Follow-up examination of comorbid factors among patients with schizophrenia revealed that mean PV levels in PVI of layers 2–4 were not significantly influenced by medication status at time of death or other assessed comorbidities (see supplementary table 3). In the second ANCOVA, our results revealed a significant main effect of diagnosis on CypD intensity (F1,33 = 62.186, P < .001, ηp2 = 0.653). Although there was no main effect of cortical layer on somatic CypD expression (F1.840,60.709 = 1.405, P > .253, ηp2 = 0.041), there was a significant interaction between diagnosis and cortical layer (F1.840,69.709 = 5.546, P < .01, ηp2 = 0.144). Post hoc analyses showed that in tissue from patients with schizophrenia CypD protein levels in the somata of PVI were significantly increased in layer 2 (+10.09%, F1,33 = 19.692, P < .001, ηp2 = 0.374, figure 3A and G), layer 3 (+12.38%, F1,33 = 38.988, P < .001, ηp2 = 0.542, figure 3B and H), and layer 4 (+19.66%, F1,33 = 51.381, P < .001, ηp2 = 0.746, figure 3C and I). Subsequent examination of comorbid factors revealed that CypD levels in layer 3 PVI differed among patients with schizophrenia as a function of antiepileptic use at the time of death (F1,7 = 13.080, P = .009), with those on medication exhibiting lower CypD levels (2843.94 ± 112.88) than those not on medication (2976.69 ± 240.44, see supplementary table 3). Taken together our data indicate that PVIs in tissue from patients with schizophrenia show laminar-specific reductions in PV that are inversely correlated with rising CypD protein levels.
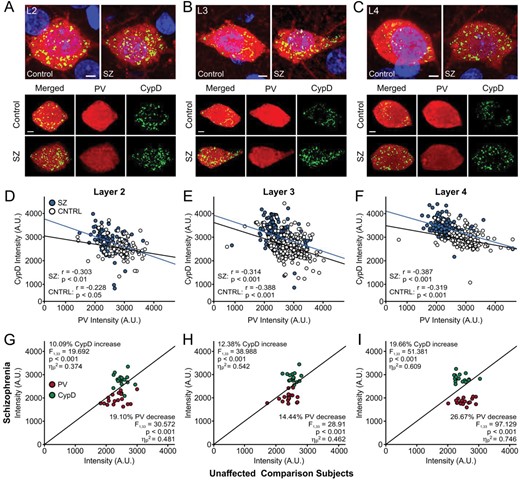
Reductions in PV levels correlate with increased levels of CypD at the somata of PVIs in layers 2–4 of patients with schizophrenia. (A–C) Representative images of DLPFC neurons immunolabelled for PV (red) and CypD (green), counterstained with DAPI (blue), in layers II (L2; A), III (L3; B), and IV (L4; C). (D–F) Groupwise Pearson correlation analyses between PV and CypD in individual cells from L2 (D), L3 (E), and L4 (F) from unaffected comparison subjects (white dots, black line) and patients with schizophrenia (blue dots, blue line). (G–I) Unity plots showing the association between PV (red) and CypD (green) expression in PVI from L2 (G), L3 (H) and L4 (I). Each data point reflects comparisons within a pair or triad consisting of a patient with schizophrenia and their matched unaffected comparison subjects (13 pairs + 5 triads total). Data points below the unity line indicate lower PV values in the schizophrenia patient compared to their matched comparison subject, while points above the line indicate higher CypD values in the schizophrenia patient. In schizophrenic patients, there was a superficial-deep laminar gradient of declining PV levels in layers 2–4, which was accompanied by a corresponding gradient of increased CypD levels in the same neurons. PV, parvalbumin; CypD, cyclophilin D; PVI, parvalbumin interneuron; DLPFC, dorsolateral prefrontal cortex; DAPI, 4ʹ,6-diamidino-2-phenylindole.
Discussion
We investigated the relationship between the expression of the mitochondrial matrix protein CypD and alterations in PVIs in postmortem tissue of the DLPFC from schizophrenic and unaffected comparison subjects. In the DLPFC of patients with schizophrenia, we observed elevated CypD levels in gray matter homogenates. These changes were accompanied by reduced PV expression in PVIs along a superficial-to-deep gradient in layers 2–4, as well as inversely related elevations in CypD levels in the same neurons, without significant alterations in the total number of PV+ cells.
Our findings are consistent with a large body of literature that points to alterations in cortical PVIs as a hallmark in the pathology of schizophrenia.6,7,34,35 While several previous studies reported reduced numbers of PVIs in the prefrontal cortex,36–39 and other brain regions, including the hippocampus,40 entorhinal cortex,41 and thalamus,42,43 more recent studies suggest that the numbers of PVIs in the DLPFC remain unchanged in schizophrenia; instead, alterations occur at the level of gene expression and protein synthesis, which can contribute to lower PV expression and cause cells to fall below a detection threshold.5,32–34,44–46 Our immunohistochemical analyses are consistent with this interpretation and also indicate an important role for mitochondrial dysfunction in the alterations in PVI in schizophrenia (figure 4).
![Summary of findings and illustration of proposed mechanisms through which CypD and PV may interact to cause alterations in PVI and cognitive dysfunction in schizophrenia. (A) The density of PVIs in the DLPFC is not altered in schizophrenia, but PVIs in layers 2–4 exhibit a superficial-to-deep decline in PV protein levels which are reciprocally linked to elevations in CypD. (B) Oxidative and other cellular stressors (including increased levels of cytosolic calcium, [Ca]cyt) promote the translocation of CypD to the inner mitochondrial membrane and facilitate opening of the mPTP. CypD-mediated mPTP opening increases production of ROS and decreases ATP synthesis, causing disruptions in cellular energy metabolism, calcium homeostasis, and antioxidant defense mechanisms. These changes can directly or indirectly affect PV expression and function, further affecting a cell’s ability to buffer cytosolic calcium. (C) Deficits in cortical PVIs may affect the synchrony of gamma oscillations that support cognitive functions which are predictors for the functional outcomes in patients with schizophrenia. CypD, cyclophilin D; PV, parvalbumin; PVI, parvalbumin interneuron; DLPFC, dorsolateral prefrontal cortex; mPTP, mitochondrial permeability transition pore; ROS, reactive oxygen species, ATP, adenosine triphosphate.](https://oup.silverchair-cdn.com/oup/backfile/Content_public/Journal/schizophreniabulletin/50/5/10.1093_schbul_sbae016/1/m_sbae016_fig4.jpeg?Expires=1750187387&Signature=IbrEYN19HBKBScaBOj0D36rPCZjGX4AOkRZ0~wVsQR3mHSlbrsvGG24VVII8xTrHg2ACNn-NK6A~KlxIYcMQWhSleFAqrqoojMhdfU1eHvsYaosmEKaoAP5lfIYeghJtU-5EosvR8sJO~Sf~sDLS048qMNZWZkPgZJCb-HovXiSPvH6lVTb7KhcdBtfpnCIcdapmreyUPe9Twm47dHVii6IGo~vxujeM-MkQiteXhtiDXZIhbl~E0VB6YPu5yA6QMhdyY4M5PhyjJIFktfWKX8-OUSF2gNrc4ZJdUdef8FMcTGCSKbQxfDPfjNJ6pdGJZrHFmv2oEXWHLV5gZ~3oOg__&Key-Pair-Id=APKAIE5G5CRDK6RD3PGA)
Summary of findings and illustration of proposed mechanisms through which CypD and PV may interact to cause alterations in PVI and cognitive dysfunction in schizophrenia. (A) The density of PVIs in the DLPFC is not altered in schizophrenia, but PVIs in layers 2–4 exhibit a superficial-to-deep decline in PV protein levels which are reciprocally linked to elevations in CypD. (B) Oxidative and other cellular stressors (including increased levels of cytosolic calcium, [Ca]cyt) promote the translocation of CypD to the inner mitochondrial membrane and facilitate opening of the mPTP. CypD-mediated mPTP opening increases production of ROS and decreases ATP synthesis, causing disruptions in cellular energy metabolism, calcium homeostasis, and antioxidant defense mechanisms. These changes can directly or indirectly affect PV expression and function, further affecting a cell’s ability to buffer cytosolic calcium. (C) Deficits in cortical PVIs may affect the synchrony of gamma oscillations that support cognitive functions which are predictors for the functional outcomes in patients with schizophrenia. CypD, cyclophilin D; PV, parvalbumin; PVI, parvalbumin interneuron; DLPFC, dorsolateral prefrontal cortex; mPTP, mitochondrial permeability transition pore; ROS, reactive oxygen species, ATP, adenosine triphosphate.
Multiple lines of evidence indicate that oxidative stress and redox dysregulation may be critical factors in schizophrenia’s pathophysiology across all phases of the illness.17–19,47–53 Mitochondrial perturbations that negatively impact energy metabolism, redox regulation, antioxidant defense, calcium buffering, and synaptic transmission are present at the levels of genes, mRNA, and proteins.18,19,47,54–61 Furthermore, a transcriptomic study of layer 3 PVIs in the DLPFC of patients with schizophrenia and unaffected comparison subjects indicates that >85% of differentially expressed mitochondrial pathway genes are related to reduced ATP generation and elevated ROS formation.19 Our findings of increased CypD levels in the DLPFC and within PVIs across layers 2–4 further support the idea that mitochondrial dysfunction and oxidative stress contribute to the etiology of schizophrenia.
High levels of matrix calcium, CypD, and oxidative stress activate the mPTP (figure 4B,22,24,62,63). Transient openings (“flickering”) of the mPTP serve physiological processes, regulating mitochondrial calcium efflux, ROS signaling, and cell metabolism.22,64 In contrast, sustained mPTP opening causes elevated mitochondrial ROS generation and release, disrupting mitochondrial energy metabolism (figure 4B,24,25,65,66). Sustained mPTP opening also collapses the mitochondrial membrane potential, dissipating the proton gradient across the inner mitochondrial membrane that is essential for ATP synthesis.20,67,68 In addition, CypD can reduce ATP production through direct binding to the ATP synthase.20,23 Therefore, changes in CypD may provide a molecular link between decreased ATP production and increased ROS formation observed in schizophrenia.
A previous study in rats has shown that CypD is expressed predominantly in mitochondria of GABAergic interneurons.69 Among neurons PVIs are particularly susceptible to external stressors due to their metabolic profile, characterized by a large number of mitochondria and enriched cytochrome-c oxidase.8,9,70 PV regulates intracellular calcium concentrations, aiding fast-spiking action potentials and regulating short-term synaptic plasticity in PVI.71–73 PV also has antioxidant functions itself74 and thus reduced levels of PV may signal oxidative stress in PVI. Elevated ROS and decreased ATP production disrupt cellular energy metabolism, calcium homeostasis, and antioxidant defense mechanisms, which in turn could directly or indirectly affect PV expression and function, leading to impaired inhibitory neurotransmission and neuronal synchrony.75–77 Our observation of an inverse relationship between CypD and PV in patients with schizophrenia are consistent with the idea that mitochondrial dysfunction and oxidative stress contribute to reduced PV expression.
However, our findings are seemingly at odds with a recent study that used single-nucleus RNA sequencing (snRNA-seq) to compare transcriptomic changes in different types of neurons in the DLPFC of patients with schizophrenia.78 Consistent with our results the authors found pronounced changes in upper-layer GABAergic interneurons. However, among these changes was a downregulation of PPIF, the gene that codes for CypD, in PVI, which was associated with several key biological processes critical for mitochondrial function. The reason for these discrepancies as well as their functional implications (eg, whether and how reduced transcription of PPIF can contribute to mitochondrial dysfunction in schizophrenia) are unclear, but they might reflect methodological differences between scRNAseq, which captures changes at the mRNA level, and the immunohistochemical and western blotting techniques used here, which capture changes at the protein level. CypD can undergo several post-translational modifications, including oxidation, phosphorylation, or acetylation, which affect its catalytic activity and ability to regulate the mPTP.23,79
It is also important to note that our findings are only correlational and that the directionality of these changes is not evident; thus, reductions in PV could also lead to increased CypD levels as PV and mitochondria share cellular functions as cytosolic calcium buffers, impact intracellular calcium transients in similar ways, and jointly maintain calcium homeostasis,80 but are regulated in an antagonistic way, so that an increase in one results in a decrease in the other.73 Global PV knock-down in mice results in a maladaptive increase in mitochondrial volume, likely compensating for the lost calcium buffering capacity of PV, which subsequently contributes to higher oxidative stress levels.81 Thus, a reduction of PV in schizophrenia could trigger a compensatory mitochondrial response to maintain cellular homeostasis (figure 4B).
In the DLPFC, neurons in layers 2–3 generate gamma oscillations that support cognitive functions like working memory.82,83 Working memory deficits in patients with schizophrenia have been linked to diminished gamma power and altered GABA signaling in the DLPFC.84–86 Converging lines of evidence indicate that prefrontal gamma oscillations depend upon the reciprocal synaptic activity between deep layer 3 PVIs and pyramidal neurons,4,5,30,87–90 which also show pathological alterations in schizophrenia.87,91 In fact, transcriptome analyses suggest that mitochondrial impairments might be even more pronounced in pyramidal neurons than PVIs,18,19 and thus deficits in pyramidal neurons may represent the primary event, followed by compensatory adaptations in PVIs that aim to reduce levels of inhibition. Ultimately, neither mitochondrial deficits nor changes in PV may constitute the primary insult, but rather may be a consequence of reduced neuronal demand for energy production due to upstream pathological processes. This notion is supported by postmortem findings that layer 3 pyramidal neurons in the DLPFC have fewer dendritic spines and layer 4 PVIs receive less excitatory input, which suggests a primary pathological locus of impaired synaptic processing.30,91–94
There are several methodological considerations that impact the interpretation of our results. A common concern for human postmortem studies is the variability in tissue quality due to perimortem factors such as hypoxia and ischemia, and postmortem factors such as PMI, cause of death, and the conditions under which the tissue was stored and processed.91,95 We excluded 10 out of 51 samples (4 unaffected comparison, 6 schizophrenia) because little or no PV signal was detectable in multiple repeats of immunohistochemistry stainings, likely reflecting unspecific factors that affected tissue quality (rather than true differences between diagnostic groups, see supplementary table 1). Another limitation of our study is the inability to experimentally control for the potential confounding effects of long-term medication usage common in the treatment of schizophrenia, including antipsychotics which are known to cause oxidative stress.96,97 However, previous studies that examined the effects of antipsychotic drugs on PV transcripts in human patients,32 as well as over 600 mitochondrial genes in monkeys,98 found few differences in gene expression, suggesting that antipsychotics are unlikely to substantially alter DLPFC functioning through mitochondrial changes. We obtained comprehensive medication histories for most patients in our schizophrenia cohort (14/18 in IHC study and 23/27 in western blot study), detailing histories of substance abuse, and use of benzodiazepines, antiepileptics, and antidepressants at time of death. Patients who received antiepileptic treatment exhibited significantly lower CypD levels in layer 3 PVIs (supplementary table 3), suggesting that some medication may modulate, and in this case even reduce, CypD expression. Nevertheless, the overall increase in CypD observed in patients with schizophrenia (figure 3B and H) appears to be a consistent feature of the disorder, beyond the influence of medication or other confounds commonly associated with the illness. Lastly, our tissue samples for western blot analyses contained both BA9 and BA46 subregions of the DLPFC, while IHC experiments focused only on BA9, thus it is possible that we did not capture regional differences within the DLPFC.
In summary, our findings of altered PV and CypD protein levels in the DLPFC suggest that these factors may contribute to redox dysregulation and oxidative stress in cortical PVIs, causing impaired information processing in DLPFC microcircuits in schizophrenia.
Supplementary Material
Supplementary material is available at https://dbpia.nl.go.kr/schizophreniabulletin/.
Funding
This work was supported by grants 1R01 AA028861-01A1 (from NIAAA, NIH) and 1R01 DA055008-01 (from NIDA, NIH) to S.K. Human tissue was obtained from the NIH NBB and the Human Brain Collection Core, Intramural Research Program, NIMH (request #1517).
