


Abstract
Disturbed sleep is a common feature of psychotic disorders that is also present in the clinical high risk (CHR) state. Evidence suggests a potential role of sleep disturbance in symptom progression, yet the interrelationship between sleep and CHR symptoms remains to be determined. To address this knowledge gap, we examined the association between disturbed sleep and CHR symptoms over time.
Data were obtained from the North American Prodrome Longitudinal Study (NAPLS)-3 consortium, including 688 CHR individuals and 94 controls (mean age 18.25, 46% female) for whom sleep was tracked prospectively for 8 months. We used Cox regression analyses to investigate whether sleep disturbances predicted conversion to psychosis up to >2 years later. With regressions and cross-lagged panel models, we analyzed longitudinal and bidirectional associations between sleep (the Pittsburgh Sleep Quality Index in conjunction with additional sleep items) and CHR symptoms. We also investigated the independent contribution of individual sleep characteristics on CHR symptom domains separately and explored whether cognitive impairments, stress, depression, and psychotropic medication affected the associations.
Disturbed sleep at baseline did not predict conversion to psychosis. However, sleep disturbance was strongly correlated with heightened CHR symptoms over time. Depression accounted for half of the association between sleep and symptoms. Importantly, sleep was a significant predictor of CHR symptoms but not vice versa, although bidirectional effect sizes were similar.
The critical role of sleep disturbance in CHR symptom changes suggests that sleep may be a promising intervention target to moderate outcome in the CHR state.
Introduction
Disturbed sleep is increasingly investigated as one of the most promising modifiable risk markers for psychotic disorders.1 It is a widely reported symptom2 that already tends to manifest in individuals at clinical high risk (CHR).1,3–6 Clinician- and self-described sleep reports in CHR studies are congruent with data derived from objective measures such as polysomnography,4 actigraphy,7 magnetic resonance imaging1 and sleep electroencephalograms,8 emphasizing disturbed sleep not only as a prominent phenotype of psychotic illness, but as a potentially important biomarker. Yet, in the existing literature exploring sleep disturbance prior to overt psychosis onset, several important issues have remained unaddressed.
First, while abnormal sleep patterns are known to manifest prior to conversion to psychosis,3,9,10 there is a paucity of evidence regarding the extent to which disturbed sleep independently contributes to conversion risk. Overall, studies have shown that psychosis-risk groups experience a considerable amount of sleep disturbance4–6; however, the two notable attempts to use CHR sleep patterns to predict conversion were limited by the cross-sectional nature of their sleep data and did not find a relationship.9,11
Second, although it has been suggested that disturbed sleep is associated with CHR symptoms,1,9,11–13 the few studies that have explored the specificity of subclinical psychotic symptoms most altered by sleep have been inconsistent. For example, in CHR youth,7 certain actigraphic measures of sleep were associated with positive symptoms but none were associated with negative symptoms, and in another study, the Structured Interview for Psychosis-risk Syndromes (SIPS)14 sleep disturbance score was associated with the discrete positive attenuated symptoms suspiciousness/persecutory ideas, perceptual abnormalities/hallucinations, and disorganized communication.9 However, in a third CHR study, several sleep variables assessed by the Pittsburgh Sleep Quality Index (PSQI)15 were associated with more severe negative symptoms and none with positive symptoms.1 As such, investigations have been discrepant and it is unclear whether the observed associations remain stable over time. Expanding upon studies that assessed sleep cross-sectionally,1,9,11,12,16 here we examine associations between sleep and CHR symptoms at multiple time points in at-risk cases and controls, a design used in only few prior studies.13,17,18
Third, it has not yet been established which sleep characteristics are most implicated in CHR symptomatology. In contrast to the studies that used non-specific sleep disturbance severity scales,9,11 the few studies that have examined the individual components of disturbed sleep in relation to CHR symptom changes revealed more specific relationships.12,13,19 For example, polysomnography-measured sleep in CHR individuals showed longer sleep latency and REM-onset latency relative to controls.4 In another study,1 decreased bilateral thalamus volume was found in CHR youth when compared to controls, which was associated with greater latency, reduced efficiency, decreased quality, and increased overall sleep dysfunction score on the PSQI. The multidimensional nature of sleep may in part explain the variety of sleep risk factors described in the literature. Still, replication in large samples is required to identify the sleep characteristics most strongly related to clinical symptomatology.
Fourth, it is unclear whether sleep affects symptom severity directly, or whether the association is influenced by factors such as cognitive deficits, stress, depression, and use of psychotropic medication—all of which have been associated with sleep disruption20–22 as well as with prodromal symptomatology.9,23,24 Cognitive deficits, a key aspect of psychotic disorders,25 are already evident in the prodromal period23 and can be exacerbated by sleep difficulties.23 Stress, which tends to be higher in individuals at CHR compared to controls,24 negatively impacts sleep quality, while restricted sleep can provoke stress as shown by activity of neuroendocrine stress systems.26 Depression, prevalent in CHR and in early phases of psychosis,27 is also closely linked to sleep disturbances such that both insomnia and hypersomnia are common symptoms as well as diagnostic criteria of the disorder.22 Some psychotropic medications may cause sedation or stimulation and thus will also be explored.28
Finally, to ascertain the feasibility of investigating sleep as a target for symptom amelioration, it is critical to determine the direction of the association between sleep and CHR symptoms. Some promising evidence includes bidirectional relationships between poor sleep and paranoia (ie, each predicting the other) and poor sleep more strongly predicting hallucinations than the other way around in samples with non-affective psychotic disorders29 and high psychosis proneness.13 Certain actigraphy-measured circadian disturbances have predicted greater positive symptoms at one-year follow-up in CHR youth,16 and in a general population study, 24 h of sleep deprivation induced psychotic-like experiences and showed a modest association with impaired oculomotor task performance common in schizophrenia.30
The current analysis expands upon existing work as the first to examine longitudinal bidirectional relationships between discrete sleep characteristics, CHR symptoms, and conversion status in a large sample of CHR participants and non-clinical controls. Data were leveraged from the North American Prodrome Longitudinal Study (NAPLS)-3,31 in which participants were prospectively tracked for two years. Specifically, we assessed: (i) whether baseline sleep patterns predict conversion to psychosis; (ii) group differences between converters, CHR non-converters, and controls in the associations between sleep trends and CHR symptoms; (iii) specificity of the individual CHR symptom domains affected by sleep disturbance; (iv) which particular sleep items are most implicated in CHR symptom changes; (v) cognitive impairment, daily life stressors, depression, and psychotropic medication as potential attenuating factors in the association between sleep and CHR symptoms, and (vi) the directionality of associations over time.
Methods
Study Sample
Data were collected from NAPLS-3, a consortium of nine research programs across North America focusing on youth at CHR for psychosis. All participants were recruited between February 2015 and November 2018 through extensive referral networks at each participating site (eg, health care providers, educators, mailings, and postings). As such, clinical participants were help-seeking. Controls did not meet criteria for serious mental illness diagnosis.32 NAPLS-3 conducted clinical assessments over the course of two years; sleep and symptom data were collected at 2-month intervals between baseline and 8 months. For more information about methods and study protocol, please see supplementary text and.31
The total sample included 782 individuals with sleep data at any time point between baseline and 8 months, aged 12–30 years (mean = 18.25, SD = 4.08) (supplementary table 1). 688 (88%) were classified as clinical-high risk (CHR) and 94 (12%) were non-clinical controls. Of the CHR group, 67 (10%) were confirmed to have transitioned to psychosis at some point post-baseline (converters), 411 (60%) did not convert for at least 1 year post-baseline (CHR-NC), and 210 (31%) had unknown clinical status ≥1 year post-baseline. With the exception of the cross-lagged model in which conversion is not considered, CHR participants with unknown clinical status ≥1 year post-baseline were excluded from analyses to reduce the possibility of incorrectly classifying CHR individuals as non-converters. This resulted in an analysis sample of 572 individuals (mean = 18.41, SD = 4.11), including 478 (84%) CHR participants (67 (14%) converters and 411 (86%) CHR-NC), and 94 (16%) controls (table 2). Median time to conversion = 26 weeks, interquartile range = 34 weeks.
Measures
Sociodemographic Characteristics.
Sex, age, race, student status, and years of education were obtained. In addition, the Alcohol and Drug Use Scale (AUS/DUS)33 was used to measure frequency of current alcohol and marijuana use.
Clinical Symptomatology.
CHR symptoms were measured on the Scale of Psychosis-risk Symptoms (SOPS), which is a component of SIPS.14 The SOPS assesses sub-clinical psychotic symptoms across four domains: Positive, Negative, Disorganized, and General. Each domain is a composite of four to six items scored individually on a 0–6 severity scale, with higher scores representing more severe symptom levels. We used SOPS assessments conducted at baseline, 2, 4, 6, and 8 months post-baseline. To avoid confounding with the sleep outcome measure, the General symptom item “G1. Sleep Disturbance” was omitted from analyses.
Conversion to psychosis was determined by the presence of at least one positive symptom of high intensity that occurred consistently for a month or was severely disorganizing or dangerous. (See Cannon et al. for a comprehensive description34).
The Global Functioning Social (GFS) and Role (GFR) scales35 were used to assess overall Social and Role functioning, namely quality of peer relationships and adequacy in performing expected functions and responsibilities.
Sleep Disturbance.
Total sleep score is a self-report based primarily on the Pittsburgh Sleep Quality Index (PSQI),15 which consists of the following components, scored 0–3: “sleep duration” (typical duration of sleep per night), “sleep disturbance” (events contributing to sleep trouble, eg, bad dreams and bathroom needs), “sleep latency” (the time it takes to fall asleep), “daytime dysfunction due to sleepiness” (ability to stay awake with enough enthusiasm to achieve tasks), “habitual sleep efficiency” (the ratio of time asleep to time in bed), “subjective sleep quality” (subjective rating of overall sleep quality), and “use of sleep medication” (frequency of use). The PSQI global score is the sum of these 7 component scores. A global score of >5 indicates poor sleep quality. Additional sleep items included in the total sleep score were “napping frequency” (range 0–3) which was created by the NAPLS team, “sleep regularity” (going to bed/waking up around the same times every day) and “sleep timing” (being asleep or trying to sleep between 2 and 4 a.m.) from the RU-SATED questionnaire,36 scored 0–2. The remainder of the RU-SATED was omitted due to overlap with the PSQI. Total sleep score was thus the sum of the 7 PSQI component scores and the additional items “napping frequency,” “sleep regularity,” and “sleep timing.”
Potential Attenuating Factors
(table 1). Psychotropic medication (atypical antipsychotics, conventional antipsychotics, antidepressants, mood stabilizers, psychostimulants, benzodiazepine anxiolytics or hypnotics, and non-benzodiazepine anxiolytics), cognitive deficits, ie, attention (Auditory Continuous Performance Tasks [A-CPT]37), processing speed (Brief Assessment of Cognition in Schizophrenia [BACS] symbol coding38), and verbal learning/memory (Hopkins Verbal Learning Test [HVLT]39), stress (Daily Stress Inventory [DSI]40), and depression symptoms (Calgary Depression Scale for Schizophrenia [CDSS]41) were adjusted for independently.
Potential Attenuating Factors Explained
| Domain | Variable | Measure | Notes |
|---|---|---|---|
| Cognitive deficits | Sustained attention | Auditory Continuous Performance Tasks (A-CPT)37 | Rated 1–100% accuracy of hits; version used: “Q1A-INT” (low working memory load/low interference load) |
| Attention and processing speed | Brief Assessment of Cognition in Schizophrenia (BACS) symbol coding38 | Rated 0–115 correct responses; t-scores range 0–100 were used in analyses | |
| Verbal learning and memory | Hopkins Verbal Learning Test (HVLT)39 | Rated 0–36 correct responses; t-scores range 0–78 were used in analyses | |
| Stress | Impact of minor stressful events over the last 24 hours | Daily Stress Inventory (DSI)40 | Rated 0–434, higher scores = greater stress |
| Depression symptoms | Depression symptoms independent of schizophrenia and CHR symptoms | Calgary Depression Scale for Schizophrenia (CDSS)41 | Rated 0–27, higher scores = greater symptoms |
Statistical Analyses
Baseline Sociodemographic and Clinical Characteristics.
Group differences in baseline sample characteristics were examined using χ 2, ANOVAs, and Tukey post hoc tests, as appropriate.
Baseline Sleep Patterns.
The associations between baseline characteristics of total sleep score and group status were examined with ANOVAs. Cox regression survival analysis was used to explore whether baseline sleep predicted earlier conversion to psychosis among the CHR group. To test proportional hazards (PH) assumptions, we examined the interaction between the covariates in the model and time (including interactions with log(time) using the TVC command). Non-significant findings (P > .05) indicate that the PH assumption is not violated.42 We also plotted the Schoenfeld and scaled Schoenfeld residuals (supplementary figure 1).
Sleep Patterns and CHR Symptoms Over Time.
Group differences in the association between sleep trends and CHR symptoms over time were modeled using linear mixed-effects regression analyses [Stata, version 14 (StataCorp)] with effect of time as random slope (from baseline to month 8). Sex, age, race, and current use of alcohol and cannabis were entered as covariates. A statistically significant main effect of sleep would indicate an association between CHR symptoms and sleep patterns over time. A statistically significant group-by-sleep interaction would indicate a group-specific difference in the association between sleep and CHR symptoms between converters and CHR-NC. Controls were used as reference category.
Analyses were repeated per CHR subdomain (ie, positive, negative, disorganized, and general), and for each of the 10 sleep components separately.
An adjusted P-value threshold of .002, which is (0.05 ÷ 28) or ((10 sleep items + 4 symptom domains) * 2 statistical models, ie, main effects and interaction effects), was used in all mixed linear models to account for multiple comparisons.
Effects of Cognitive Deficits, Daily Stress, Depression, and Psychotropic Medication.
We entered attention, processing speed, verbal memory, daily stress, depression symptoms, and psychotropic medication (all measured at each time point) as covariates into separate linear mixed models to examine whether any of these factors influenced main, group, or group-by-sleep interaction effects.
Direction of Association Between Sleep Patterns and CHR Symptoms.
Cross-lagged path models [maximum-likelihood missing values (MLMV) method] were used to explore the directionality of the relationship between sleep and symptoms at baseline and 2 months post-baseline. Data at baseline and 2 months were used to capture the largest sample size and the more immediate effects of sleep disturbance.
Sensitivity Analyses
Sleep total score was comprised of the seven PSQI components, a napping frequency variable, and two RU-SATED items to enable thorough analysis of various aspects of disturbed sleep. Since this combined measure has not been validated, we repeated all analyses using the PSQI global score for comparison.
R43 was used for baseline analyses and graphics. All other statistical analyses were performed in Stata 15.1.44
Results
Baseline Sociodemographic and Clinical Characteristics
Table 2 displays baseline characteristics of converters, CHR non-converters (CHR-NC), and controls. There were no differences in sex, student status, age, and years of education between groups. There were more white race CHR-NC participants than controls (P < .05) and, as expected, converters and CHR-NC were using significantly more psychotropic medication than controls (P < .001). Converters and CHR-NC had greater stress levels (P < .001) and depression symptoms (P < .001) than controls, and alcohol was more frequently used among CHR-NC than converters (P < .05). There were no group differences in cannabis use. Attention scores were lower in converters than CHR-NC (P < .05), processing speed was lower in converters and CHR-NC compared to controls (P < .05), and verbal learning was lower in CHR-NC than in controls (P < .05). Social and role functioning were both lowest among converters and highest among controls, with statistically significant mean differences between all three groups (P < 0.001). Analogously, baseline SOPS scores were most severe among converters and least severe among controls, with statistically significant mean differences between all three groups (P < .001).
Baseline Sociodemographic, Clinical, and Sleep Characteristics
| Controlsa N = 94 | CHR Non- Convertersb N = 411 | Convertersc N = 67 | Test Statistic | Post-hoc Group Comparisons | |
|---|---|---|---|---|---|
| n (%) | n (%) | n (%) | χ 2 | ||
| Male | 48 (51.06) | 224 (54.50) | 36 (53.73) | 0.36 | n.s. |
| White race | 42 (44.68) | 233 (56.69) | 33 (49.25) | 5.21 | a≠b* |
| Enrolled as a student | 83 (88.30) | 344 (83.70) | 50 (74.63) | 5.38 | n.s. |
| Psychotropic medication (any) | 1 (1.06) | 192 (46.72) | 31 (46.27) | 68.76*** | a≠b***; a≠c*** |
| Mean [SD] | Mean [SD] | Mean [SD] | F | ||
| Age | 18.57 [4.25] | 18.30 [4.10] | 18.85 [4.02] | 0.62 | n.s. |
| Years of education | 12.13 [3.40] | 11.49 [3.13] | 11.67 [2.79] | 1.59 | n.s. |
| Stress (0–434) | 34.86 [38.54] | 69.05 [55.52] | 66.02 [48.70] | 16.23*** | a≠b***; a≠c*** |
| Depression (0–27) | 0.61 [1.33] | 6.14 [4.34] | 7.18 [4.57] | 79.85*** | a≠b***; a≠c*** |
| Alcohol use (0–5) | 0.86 [1.16] | 0.82 [1.28] | 0.43 [0.80] | 3.21* | b≠c* |
| Cannabis use (0–5) | 0.26 [0.93] | 0.54 [1.21] | 0.57 [1.21] | 2.43 | n.s. |
| A-CPT (1–100) | 77.11 [16.30] | 77.14 [16.61] | 70.78 [19.70] | 3.98* | b≠c* |
| BACS t-score (0–100) | 47.69 [11.85] | 41.97 [12.00] | 38.73 [14.59] | 4.56* | a≠b*; a≠c* |
| HVLT-R t-score (0–78) | 50.97 [12.65] | 45.97 [10.61] | 45.85 [10.15] | 3.16* | a≠b* |
| Global funct. social scale (10-0) | 8.67 [0.79] | 6.50 [1.45] | 5.90 [1.52] | 111.63*** | a≠b***; a≠c***; b≠c** |
| Global funct. role scale (10-0) | 8.74 [0.94] | 6.32 [2.21] | 5.60 [2.32] | 62.14*** | a≠b***; a≠c***; b≠c* |
| SOPS total score (0–114) | 4.404 [5.04] | 38.16 [12.83] | 45.34 [11.02] | 358.13*** | a≠b***; a≠c***; b≠c*** |
| Sleep total score (0–28) | 5.78 [3.09] | 9.94 [4.19] | 10.17 [4.88] | 40.10*** | a≠b***; a≠c*** |
| PSQI total (0–21) | 3.68 [2.22] | 7.59 [3.64] | 8.08 [4.46] | 49.23*** | a≠b***; a≠c*** |
| PSQI (range 0–3) | |||||
| Sleep duration | 0.24 [0.67] | 0.57 [0.89] | 0.67 [1.04] | 6.08** | a≠b**; a≠c** |
| Sleep disturbance | 0.84 [0.40] | 1.14 [0.52] | 1.15 [0.53] | 13.59*** | a≠b***; a≠c*** |
| Sleep latency | 0.79 [0.83] | 1.67 [1.05] | 1.71 [1.19] | 28.98*** | a≠b***; a≠c*** |
| Daytime dysfunction/sleepiness | 0.56 [0.77] | 1.60 [0.95] | 1.55 [0.96] | 48.33*** | a≠b***; a≠c*** |
| Habitual sleep efficiency | 0.30 [0.56] | 0.57 [0.92] | 0.83 [1.05] | 7.23** | a≠b*; a≠c*** |
| Subjective sleep quality | 0.82 [0.53] | 1.36 [0.78] | 1.41 [0.88] | 20.40*** | a≠b***; a≠c*** |
| Sleep medication use | 0.11 [0.37] | 0.75 [1.17] | 0.76 [1.24] | 13.67*** | a≠b***; a≠c*** |
| Napping ¬ | 1.22 [1.03] | 1.16 [1.08] | 1.05 [1.10] | 0.54 | n.s. |
| RU-SATED (range 0–2)^ | |||||
| Sleep regularity | 0.62 [0.69] | 0.80 [0.73] | 0.68 [0.73] | 2.82 | n.s. |
| Sleep timing | 0.28 [0.54] | 0.39 [0.54] | 0.36 [0.48] | 1.61 | n.s. |
Note: *P < .05, **P < .01, ***P < .001; CHR, clinical high risk; ¬ item developed by NAPLS and is not part of PSQI; ^ original scoring direction reversed.
Of the 572 participants, 112 (20%) completed a single sleep assessment only and 202 (35%) completed all 5 assessments (the remainder completed 2–4 assessments). Baseline differences between individuals who completed only 1 vs >1 assessments are summarized in supplementary table 2. Individuals who dropped out after 1 assessment had comparable baseline total sleep scores but significantly less severe CHR symptoms than those with follow-up data (P < .001).
Baseline Sleep Characteristics
Table 2 shows group differences in sleep disturbance at baseline. PSQI total score and component scores for sleep duration, disturbance, latency, daytime dysfunction, efficiency, subjective quality, and medication use were all worse in CHR individuals (converters and nonconverters) compared with controls. CHR and control groups did not differ in napping frequency or the RU-SATED items regularity and timing. Converters did not differ from CHR-NC on any sleep characteristic. PSQI global score in controls was ≤5, which indicates good sleep quality, while global scores in converters and CHR-NC were >5 which suggests poor sleep quality.
Sleep and Clinical Characteristics Over Time
Baseline Sleep Patterns did not Predict Conversion to Psychosis in CHR Individuals.
Cox regression analyses examining time to conversion showed that total sleep score at baseline did not predict earlier conversion to psychosis (HR = 1.01; 95% CI = 0.96–1.07; SE = 0.03; z = 0.40; P = .69). There was no evidence that the PH assumption was violated (time-dependent covariate P-values ranged 0.12–0.88). See supplementary figure 1 for plots of Schoenfeld residuals.
Figure 1 presents average sleep score per group over time. While the CHR-NC and converter groups appear to diverge at the 2-month follow-up (with slightly more sleep problems among converters), linear mixed-effects models do not indicate significant differences in group-by-timepoint interaction (P-values range .07–.56). Cohen’s d values ranged from 0.04 to 0.11, indicating small effect sizes.
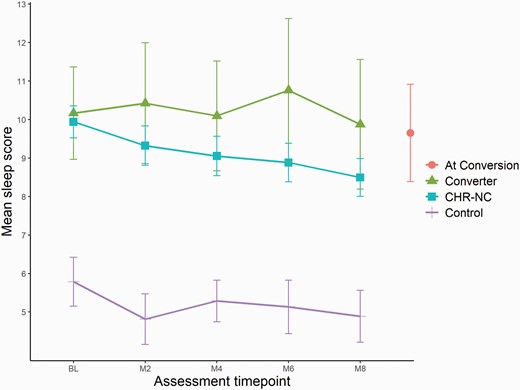
Changes in sleep during study period.Note: Error bars indicate 95% CI; CHR-NC = clinical high risk nonconverters; M = months after BL assessment; higher sleep score indicates greater sleep disturbance.
Disrupted Sleep Patterns were Associated with Worse CHR Symptoms Over Time.
Table 3 presents the main effect of sleep on CHR symptoms over time, as well as group differences in these associations. Total sleep disturbance score was significantly associated with total (B = 0.56), positive (B = 0.11), negative (B = 0.20), disorganized (B = 0.08), and general (B = 0.22) CHR symptom domains at P < .001 significance levels. No group-by-sleep interactions reached statistical significance, suggesting that associations between sleep and symptoms were comparable between converters and CHR-NC.
Effects of Total Sleep Score on CHR Symptom Domain
| Symptom Domain | Main Effect (Total Sleep Over Time) | Group Effect | Sleep-by-Group Interaction | ||||
|---|---|---|---|---|---|---|---|
| B (95% CIs) | P | Group | B (95% CIs) | P | B (95% CIs) | P | |
| SOPS total | |||||||
| 0.56 (0.45, 0.67) | <.001 | Controls CHR-NC CHR-C | - 28.98 (26.56, 31.41) 36.5 (33.14, 39.87) | - <.001 <.001 | −0.27 (−0.09, 0.63) −0.16 (−0.62, 0.30) | − 15 .49 | |
| Positive symptoms | |||||||
| 0.11 (0.07, 0.15) | <.001 | Controls CHR-NC CHR-C | - 10.87 (10.18, 11.56) 12.42 (11.46, 13.38) | - <.001 <.001 | − 0.06 (−0.06, 0.19) 0.04 (−0.12, 0.20) | − .32 .61 | |
| Negative symptoms | |||||||
| 0.20 (0.15, 0.25) | <.001 | Controls CHR-NC CHR-C | - 8.79 (7.61, 9.97) 12.16 (10.51, 13.8) | − <.001 <.001 | − 0.1 (−0.08, 0.27) −0.18 (−0.40, 0.04) | − .27 .12 | |
| Disorganized symptoms | |||||||
| 0.08 (0.06, 0.11) | <.001 | Controls CHR-NC CHR-C | - 3.74 (3.13, 4.36) 5.94 (5.08, 6.79) | − <.001 <.001 | − 0.06 (−0.03, 0.14) −0.02 (−0.14, 0.09) | − .22 .69 | |
| General symptoms | |||||||
| 0.22 (0.18, 0.25) | <.001 | Controls CHR-NC CHR-C | − 4.69 (4.06, 5.31) 5.41 (4.54, 6.28) | − <.001 <.001 | − 0.08 (−0.03, 0.19) 0.01 (−0.13, 0.16) | − .18 .84 | |
Note: CHR-NC = Clinical High Risk Non-Converters; Bonferroni adjusted significant P-value ≤ .002; Controls were used as reference group.
Half of the Sleep Characteristics were Independently Associated with CHR Symptom Severity
(supplementary table 3). Exploring the effects of each sleep component on every CHR symptom domain separately, we observed that sleep duration, disturbance, latency, daytime dysfunction due to sleepiness, and subjective sleep quality were associated with all or nearly all CHR domains at P < .001 significance levels. Sleep efficiency, medication use, napping frequency, regularity, and timing were not significantly associated with any CHR symptom domain. No group-by-sleep interactions reached statistical significance.
Depression Attenuated the Association Between Sleep and CHR Symptoms
(supplementary table 4). Adjusting for deficits in attention, processing speed, verbal memory, daily stress, and use of psychotropic medications did not meaningfully impact the main effects of total sleep score on any CHR symptom domain. However, adjusting for depression weakened the association between total sleep score and positive symptoms to P = .20; moreover, while associations with the other symptom domains remained at P < .001 significance levels, all regression coefficients were reduced by roughly half or more, indicating that depression symptoms explained a large portion of the association between sleep and CHR symptoms. No group or group-by-sleep interactions were meaningfully impacted (not shown in table; data available upon request). Sensitivity analysis of depression excluding the CDSS item “Early Wakening” did not meaningfully change these results.
Baseline Sleep was a Significant Predictor of CHR Symptoms Two Months Later but not Vice Versa.
Figure 2 shows cross-lagged analyses exploring the directionality of sleep-symptom associations in the full sample of 688 CHR individuals. Baseline sleep was significantly associated with total (B = 0.08, P = 0.02), positive (B = 0.09, P = 0.01), negative (B = 0.07, P = .04), and general CHR symptoms (B = 0.15, P < .001) at 2 months. While regression coefficients were nearly the same in both directions, only baseline general symptoms significantly predicted sleep at two months (B = 0.12, P = .01) to form a bidirectional relationship. Disorganized symptoms were not associated with sleep in either direction.
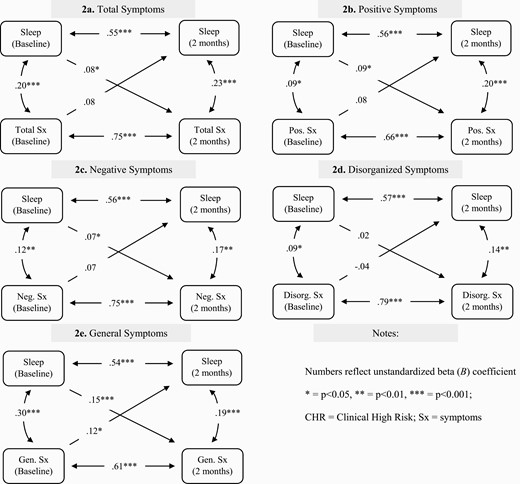
Assessment of directionality between total sleep score and clinical symptoms at baseline and 2 months within the CHR group.
Sensitivity Analysis
All analyses using total sleep score were repeated using the PSQI global score only. The main effects of sleep on CHR symptoms over time were largely similar (supplementary table 5). In the cross-lag model, effects of baseline sleep on subsequent CHR symptoms were stronger using the PSQI alone (supplementary figure 3).
Discussion
In this longitudinal study, individuals at CHR for developing psychosis reported ample sleep disturbances over the study period. Although baseline sleep patterns did not predict conversion to psychosis, our findings demonstrate that disturbed sleep is strongly related to increased severity of CHR symptoms over time. This association held in half the sleep characteristics when explored independently. Adjusting for depression attenuated the association between sleep and symptoms considerably. Furthermore, while effect sizes were similar bidirectionally, baseline sleep was a significant predictor of CHR symptoms two months later but not vice versa. These findings advance the current literature in several important ways.
First, our findings correspond with previous CHR studies in which sleep difficulties at baseline did not predict conversion.9,11 This may suggest that sleep operates as an indicator of conversion only in conjunction with several other important markers. This hypothesis is supported by a predictive risk model of conversion10 in which “sleep disturbance” was one of the six factors (including positive symptoms and global functioning) that, jointly, yielded a markedly high positive predictive value. Sleep disturbances may have predictive value when they occur close to time of conversion, since sleep alterations are early indicators of psychosis relapse.45 Poor sleep may also predict conversion among specific groups, such as those with prolonged sleep disturbance or those who only recently developed sleep problems. The role of disturbed sleep as a potential catalyst for conversion in our study remains speculative because 30% of converters completed only one sleep assessment and 27% transitioned to psychosis 10 months post-baseline, at which point sleep was no longer tracked longitudinally. Future studies would benefit from looking at sleep metrics tracked longitudinally in large samples followed through the time of conversion.
Second, our findings reveal long-term and robust correlations between a wide range of sleep disturbances and symptoms across all four CHR domains. Although poor sleep did not predict conversion, its relation with symptom exacerbation is clinically important considering that even non-converting CHR youth often have poor functional outcome and persistent symptoms.46,47 Our current findings using self-reports are supported by electrophysiological studies relating REM latency48 and REM density45 to positive symptoms in psychotic disorders, reduced delta EEG activity49 and reduced REM latency50 to negative symptoms in schizophrenia, and reduced sleep spindle activity to both positive and negative symptoms,51 although these findings vary.52 In further concordance with our findings on disorganized and general symptoms, individuals with non-affective psychoses and comorbid sleep disorders had greater cognitive disorganization, depression, anxiety and tension/stress levels than those without the latter morbidity.48 Likewise, EEG delta activity in early-course non-affective psychoses were inversely related to disorganization syndrome.53 Although associations between sleep parameters and clinical symptoms vary largely across studies, individuals, and stages of illness,2,45,54 sleep characteristics of psychosis-afflicted individuals unequivocally differ from those who are unaffected, and these differences are present prior to illness onset.
Third, symptoms of depression showed a strong attenuating effect, such that relationship strengths between sleep and all CHR symptom domains were reduced by roughly half or more. Disturbed sleep is a symptom of and risk factor for depression,22,55,56 and unipolar depressive disorders are common comorbidities among CHR youth. In 744 CHR individuals, >40% met DSM-IV criteria for current depression and almost 20% for past depression.57 Similarly, depression mediated the association between sleep and suspiciousness in CHR youth,9 and consistently partially mediated the association between sleep and psychotic experiences.45 The attenuating role of depression in the current study served to strengthen existing cross-sectional evidence and demonstrate its validity over time.
Lastly, we aimed to address the directionality of the relationship between sleep and CHR symptoms. Between baseline and 2-month follow-up, total sleep score was a significant predictor of total, positive, negative, and general CHR symptoms. While general symptoms were the only domain with a statistically significant bidirectional association with sleep, bidirectional effect sizes, as indicated by (unstandardized) regression coefficients (B), were all nearly equal. These findings suggest that sleep is a driving force in symptom exacerbation, and that promoting healthy sleep may be a useful target for the maintenance of CHR symptoms. Evidence has been accumulating in support of cognitive behavioral therapy (CBT) for insomnia, which not only reduced insomnia but also improved symptoms of paranoia and hallucinations in a large sample of university students18 and in a small CHR group.58 Adjacent research has found that sleep quality is malleable and thus can be improved even in clinical populations.59,60 These findings offer promising evidence for advancement in clinical staging models61 and future sleep-related therapies for both CHR and overt psychosis, such as an upcoming trial by Waite et al.62 Another budding direction of research involves computational advances in causal discovery analysis, offering innovative approaches to addressing causality in the context of observational data.63,64 Such methods require careful consideration of assumptions and properties underlying the data at hand,65 but could be utilized in future analyses of these and other prospective longitudinal datasets involving CHR and other clinical populations.
Limitations of this study include the use of a self-report to assess sleep. The PSQI and the RU-SATED have high validity and reliability66,67 and subjective sleep problems (eg, insomnia) have been the primary focus of sleep treatments. Such assessments, however, are fundamentally different from electrophysiological sleep characteristics (eg, changes in REM sleep, sleep spindles, and delta sleep) that may be differentially associated with conversion and symptom levels. Therefore, the use of both self-report and electrophysiological sleep measures over time may inform clinical risk models and constitute targets for intervention. Other notable limitations include the significant dropout rates, the absence of ongoing sleep assessments succeeding the 8-month follow-up, and the relatively small sample size of our converting group (despite being one of the largest samples of CHR converters to date). Furthermore, we acknowledge that pre-registering our study hypotheses would have strengthened our findings.
Conclusion
This study sheds light on an instrumental yet clinically underappreciated feature of the CHR state. Disturbed sleep was shown to be implicated in the processes underlying clinical symptom increases and not solely a consequence of heightened symptomatology. As such, sleep therapy is a promising intervention target for CHR symptom amelioration. Future studies would benefit from capturing sleep patterns in the crucial period leading up to conversion for further insight into this association.
Conflict of Interest
The authors have no relevant conflicts of interest.
Funding
This work was supported by the following National Institutes of Health grants: K01DA043615, R01MH108574, U01MH081984, U01MH081928, U01MH081944, U01MH081902, U01MH082004, U01MH081988, U01MH082022, U01MH076989, U01MH081857, R01MH102377, R01MH074794, P41EB015902, DA046346, UH3 HL125103 (DJB) as well as the Shear Family Foundation and Levin Trust (CEB). EV is supported by the Beatrice and Samuel A. Seaver Foundation.
References
Author notes
These authors contributed equally to this work.
