


Abstract
Discriminating subjects at clinical high risk (CHR) for psychosis who will develop psychosis from those who will not is a prerequisite for preventive treatments. However, it is not yet possible to make any personalized prediction of psychosis onset relying only on the initial clinical baseline assessment. Here, we first present a systematic review of prognostic accuracy parameters of predictive modeling studies using clinical, biological, neurocognitive, environmental, and combinations of predictors. In a second step, we performed statistical simulations to test different probabilistic sequential 3-stage testing strategies aimed at improving prognostic accuracy on top of the clinical baseline assessment. The systematic review revealed that the best environmental predictive model yielded a modest positive predictive value (PPV) (63%). Conversely, the best predictive models in other domains (clinical, biological, neurocognitive, and combined models) yielded PPVs of above 82%. Using only data from validated models, 3-stage simulations showed that the highest PPV was achieved by sequentially using a combined (clinical + electroencephalography), then structural magnetic resonance imaging and then a blood markers model. Specifically, PPV was estimated to be 98% (number needed to treat, NNT = 2) for an individual with 3 positive sequential tests, 71%–82% (NNT = 3) with 2 positive tests, 12%–21% (NNT = 11–18) with 1 positive test, and 1% (NNT = 219) for an individual with no positive tests. This work suggests that sequentially testing CHR subjects with predictive models across multiple domains may substantially improve psychosis prediction following the initial CHR assessment. Multistage sequential testing may allow individual risk stratification of CHR individuals and optimize the prediction of psychosis.
Introduction
In the last 2 decades, a new research paradigm has supported the development of preventive interventions in individuals at clinical high risk (CHR) for psychosis.1 Preventive intervention in CHR individuals for psychosis has unique and unprecedented potential in the history of psychiatry to alter the course of disabling illnesses such as schizophrenia (see meta-analyses of effective treatments in CHR individuals2,3).
Effective preventive interventions for CHR individuals are limited by the ability to prognosticate psychosis onset from an initial CHR state. CHR psychometric instruments have excellent prognostic properties (AUC = 0.90),4 which is comparable to other preventive approaches in medicine.5 However, excellent prognostic performances are mainly mediated by an outstanding ability of the CHR instruments to rule out psychosis, ie, very low negative likelihood ratios and high sensitivity (SE), at an expense of their ability to rule in psychosis, ie, unsatisfactorily low positive likelihood ratios and only moderate overall specificity (SP).4 Specifically, the initial CHR testing can increase the probability of detecting risk of developing psychosis in subjects referred to high-risk services from 15% (pre-test risk) at approximately 3 years4 to a 26% probability of psychosis onset (post-test risk),4 mostly toward schizophrenia spectrum psychoses6 (for further details on pre- and post-test concepts please see Fusar-Poli et al7,8). Consequently, there is a need to improve the ability to rule in heightened risk of subsequent psychosis, while preserving the outstanding ability to rule it out.4 Improved prediction would facilitate personalized interventions and minimize either unnecessary treatment (for the false positives) or lack of treatment (for the false negatives). To improve the limited positive predictive values (PPVs) delivered by psychopathology-based classifications associated with CHR instruments,9 models with biological, neurocognitive or environmental data have been developed. In fact, the use of predictive models10 along with sequential multistage testing11 is common practice in preventive medicine to improve prognostic discrimination between individuals who will develop a certain condition and those who will not.
This study first presents a systematic review of predictive models used to improve prediction of psychosis onset in CHR. We systematically reviewed prognostic accuracy metrics (SE, SP, PPV, negative predictive value (NPV), for details see Fusar-Poli et al7) across clinical, biological, neurocognitive, environmental, and combined predictive models. In a second step, we sought to investigate the potential clinical utility of sequential 3-stage testing following an initial CHR assessment. We employed meta-analytical simulation analyses across different combinations of models and critically discussed the findings in light of risk stratification approaches.12
Methods
Search Strategy and Selection Criteria
A systematic search strategy identified relevant articles. Three investigators (MC, GR, AS) conducted a 2-step literature search. At a first step, the Web of Knowledge database by Thomson Reuters was searched, incorporating both the Web of Science and MEDLINE. The search was extended until October 2015. We used several combinations of the following keywords: “at risk mental state,” “psychosis risk,” “prodrome,” “prodromal psychosis,” “high risk,” “prognostic accuracy,” “sensitivity,” “specificity,” “psychosis prediction,” “psychosis onset,” and the name of each CHR assessment instrument. The second step involved using Scopus to search citations of previous systematic reviews on transition outcomes in CHR subjects and a manually searching the reference lists of retrieved articles. Articles identified through these 2 steps were then screened for the selection criteria on basis of abstract. The articles with potentially relevant abstracts were retrieved and assessed for eligibility.
Studies were included if the following criteria were fulfilled: (a) original articles, written in English; (b) inclusion of CHR subjects (ie, presence of attenuated psychosis symptoms [APS] or genetic risk and deterioration syndrome [GRD] or brief limited and intermittent psychotic symptoms [BLIPS] or brief intermittent psychosis syndrome [BIPS] or basic symptoms) according to international standard criteria1; (c) inclusion of clinical, biological, neurocognitive, environmental, or combinations of predictors to distinguish CHR individuals who later developed psychosis from those who did not; (d) inclusion of appropriate predictive models, algorithms, or learning systems to predict the probability of transition to psychosis, such as regression (logistic, Cox proportional hazard model, least absolute shrinkage, and selection operator), support vector machines or greedy algorithms.13–16 Exclusion criteria were: (a) abstracts, pilot datasets, reviews, articles in languages other than English; (b) inappropriate statistics (ie, use of mean differences or chi square tests); (c) studies testing the prognostic accuracy of the baseline CHR assessment as predictor (previously reviewed in Fusar-Poli et al4) (d) articles with overlapping datasets using the same predictor. Specifically, in case of multiple publications deriving from the same study population, we selected the articles reporting the largest, most recent data set. The search results were summarized according to the PRISMA guidelines17 (figure 1).
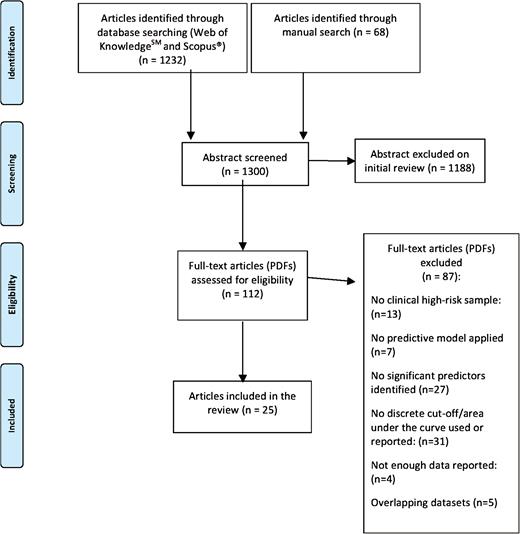
PRISMA flow chart.
Recorded Variables
Data extraction was independently performed by 3 investigators (MC, GR, AS). The following variables were recorded from each article: author, year of publication, demographic characteristics of the CHR sample, predictor domain (clinical, biological, neurocognitive, environmental, combinations), cut-off of predictive variables, use of validation, type of CHR diagnostic instrument used, exposure to antipsychotics, follow-up time, predictive model and prognostic accuracy data (SE, SP, PPV, NPV). When prognostic accuracy data were not directly presented they were indirectly extracted from associated measures if possible. Additionally, we contacted all the corresponding authors to provide additional data when needed.
Meta-analytical Sequential Testing Simulations
Models Selection.
Using statistical probabilistic simulations based on Bayes’theorem,18 we estimated the theoretical PPV of a sequential 3-stage testing following the initial CHR assessment. Such testing included different combinations of 3 predictive models (eg, electroencephalography/clinical, magnetic resonance imaging, and blood markers). We restricted the simulations to 3 tests because more tests would be practically infeasible in clinical practice. Validation is of paramount importance if the estimation of the PPV has to work satisfactorily for individuals other than those from whose data the model was derived.19,20 Therefore, we limited the potential combinations of tests to studies that had performed a validation of their models. Also, we did not mix together models that used the same type of predictive parameters, eg, we did not simulate combinations in which 2 of the assessments involved EEG.
Procedure.
See online supplementary methods 1 for mathematical details of these analyses, which were conducted using R software.21 Briefly, we simulated that an individual would first have a CHR baseline assessment, which would convert the “pre-CHR assessment probability of transition to psychosis” into a “post-CHR assessment probability of transition to psychosis”.7 The value of the latter would depend on the former, on the SE and SP of the CHR assessment, and on the result of the CHR assessment.4 If the CHR assessment was positive, the individual would then undergo a second test (eg, a structural MRI) which would convert the “post-CHR assessment/pre-MRI probability of transition to psychosis” into a “post-MRI probability of transition to psychosis.” Again, the value of the latter would depend on the former, on the SE and SP of the MRI test, and on the result of the MRI assessment. These steps were repeated for each of the 3-stage tests.
Following this strategy, we obtained probabilistic 3-stage sequential testing diagrams such as the one shown in figure 2, in which the x-axis shows the sequential tests and the y-axis the probability of transition to psychosis before and after knowing the results of each of the tests. Each bifurcation in the plot represents the update in the probability of transition to psychosis after knowing that the test yielded a positive result (ascending solid line) or after knowing that the test yielded a negative result (descending dashed line).
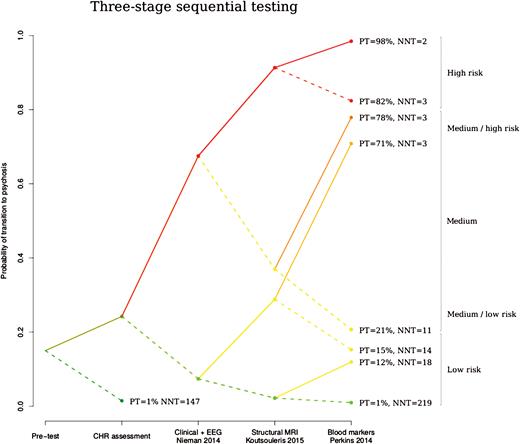
Probabilistic risk assessment diagram illustrating the 3-stage sequential testing of the best combination of complementary tests identified by our simulation analyses: step 1: EEG + clinical test,22 step 2: structural MRI test,23 and step 3: blood markers test.24 The x-axis shows the 3 sequential tests following the initial clinical high-risk assessment and the y-axis the probability of transition to psychosis during 36 months of follow-up, before and after knowing the results of each test. Each bifurcation in the plot represents the update in the probability of transition to psychosis after knowing that the test yielded a positive result (ascending solid line) or after knowing that the test yielded a negative result (descending dashed line). The color of the lines reflects the level of risk for psychosis as previously suggested18: high (in red) when the probability of transition to psychosis (PT) was >80%, medium when PT was 20%–80% and low (in green) when PT was <20%; we further subdivided medium in medium-high (in orange, when PT was between 70% and 80%) and medium-low (in brown, when PT was 20%–30%). The diagram also illustrates the number needed to treat (NNT) at each node.
We focused on the combination that yielded the best PPV, as this would be the one to be further validated and potentially applied in clinical practice4 (see online supplementary methods 2 for details). However, in order to provide the whole range of results from this simulation work, we also present the following less advantageous scenarios.
Firstly, we reported the poorer global PPVs of all other combinations of tests. Secondly, we estimated the lower limit of the 95% confidence interval of the global PPV. This global interval combined the confidence interval of the pre-CHR assessment probability to transition,4 plus the 4 confidence intervals associated to the CHR assessment and the 3 subsequent tests.
Thirdly, we recalculated the global PPV assuming a degree of correlation between the tests, so that the SE and SP of a test would depend on the results of the previous tests, decreasing the contribution of the test to the global PPV. For example, we assumed that among individuals who will have a psychotic episode, those with a positive CHR assessment are more likely to have a positive MRI test.
Impact of CHR Subgroups.
Finally, we repeated the simulation for different CHR subgroups. Given that the BLIPS/BIPS shows the highest risk of transition to psychosis, which is comparable to other brief psychotic disorders coded in international manuals,25 the GRD the lowest risk and the APS an intermediate risk,26 we conducted a separate analysis to test the impact of the CHR subgroup on the final prognostic accuracy.
Theoretical Clinical Effectiveness of 3-Stage Sequential Testing.
We further assessed the theoretical clinical effectiveness of 3-stage sequential testing by estimating the number needed to treat (NNT) at each node, assuming a risk ratio for preventative treatments of 0.54 as reported in previous meta-analysis of RCTs in CHR patients.3
Results
Selection of Studies
The electronic and manual searches returned 1300 studies. After the screening of abstracts 112 full articles were retrieved for further evaluation (figure 1). Twenty-five of them met the inclusion criteria; 10 studies using clinical predictive models, 5 studies using biological models, 5 studies using neurocognitive models, 5 studies using environmental models, and 8 studies using combinations of predictive models across different domains. The details of the included studies are reported in table 1.
Studies Reporting Predictive Models in CHR Subjects
| Study | CHR Assessment Instrument | Followed Up CHR Sample (NT/T) | Age (Mean ± SD) | Female (n) | Antipsychotics | Follow-up (months) |
|---|---|---|---|---|---|---|
| Mason et al27 | APSS, BPRS, SAPS, SANS | 37/37 | Total group: 17.3±2.9 | Total group: 35 | No | 26 |
| Lencz et al28 | SIPS | 21/12 | Total group: 16.5±2.2 | Total group: 16 | No | 32 |
| Hoffman et al29 | SIPS | 19/9 | Total group: 17.2 | Total group: 11 | No | 24 |
| Pukrop et al30 | SIPS, BSABS-P | 39/44 | NT: 24.9±5.28, T: 23.2±5.4 | NT: 14, T: 13 | No | 36 |
| Cannon et al31 | SIPS | 209/82 | Total 18.1±4.6 | Total group: 121 | Yes | 30 |
| Riecher-Rössler et al32 | BSIP, BPRS, SANS | 32/21 | NT: 26.2±9.7, T: 26.5±6.8 | NT: 14, T: 7 | No | 64 |
| Fusar-Poli et al33 | CAARMS | 129/23 | Total group: 23.5±4.59 | Total group: 63 | Yes | 24 |
| Dragt et al34 | SIPS and BSABS-P | 53/19 | NT: 18.9±3.9, T: 20.3±3.9 | NT: 20, T: 5 | Yes | 36 |
| Koutsouleris et al35 | CAARMS, BSABS-P | 20/15 | NT: 25.8±6.8, T: 22.8±3.8 | NT: 6, T: 4 | No | 48 |
| Nelson et al36 | CAARMS, BPRS | 197/114 | Total group: 18.9 | Total group: 161 | No | 60 |
| Nieman et al37 | SIPS, BSABS-P | 207/37 | Total group: 22.5±5.23 | Total group: 107 | Yes | 18 |
| Nieman et al22 | SIPS, BSABS-P | 43/18 | NT: 19±3.8, T: 20.3±4 | NT: 16, T: 5 | Yes | 36 |
| Tarbox et al38 | SIPS | 192/78 | NT: 17.9±4.8, T: 18.4±3.8 | NT: 75, T: 35 | n/a | 30 |
| Koutsouleris et al23 | BPRS, SANS, PANSS | 33/33 | NT: 24.6±5.8, T: 25±5.724.8 | NT: 9, T: 13 | No | 52 |
| van Tricht et al39 | SIPS | 91/22 | NT: 22±4.8, T: 21.8±5.3 | NT: 33, T: 8 | Yes | 18 |
| Perkins et al24 | SIPS | 40/32 | NT: 19.5±4.6, T: 19.2±3.7 | NT: 15, T: 10 | Yes | 24 |
| Ziermans et al40 | SIPS, BSABS-P | 33/10 | NT: 15±2.2, T: 15.9±2.4 | NT: 14, T: 2 | Yes | 72 |
| Michel et al41 | SIPS, SPI-A | 53/44 | NT: 25.3±5.3, T: 24.1±5.7 | NT: 19, T: 15 | Yes | 24 |
| DeVylder et al42 | SIPS | 74/26 | NT: 20.1±3.8, T: 20±3.9 | NT: 19, T: 5 | Yes | 30 |
| Buchy et al43 | SIPS | 141/29 | NT: 19.8±4.5, T: 19.7±4.6 | NT: 59, T: 15 | No | 48 |
| Van Tricht et al44 | SIPS, PANSS, PAS | 43/18 | NT: 19.3±3.7), T: 20.4±4.0 | NT: 14, T: 5 | 9/7 | 36 |
| Cornblatt et al45 | SIPS | 77/15 | Total 15.96±2.18 | Total group: 65 | Yes | 36 |
| Ruhrmann et al46a | SIPS, BSABS-P | 146/37 | Total group: 23.6±5.4 | Total group: 84 | Yes | 18 |
| Ramyead et al47 | BSIP | 35/18 | NT: 25.8±7.36, T: 26.7±7.64 | NT: 12, T: 8 | No | 36 |
| Bearden et al48 | SIPS | 33/21 | NT: 16.97±3.4, T: 17.3±4.4 | NT: 36, T: 19 | Yes | 12 |
Note: APSS, the assessment of prodromal and schizotypal symptoms; BPRS, Brief Psychiatric Rating Scale; BSABS-P, The Bonn Scale for the assessment of basic symptoms-prediction list; BSIP, Basel Screening Instrument for Psychosis; CAARMS, comprehensive assessment of at risk mental states; CASH, comprehensive assessment of symptoms and history; CHR, clinical high risk; ERIraos, early recognition inventory based on the retrospective assessment of the onset of schizophrenia; HR, high risk; n/a not available; NT, nontransition; PANSS, Positive and Negative Symptoms Scale; PAS, premorbid assessment scale; PSE, present state examination; SANS; Scale for Assessment of Negative Symptoms; SAPS, Scale for Assessment of Positive Symptoms; SD, standard deviation; SIPS, structured interview for prodromal syndromes; SOPS, Scale of Prodromal Symptoms; SPI-A, Schizophrenia Proneness Instrument, Adult version; T: transition.
aData are shown for the CHR subjects with a known outcome (n = 183). The total group included 245 subjects.
Clinical Predictive Models
The 10 studies testing prognostic accuracy of clinical predictive models are shown in table 2. These tested a wide range of clinical parameters including specific positive,27,31,32,38,40,42,46,48 negative27,32,38 and basic symptoms,40 a decline in social and global functioning27,31,36,46 and the Strauss and Carpenter Prognostic Scale.37
Prognostic Accuracy Parameters of the Predictive Models Included in the Systematic Review
| Study | Predictive Model | Validation | Predictor Domain | Predictive Variable(s) (Cut-off and/or AUC) | SE (%) | SP (%) | PPV (%) | NPV (%) |
|---|---|---|---|---|---|---|---|---|
| Mason et al27 | Logistic regression | No | Clinical | Odd belief (SPD ≥ 1), marked impairment in role functioning (APSS ≥ mild), blunted affect (APSS ≥ mild), auditory hallucinations (SAPS ≥ 2), anhedonia/ asociality (SANS ≥ 2) | 84 | 86 | 86 | 84 |
| Cannon et al31 | Cox proportional hazard model | No | Clinical | Unusual thought content (SIPS > 3) | 56 | 62 | 48 | / |
| Suspicion/paranoia (SIPS > 2) | 79 | 37 | 43 | / | ||||
| Social functioning (SIPS < 7) | 80 | 43 | 46 | / | ||||
| Psychosis in first-degree relatives with functional decline (SIPS and GAF) | 66 | 59 | 52 | / | ||||
| Nelson et al36 | Cox proportional hazard model | No | Clinical | Global functioning (GAF < 44), duration HR symptoms (CAARMS > 738 days) | 45 | 88 | 72 | 69 |
| Nieman et al37 | Cox proportional hazard model | No | Clinical | SCPS < 49 | 76 | 57 | 24 | 93 |
| Bearden et al48 | Logistic regression | No | Clinical | Illogical thinking score (K-FTDS) | 69 | 71 | / | / |
| DeVylder, et al42a | Cox proportional hazard model | No | Clinical | Disorganized communication (SIPS > 2, AUC in the 2 through 4 range: 0.64) | 81 | 38 | 33 | 85 |
| Disorganized communication (SIPS > 3, AUC in the 2 through 4 range: 0.64)b | 62 | 62 | 36 | 82 | ||||
| Disorganized communication score (SIPS > 4, AUC in the 2 through 4 range: 0.64) | 31 | 81 | 36 | 77 | ||||
| Ziermans et al40a | Logistic regression | No | Clinical | Positive symptoms (SIPS > 11.5, AUC: 0.80) | 40 | 85 | 44 | / |
| Cognitive disturbances ≥ 19 (BSABS-P ≥ 19, AUC: 0.79) | 67 | 87 | 60 | 91 | ||||
| Riecher-Rössler et al32a | Logistic regression | No | Clinical | Suspiciousness (BPRS:0.41, AUC: 0.72) | 70 | 72 | 61 | 79 |
| Alogia, anhedonia-asociality (SANS:0.33, AUC: 0.78) | 79 | 68 | / | / | ||||
| Tarbox et al38a | Cox proportional hazard model | No | Clinical | Suspiciousness (SIPS > 3) | 53 | 76 | 51 | 75 |
| Disorganized communication (SIPS > 1) | 72 | 46 | 40 | 76 | ||||
| Social anhedonia (SIPS > 2) | 69 | 58 | 46 | 80 | ||||
| Ruhrmann et al46a | Cox proportional hazard model | No | Clinical | Positive symptoms (SIPS > 16), bizarre thinking (SIPS > 2), sleep disturbances (SIPS > 2), schizotypal personality disorder (SIPS), highest functioning score in the past year (GAF-M score), years of education, AUC of the model: 0.81 | 42 | 98 | 83 | 87 |
| Koutsouleris et al23 | SVM | Internal | Biological | Gray matter volume reduction (dorsomedial, ventromedial, and orbitofrontal areas extending to the cingulate and right intra- and perisylvian structures) | 76 | 85 | 83 | 78 |
| Van Tricht et al39 | Cox proportional hazard model | No | Biological | Quantitative EEG: occipital-parietal individual alpha peak frequency, frontal delta and theta power | 46 | 87 | 56 | 87 |
| Perkins et al24a | Greedy algorithm | Internal | Biological | Blood biomarker: interleukin-1B, growth hormone, KIT ligand, interleukin-8, interleukin-7, resistin, chemokine [c-c motif] ligand 8, matrix metalloproteinase-7, immunoglobulin E, coagulation factor VII, thyroid stimulating hormone, malondialdehyde-modified low density lipoprotein, apolipoprotein D, uromodulin and cortisol (AUC: 0.88) | 60 | 90 | 72 | 84 |
| Van Tricht et al44 | Cox proportional hazard model | No | Biological | ERP: P300 (Amplitude < 14.7 microvolt) | 83 | 79 | / | / |
| Ramyead et al47a | LASSO | Internal | Biological | Quantitative EEG: lagged phase synchronisation, current-source density (AUC: 0.78) | 58 | 83 | / | / |
| Ziermans et al40a | Logistic regression | No | Neurocognitive | IQ (Wechsler Intelligence Scales < 86.5, AUC: 0.77) | 40 | 97 | 80 | 84 |
| Riecher-Rössler et al32a | Logistic regression | No | Neurocognitive | Verbal IQ and attention (MWT/TAP Go/NoGo false alarm: 0.38, AUC: 0.62) | 80 | 59 | 57 | 83 |
| Pukrop et al30 | Logistic regression | No | Neurocognitive | Verbal memory–delayed recall (Auditory Verbal Learning Test), verbal IQ (Multiple Choice Vocabulary Test), verbal memory–immediate recall (Auditory Verbal Learning Test) and processing speed (DST) | 75 | 79 | 80 | 74 |
| Hoffman et al29 | Cox proportional hazard model | No | Neurocognitive | Length of speech illusion (babble task ≥ 4) | 89 | 90 | 80 | 94 |
| Koutsouleris et al35 | SVM | Internal | Neurocognitive | Verbal and executive functioning (MWT-B, DST, TMT-B, RAVLT-DR, and RAVLT-Ret) | 75 | 80 | 83 | 71 |
| Cannon et al31 | Cox proportional hazard model | No | Environmental | Abuse of alcohol, hypnotics, cannabis, amphetamines, opiates, cocaine, hallucinogens (“yes/no” as assessed by the Structured Clinical Interview for DSM-IV or the Schedule for Affective Disorders and Schizophrenia for School-Age Children) | 29 | 83 | 43 | / |
| Fusar-Poli et al33 | Log-rank test | No | Environmental | Unemployment (“yes/no” assessed with unstandardized questionnaire) | 57 | 61 | 20 | 89 |
| Dragt et al34 | Cox proportional hazard model | No | Environmental | Urbanicity (BDF, ≤100000 inhabitants), impaired social-sexual aspects, age 12–15 (PAS), impaired social-personal adjustment, general (PAS) | 63 | 88 | 63 | 88 |
| Tarbox et al38a | Cox proportional hazard model | No | Environmental | Early adolescent social maladjustment (PAS > 2) | 50 | 71 | 46 | 72 |
| Buchy et al43 | Cox proportional hazard model | No | Environmental | Alcohol use (“yes/no” AUS/DUS) | 69 | 81 | 26 | 90 |
| Ziermans et al40a | Logistic regression | No | Combination | Positive symptoms (SIPS > 11.5) and IQ (Wechsler Intelligence Scales ≤ 86.5) (AUC: 0.82) | 50 | 91 | 63 | 86 |
| Riecher-Rössler et al32a | Logistic regression | Internal | Combination | Suspiciousness (BPRS), anhedonia-asociality (SANS) and attention (TAP Go/NoGo false alarm) (cut-off: 0.41, AUC: 0.87) | 83 | 79 | 71 | 86 |
| Nieman et al22a | Cox proportional hazard model | Internal | Combination | P300 amplitude (ERP), social-personal adjustment (PAS) (AUC: 0.86) | 78 | 88 | 74 | 90 |
| Lencz et al28a | Logistic regression | No | Combination | Verbal memory (Wechsler Memory Scale) and positive symptoms (SIPS) (AUC: 0.43) | 82 | 79 | 69 | 88 |
| Tarbox et al38a,c | Cox proportional hazard model | No | Combination | Early adolescent social maladjustment (PAS > 2), suspiciousness (SIPS > 3) | 28 | 92 | 59 | 70 |
| Early adolescent social maladjustment (PAS > 2), disorganized communication (SIPS > 1) | 42 | 82 | 51 | 72 | ||||
| Early adolescent social maladjustment (PAS > 2), social anhedonia (SIPS > 2) | 43 | 78 | 49 | 72 | ||||
| Early adolescent social maladjustment (PAS > 2), ideational richness (SIPS > 0) | 32 | 85 | 50 | 70 | ||||
| Cornblatt et al45a | Cox proportional hazard model | No | Combination | Disorganized communication (SIPS > 2), suspiciousness (SIPS = 5), verbal memory deficit 2 SD below normal, declining social functioning (Global Functioning: Social scale) (AUC: 0.92) | 60 | 97 | 82 | 93 |
| Cannon et al31 | Cox proportional hazard model | No | Combination | Psychosis in first-degree relatives with functional decline (SIPS and GAF), unusual thought content (SIPS > 3), social functioning (SIPS < 7) | 30 | 90 | 81 | / |
| Michel et al41 | Cox proportional hazard model | Internal | Combination | UHR criteria (SIPS), COGDIS criteria (BSABS-P), DST deficit t-score < 40 | 57 | 66 | 58 | 65 |
Note: APSS, the assessment of prodromal and schizotypal symptoms; AUC, area under the curve; AUS/DUS, The Alcohol and Drug Use Scale; BDF, basic data form; BPRS, Brief Psychiatric Rating Scale; BSABS-P, The Bonn Scale for the assessment of basic symptoms-prediction list; CAARMS, comprehensive assessment of at risk mental states; CODGIS, cognitive disturbances; DST, digit symbol test; EEG, electroencephalogram; ERP, event-related potentials; GAF: global assessment of functioning; HRSD, Hamilton Rating; Scale for Depression; K-FTDS, Kiddie-Formal Thought Disorder Scale; LASSO, least absolute shrinkage and selection operator; MWT, Mehrfachwahl-Wortschatz test; NPV, negative predictive value; PAS, Premorbid Adjustment Scale; PPV, predictive positive value; RAVLT-DR, Rey Auditory Verbal Learning-delayed recall; RAVLT-Ret, Rey Auditory Verbal Learning-retention; SANS, Scale for Assessment of Negative Symptoms; SCPS, Strauss and Carpenter Prognostic Scale, score; SD, standard deviation; SE, sensitivity; SFS, social functioning scale; SP, specificity; SPD, Schizotypal Personality Disorder subscale of the International Personality Disorder Examination; SIPS, structured interview for prodromal syndromes; SVM, support vector machine; TAP, Testbatterie zur Aufmerksamkeitsprüfung; TMT, trail-making test.
aCut-off scores for determining sensitivity, specificity, and accuracy values were derived from the receiver operating characteristic curve.
bThe Youden Index (maximal value for sensitivity + specificity − 1) was 0.24 with the optimal cutpoint of a score of 3 for baseline disorganized communication.
cThis model included 58 (of 61) CHR subjects.
The highest PPV of 86% was achieved by using a model including measures of odd beliefs, marked impairment in role functioning, blunted affect, auditory hallucinations, and anhedonia/asociality.27 This model yielded an SE of 84%, SP of 86%, and NPV of 84%. None of the clinical predictive models have been validated.
Biological Predictive Models
Five studies tested the prognostic accuracy of biological predictive models (table 2). The tested models referred to measures of gray matter volume,23 electrophysiological markers,39,44,47 and blood analytes.24
The highest PPV of 83% was achieved using gray matter volumes as the predictive variable, which produced an SE of 76%, SP of 85%, and NPV of 78%.23 This23 and 2 other biological predictive models24,47 have been cross-validated.
Neurocognitive Predictive Models
Five studies tested the prognostic accuracy of cognitive predictive models (table 2). Cognitive predictive models included measurements of IQ,30,32,40 verbal memory,30,35 executive functioning,35 attention,32 processing speed,30,35 and speech perception.29
Including verbal and executive functioning in the predictive model, the highest PPV of 83% could be achieved accompanied with an SE of 75%, SP of 80%, and NPV of 71%.35 Only this model35 has been validated in this domain.
Environmental Predictive Models
The prognostic accuracy of environmental predictive models was tested in 5 studies (table 2). These predictive models comprised substance abuse,31,43 unemployment,33 urbanicity,34 social-sexual aspects,34 and social maladjustments.34,38
The highest PPV (63%) was produced by combining measures of urbanicity, social-sexual aspects, and social-personal adjustment, a predictive model that revealed an SE value of 63%, SP of 88%, and NPV of 88%.34 None of the environmental predictive models have been validated.
Combinations of Predictive Models
Eight studies combined different predictive models across domains to test prognostic accuracy (table 2). These studies combined variables from 2 of the predictive models domains,22,28,31,32,38,40,41,45 but no study considered variables from 3 domains.
The highest PPV (82%) resulted from a predictive model including disorganized communication, suspiciousness, verbal memory deficit, and decline in social functioning. This predictive model yielded an SE of 60%, SP of 97%, and NPV of 93%.45 Excluding this predictive model, 3 other combined predictive models22,32,41 have been validated.
Validated Models Used in the Sequential Testing Simulations
Seven models with validation procedures were used for the simulations.22–,24,32,35,41,47 Model details are reported in table 3.
Predictive Models With Validation Selected for Inclusion in the Meta-analytical Sequential Testing Simulations
| Study | Predictive Model | Predictor Domain | Predictive Variable(s) (Cut-off and/or AUC) | SE (%) | SP (%) | PPV (%) | NPV (%) |
|---|---|---|---|---|---|---|---|
| Koutsouleris et al23 | SVM | Biological | Gray matter volume reduction (dorsomedial, ventromedial, and orbitofrontal areas extending to the cingulate and right intra- and perisylvian structures) | 76 | 85 | 83 | 78 |
| Perkins et al24 | Greedy algorithm | Biological | Blood biomarker: interleukin-1B, growth hormone, KIT ligand, interleukin-8, interleukin-7, resistin, chemokine [c-c motif] ligand 8, matrix metalloproteinase-7, immunoglobulin E, coagulation factor VII, thyroid stimulating hormone, malondialdehyde-modified low density lipoprotein, apolipoprotein D, uromodulin and cortisol (AUC: 0.88) | 60 | 90 | 72 | 84 |
| Ramyead et al47 | LASSO | Biological | Quantitative EEG: lagged phase synchronisation, current-source density (AUC: 0.78) | 58 | 83 | / | / |
| Koutsouleris et al35 | SVM | Neurocognitive | Verbal and executive functioning (MWT-B, DST, TMT-B, RAVLT-DR, and RAVLT-Ret) | 75 | 80 | 83 | 71 |
| Riecher-Rössler et al32 | Logistic regression | Combination | Suspiciousness (BPRS), anhedonia-asociality (SANS) and attention (TAP Go/NoGo false alarm) (cut-off: 0.41, AUC: 0.87) | 83 | 79 | 71 | 86 |
| Nieman et al22 | Cox proportional hazard model | Combination | P300 amplitude (ERP), social-personal adjustment (PAS) (AUC: 0.86) | 78 | 88 | 74 | 90 |
| Michel et al41 | Cox proportional hazard model | Combination | UHR criteria (SIPS), COGDIS criteria (BASBS-P), DST deficit t-score < 40 | 57 | 66 | 58 | 65 |
Note: AUC, area under the curve; BPRS, Brief Psychiatric Rating Scale; BSABS-P, The Bonn Scale for the assessment of basic symptoms-prediction list; COGDIS, cognitive disturbances; DST, digit symbol test; EEG, electroencephalogram; ERP, event-related potentials; MWT-B, Mehrfachwahl-Wortschatz test; NPV, negative predictive value, PAS, Premorbid Adjustment Scale; PPV, predictive positive value; RAVLT-DR, Rey Auditory Verbal Learning-delayed recall; RAVLT-Ret, Rey Auditory Verbal Learning-retention; TAP, Testbatterie zur Aufmerksamkeitsprüfung; SANS, Scale for Assessment of Negative Symptoms; SVM, support vector machine.
Meta-analytical Sequential Testing Simulations
We conducted 13 simulations in total, the details of which are reported in online supplementary figure 1. The highest PPV was achieved by sequentially using a combined model (clinical + EEG22) and 2 biological (structural MRI23 and blood markers24) models (figure 2). Specifically, PPV was estimated to be 98% for an individual with 3 positive tests, 71–82% for an individual with 2 positive complementary tests, 12%–21% for an individual with 1 positive complementary test, and 1% for an individual with no positive tests (figure 2). Accordingly, the NNT was 2 for those with 3 positive sequential tests, 3 for those with 2 positive tests, 11–18 for those with 1 positive test, and 219 for those with no positive tests (see online supplementary table 1 for results in the bounds of the CI of the risk ratio for preventive treatments). This suggests that 3-stage sequential testing can significantly impact effectiveness of preventative treatments in CHR samples. To demonstrate the worst case scenario, we additionally used the lower limit of the confidence interval, producing lower but still medium PPVs: 49% for an individual with 3 positive tests, and 24%–30% for an individual with 2 positive tests (see online supplementary figure 2). PPVs after assuming the strongest possible correlation between the tests yielded high (or medium to high) PPVs: 98% for an individual with 3 positive tests, and 55%–81% for an individual 2 positive complementary tests (see online supplementary figure 3).
PPVs were similar when the analysis was restricted to CHR individuals meeting APS criteria at baseline (high for 2 or 3 positive tests and low otherwise), but globally higher when the analysis was restricted to CHR individuals meeting BLIPS/BIPS criteria (high for 2 or 3 positive tests, still medium for 1 positive test, and low otherwise), and globally lower when the analysis was restricted to CHR individuals meeting GRD criteria (high for 3 positive tests but medium for 2 positive tests, and low otherwise) (see online supplementary table 2 and supplementary figure 4).
Discussion
To our knowledge, this is the first study to systematically review predictive models for psychosis onset in CHR and to test the theoretical clinical utility of a 3-stage sequential testing to improve psychosis prediction. Twenty-five original studies were retrieved, addressing clinical, biological, neurocognitive, environmental, or combinations of predictive models across different domains. The highest PPV across environmental predictive models was modest (63%),34 whereas the highest PPVs in clinical,27 biological,23 neurocognitive,35 and combined45 predictive models were above 82%. Thirteen 3-stage sequential testing simulations based on probabilistic risk assessment were conducted. The best model showed that probability of transition in a CHR individual was 98% if the 3 tests were positive based on 1 combined (EEG + clinical)22 and 2 biological predictive models (structural MRI and blood markers),23,24 71%–82% if only 2 tests were positive, 1%–21% with 1 positive test, and 1% with no positive sequential tests.
We focused on PPV to improve risk prediction in CHR samples. This is based on the findings of our previous work which indicated that CHR instruments have excellent prognostic accuracy to rule out true negatives, subjects who not go on to develop psychosis.4 By contrast, there is still a need to specifically improve the ability to rule in subsequent psychosis and to increase PPVs.4 We examined 25 studies encompassing different types of biological, neurocognitive, environmental, and combined predictive models. The environmental predictive models yielded modest PPVs (63% for the best model34). This may reflect a poor discriminative power that may be caused by heterogeneity in the environmental factors entered in the models. Environmental predictive models were mostly based on general factors associated with psychotic disorders such as substance abuse,31,43 urbanicity,34 unemployment,33 and social maladjustment34,38 so it is plausible that their specificity to CHR pathophysiology is relatively poor. These models were also characterized by poor methodological quality as none had employed validation analyses to confirm their findings. Conversely, the models from the other domains (clinical, neurobiological, neurocognitive, combination) with the highest PPVs had values above 82%. An additional finding is that of nonsuperiority of combined predictive models (82% for the model delivering the highest PPV45) as compared to the other models such as neurocognitive models (83% the highest PPV35). Similar findings have been observed for dementia prediction in patients with mild cognitive impairment where the accuracy of combined models (neuropsychological testing, health screening, neuroimaging, genetics, and informant or patient reports) did not significantly exceed that of more parsimonious models.49 A previous study by our group found that combining cognitive, genetic, and imaging methods did not substantially improve the discrimination between healthy controls and CHR individuals.50 Therefore, here we simulated the potential clinical utility of a 3-stage sequential probabilistic testing to refine psychosis prediction. Probabilistic testing analyses are common in other areas of preventative clinical medicine. For instance, they have been successfully applied to discriminate patients with Alzheimer’s disease from other forms of dementia.51
Because our 3-stage sequential testing analysis is not based on original data but on statistical simulations, we have restricted it only to the validated predictive models. Measures of prognostic accuracy are extremely sensitive to the design of the study and studies without validation procedures can severely overestimate the indicators of test performance. Overall, only 7 studies included in the current review have employed a rigorous prognostic accuracy approach combining appropriate predictive modeling with internal validation. Importantly, from the models with the highest PPVs, only the biological23 and neurocognitive35 but not the combined model45 underwent validation. We thus tested if PPV could be improved on top of the initial CHR baseline assessment4 by sequentially combining 3 validated predictive models in 13 different combinations (see online supplementary figure 1). Our probabilistic testing simulations identified the best theoretical model, which was based on 1 combinatory (EEG + clinical)22 and 2 biological predictive models (structural MRI36 and blood markers23,24) (figure 2). This model showed that at least 3 positive tests are required to reach a high PPV for the development of psychosis (98%) and 2 negative tests to have low probability (1%–21%). These findings provide a theoretical framework suggesting that sequential testing in CHR individuals may improve psychosis prediction by stratifying individual risk profiles. It is striking that all 3 predictive model tests that were used in the meta-analytical probabilistic assessment included biological measurements. It may be speculated that since biological predictors of psychosis map direct neurobiological processes associated with the development of the illness, they have a high PPV. The first model in our simulation includes clinical variables (premorbid functioning) together with the P300 event-related potential.22 Interesting in this context is the fact that a recent meta-analysis confirmed that event-related potentials such as the P300 or the mismatch negativity (a measure of prediction error dependent learning52) may be used as promising markers to predict the onset of psychosis.53 The second test in our simulation includes gray matter volume reductions in prefrontal cortices such as dorso- and ventromedial areas as well as the cingulate cortex, which have been widely implicated in CHR pathophysiology,23 and are known to be involved in cognitive processing.54 Impairments in cognitive performance are associated with the onset of psychosis and may be useful in predicting psychosis.55,56 Finally, our third test includes a multiplex blood assay.24 Most of the blood analytes were involved in the regulation of the hypothalamic-pituitary axis, oxidative stress and inflammation, all of which are abnormal in patients with schizophrenia.57–60 Consistent with the hypothesis that inflammation, oxidative stress, and dysregulation of hypothalamic-pituitary axes may be prominent in the earliest stages of psychosis,24 CHR subjects had elevated cortisol levels and increased hypothalamic61 and pituitary volumes.62 Overall, our findings indicate that measures of pathophysiological anomalies may complement baseline clinical assessments to stratify CHR individuals into different risk groups, which in turn may lead to personalized treatments to prevent transition to psychosis.12 In a first sensitivity-preserving step, CHR psychometric instruments could be used to rule out subjects seeking help at high-risk services but who are unlikely to develop psychosis. In a second step, additional tests of objective pathophysiological measures could be sequentially applied to the CHR group, with the aim of increasing prognostic reliability. Multicomponent sequential testing will not only decrease the risk of offering unnecessary treatment to false positives, but may also inform the treatment for people who do go on to develop psychosis. This could improve the benefits associated with early detection and early intervention, while reducing the possible costs (eg, weight gain) associated with receiving unnecessary pharmacological treatment.
Limitations and Future Directions
Our sequential testing is theoretical and not based on original data. Future original investigations should test the generalizability of our approach. Collaborative studies between international multisite CHR projects such as PRONIA (www.pronia.eu/), PSYSCAN (www.psyscan.eu/) and NAPLS3 (http://campuspress.yale.edu/napls/) are being planned and they may deliver large scale databases needed to externally validate the stepwise assessment identified by the current analysis. Another issue that may have influenced our simulation results may be the presence of affective comorbidities that can impact both psychopathology63 and neurobiology64 of a CHR sample. There were no data to test this in our review. It is also possible that duration of follow-up might affect our simulations. However, all predictive models employed have provided prognostic accuracy data in the longer period of time (baseline CHR assessment at 38 months,4 neurocognitive assessment at 48 months,35 combined assessment at 36 months,22 neuroimaging assessment at 52 months23), when most transition to psychosis would have already occurred.65 Furthermore, we did not investigate outcomes other than psychosis transition, such as functional status,66 remission,67 or treatment responses,68 which are becoming a mainstream focus of CHR research. Different sequential testing approaches are likely to be needed depending on the specific outcome to be predicted. Finally, the cost-effectiveness of having patients undergo neuroimaging testing will need to be established if there is any likelihood of integrating imaging into routine use.69
Conclusions
The use of a sequential testing approach that improves baseline clinical assessments with predictive models from different domains, especially biological data may deliver high prognostic accuracy for psychosis prediction in subjects undergoing CHR assessment. Although our findings are theoretical and must be validated on original data, such probabilistic multimodal and multistep testing might help to improve the ability of high-risk services to stratify personalized risk profiles.
Funding
This work was supported by the Swiss National Science Foundation (SNSF; No. P2ZHP3_155184 to A.S.), the Instituto de Salud Carlos III—Subdirección General de Evaluación and the European Regional Development Fund (personal grant Miguel Servet CP14/00041 and project PI14/00292 integrated into the National Plan for research, development and innovation) (J.R.) and in part by a 2014 NARSAD Young Investigator Award (P.F.P). P.F.P. was also supported by the National Institute for Health Research (NIHR), Mental Health Biomedical Research Centre at the South London and Maudsley, NHS Foundation Trust and King’s College London. The views expressed are those of the author(s) and not necessarily those of the NHS, the NIHR or the Department of Health.
Acknowledgments
The authors have declared that there are no conflicts of interest in relation to the subject of this study.
References
Author notes
*To whom correspondence should be addressed; Department of Psychosis Studies PO63, Institute of Psychiatry, Psychology and Neuroscience, King’s College London, De Crespigny Park, SE58AF London, UK; tel: +44-077-8666-6570, fax: +44-020-7848-0976, e-mail: [email protected]
