


Abstract
The Sensory Gating Inventory (SGI) is a 36-item measure used to assess an individual’s subjective ability to modulate, filter, over-include, discriminate, attend to, and tolerate sensory stimuli. Due to its theoretical and empirical link with sensory processing deficits, this measure has been used extensively in studies of psychosis and other psychopathology. The current work fills a need within the field for a briefer measure of sensory gating aberrations that maintains the original measure’s utility. For this purpose, large samples (total n = 1552) were recruited from 2 independent sites for item reduction/selection and brief measure validation, respectively. These samples reflected subgroups of individuals with a psychosis-spectrum disorder, at high risk for a psychosis-spectrum disorder, nonpsychiatric controls, and nonpsychosis psychiatric controls. Factor analyses and item-response models were used to create the SGI-Brief (SGI-B; 10 Likert-rated items), a unidimensional self-report measure that retains the original SGI’s transdiagnostic (ie, present across disorders) utility and content breadth. Findings show that the SGI-B has excellent psychometric properties (alpha = 0.92) and demonstrates external validity through strong associations with measures of psychotic symptomatology, theoretically linked measures of personality (eg, perceptual dysregulation), and modest associations with laboratory-based sensory processing tasks in the auditory and visual domains on par with the original version. Accordingly, the SGI-B will be a valuable tool for dimensional and transdiagnostic examination of sensory gating abnormalities within clinical science research, while reducing administrator and participant burden.
Introduction
The Sensory Gating Inventory (SGI) is a self-report measure that evaluates an individual’s subjective experiences of their ability to perceptually modulate and filter sensory stimuli, their tendency to over-include or over-attend to extraneous sensory stimuli, their susceptibility to distraction, and the vulnerability of their perceptual processes to fatigue and stress.1 Since its creation, the SGI has been used to assess perceptual disturbances in a variety of psychopathologies known to demonstrate deficits in both sensory gating and focal attention (ie, distractibility),2–4 including attention deficit hyperactivity disorder (ADHD),5,6 Tourette’s syndrome,7–9 and autism spectrum disorders.10,11 Notably, the majority of studies using the measure have been conducted in psychosis-spectrum disorders, as the SGI was originally developed to tap the experiential and phenomenological dimensions described by McGhie and Chapman.12
Aberrant perceptual experiences, including deficits in sensory processing and selective attention, are a characteristic feature of psychotic illness, demonstrated in seminal behavioral and physiological studies in the early 1900s.13–15 McGhie and Chapman clarified these experimental phenomena, reasoning that patients with schizophrenia exhibit (1) disturbances in perception, including heightened sensory vividness in auditory and visual domains12; and (2) deficits in selective attention and increased distractibility to irrelevant stimuli contributing to the observed inability of patients to restrict sensory intake.16 Subsequently, neurophysiological research in schizophrenia began to investigate basic cognitive processes, specifically sensory gating, as a possible mechanism underlying these clinical phenomena.17 For example, sensory gating is a key process influencing higher-order systems (domains), such as cognitive functions (eg, interference control in the process of working memory), social processing, and/or sensorimotor integration, all of which are aberrant in psychosis and related disorders. Accordingly, fundamental paradigms that can be studied at various levels of analysis and across conditions can be leveraged for dimensional approaches like the Research Domain Criteria (RDoC, cf. 18). Extending to other units of analysis, self-reported levels of these sensory abnormalities have also been investigated and are consistently observed to be elevated in individuals with psychotic spectrum disorders1,3,19–21 and intermediately elevated in relatives of individuals with schizophrenia and bipolar disorder.22 In addition, studies have shown individuals with ADHD report significantly elevated levels of these abnormalities compared to controls and even higher than individuals with schizophrenia.3,23 Although further research is needed to gain a better understanding of both common and disparate processes underlying manifestations of sensory gating across clinical populations, this phenomena, as captured by the SGI, appears to be a fruitful transdiagnostic construct to continue to examine.
Recently, attempts have been made to shorten the SGI to decrease participant burden and increase its use in laboratory as well as clinical settings as a brief screening tool. Notably, these attempts have not retained the content breadth of the original measure, limiting the construct validity and transdiagnostic utility, in addition to providing limited psychometric analysis.5,24 Given recent needs in the field for a briefer measure of aberrant sensory gating, and the well-established utility of the SGI, the current study sought to (1) investigate the dimensionality of the original SGI, specifically examining the prevalence and influence of a general factor, (2) create a reliable and briefer sensory gating measure that retains the content breadth and dimensional relevance of the original version, and (3) demonstrate the reliability and criterion validity of this brief measure using an independent sample.
Methods
All procedures were approved by the respective Institutional Review boards. Independent samples were recruited for item selection (Indiana University Bloomington sample) and item validation (University of Minnesota-Minneapolis sample). Participants were recruited via flyers and advertisements within the Greater Bloomington and Indianapolis Areas as well as the Minneapolis Veterans Affairs Healthcare System and community-based providers in the Twin Cities area, respectively. All participants provided written informed consent.
Item-Selection (Indiana University Bloomington) Sample
Full recruitment, diagnostic, inclusion, and exclusion criteria are consistent with previously published work (cf. 25). Analyses were performed on a total sample of 938 individuals that was comprised of 333 individuals with no current or past psychiatric diagnosis, 442 individuals with a formal diagnosis on the schizophrenia spectrum (ie, schizophrenia, schizoaffective disorder, or SPD), 88 individuals with subthreshold schizotypal personality disorder and relatives of individuals with psychosis (hereto forward referred to as “high risk”), and 75 individuals with a nonpsychotic psychiatric diagnosis (eg, mood, anxiety, or substance; hereto forward referred to as “psychiatric control”) (see table 1 for full demographics).
Sample Demographics
| Sex (% Female) | Age (Years, SD) | Ethnicity (% C/B/Oa) | Diagnoses (%) | |
|---|---|---|---|---|
| Bloomington (n = 938) | ||||
| CON (n = 333) | 54.3 | 37.3 (11.5) | 30.6/64.0/5.4 | — |
| PSY-C (n = 75) | 36.0 | 43.9 (10.5) | 64.0/32.0/4.0 | Anx (34.7) MDD (6.6) Alc (58.7) |
| HR (n = 88) | 55.7 | 41.2 (12.8) | 43.2/46.6/10.2 | SZRel (63.6) SubSPD (36.4) |
| PSY-P (n = 442) | 44.2 | 40.5 (11.1) | 47.1/47.1/5.8 | SZ (43.9) SZAff (12.2) SPD (16.3) BPD (27.6) |
| Statistics (F or χ 2) | 14.3 | 9.59 | 31.7 | — |
| P-value | .003 | <.001 | <.001 | — |
| Post hocb | — | PSY-C > PSY-P > CON HR > CON | — | — |
| Minneapolis (n = 613) | ||||
| CON (n = 136) | 48.5 | 44.49 (12.6) | 58.0/5.1/37.5 | — |
| HR (n = 176) | 63.4 | 41.33 (12.4) | 53.4/6.2/40.4 | SZRel (55.2) BPRel (44.8) |
| PSY-P (n = 302) | 36.5 | 41.67 (12.3) | 48.8/9.6/39.6 | SZ (46.4) SZAff (18.2) BPD (35.4) |
| Statistics (F or χ 2) | 31.9 | 3.48 | 19.6 | — |
| P-value | <.001 | .03 | .14n.s. | — |
| Post hocb | — | CON > PSY-P CON > HR | — | — |
Note: Italic text indicates a significant difference between groups. Alc, alcohol use disorder; Anx, primary anxiety disorder; B, black; BPD, bipolar disorder; BPRel, first-degree relatives of patients with bipolar disorder; C, Caucasian; CON, nonpsychiatric controls; HR, psychosis high risk; MDD, major depressive disorder; n.s., not significant; O, Other; PSY-C, psychiatric controls; PSY-P, psychosis spectrum; SPD, schizotypal personality disorder; Spectrum, schizophrenia spectrum; SZ, schizophrenia; SZAff, schizoaffective disorder; SZRel, first-degree relative of patients with schizophrenia.
aOther indicates mixed race, Asian, Hispanic, and Native Americans (Native Americans are prominent in the Minneapolis sample).
bOnly significant (P < .05) post hoc comparisons are reported.
Validation (University of Minnesota-Minneapolis) Sample
Stable outpatients with schizophrenia or bipolar disorder, per criteria from the Diagnostic and Statistical Manual of Mental Disorders (DSM)-IV-TR,26 and their first-degree biological relatives as well as nonpsychiatric control participants were recruited. Clinical groups were assessed using the Diagnostic Interview for Genetic Studies (DIGS27), Scale for the Assessment of Negative Symptoms (SANS28), Scale for the Assessment of Positive Symptoms (SAPS29), and the 24-item version of the Brief Psychiatric Rating Scale (BPRS30) to confirm and characterize diagnoses. Nonpsychiatric groups were evaluated with the Structured Clinical Interview for DSM-IV (SCID-I31). Exclusion criteria included a history of illicit drug dependence, but not alcohol dependence unless alcohol was consumed in the prior month. In addition, nonpsychiatric controls were excluded if they presented with a personal or family history of psychosis or affective disorder. Analyses were performed on a total sample of 614 individuals comprised of 136 nonpsychiatric control, 302 schizophrenia spectrum, and 176 high-risk participants (table 1).
Sensory Gating Inventory
All participants completed the SGI, a 36-item paper and pencil self-report measure that asks participants to rate their perceptual experiences, spanning constructs of perceptual modulation (PM), over-inclusion (OI), distractibility (DI), and vulnerability to fatigue and stress (FS).1 Items capture multiple sensory domains (eg, auditory, visual) and attributes (eg, timing, volume/magnitude/severity, number, resolution). Participants rate these experiences on a 6-point Likert scale ranging from “never true” (0) to “always true” (5). Valid responses were the selection of a single, discrete rating per item, with a rating of 1 through 5 indicating endorsement of some degree of the experience.
Personality Measures
Personality Inventory for DSM-5
Participants in the validation sample completed the Personality Inventory for DSM-5 (PID-532), a 220-item self-report measure, as part of a larger research protocol.33 Participants responded on a scale of 0 (very false or often false) to 3 (very true or often true). The items form 5 personality trait domains (Negative Affect, Detachment, Antagonism, Disinhibition, and Psychoticism) superordinate to 25 personality trait facets. Trait domains were calculated such that each facet contributed to a domain estimate, in accordance with empirically derived factors.32 Partial raw scores were prorated for missing data. Thirteen subjects (2.8%) had 1 or 2 missing items, 2 subjects had 6 missing items (>1%), and 1 subject had 7 missing items (>1%). Five subjects were missing 33 items, and were excluded, leaving a total of 457 subjects with available PID-5 data.
Sensory Processing Tasks
Degraded Stimulus-Continuous Performance Task
Participants in the validation sample completed the Degraded Stimulus-Continuous Performance Task (DS-CPT; Continuous Performance Test Program for IBM-Compatible Microcomputers, Version 7.10; cf. 34, 35). Briefly, task stimuli and background were degraded—40% of white numeral pixels were switched to black, and 40% of black background pixels switched to white. Following a practice block, subjects received DS-CPT instructions and completed 3 experimental blocks wherein 25% of stimuli were targets (“0”) with the remainder as nontargets (numerals “1” to “9”). For practice and experimental blocks, participants were told to respond only when they saw targets.
Dichotic Listening Task
The validation cohort also completed the Dichotic Listening Task, described previously,36 which consisted of 200 trials across 4 blocks (800 trials total). Headphones were used to present 96 decibel (dB) tone pips against 55 dB background white noise. The pips alternated between ears. For each block, participants were instructed to identify the pip with the highest frequency in the attended ear only (ie, target), with a single button press using the right thumb as quickly as possible. Participants were instructed to attend to tone pips in the left ear for blocks 1 and 4 and the right ear for blocks 2 and 3. The pips consisted of 4 different pitches and were pseudo-randomized such that 10% were infrequent tones delivered to the attended ear (targets) and 10% were infrequent tones delivered to the unattended ear (unattended deviants). The remaining 80% of the pips were a half-octave lower than the corresponding infrequent pips (channel 1: 2400 Hz infrequent and 1600 Hz frequent; channel 2: 1200 Hz infrequent and 800 Hz frequent).
Statistical Analysis
R version 3.6.137 was used for these analyses including the “missForest” package for data imputation,38 “lavaan” package for confirmatory factor analysis (CFA),39,40 “psych” package for exploratory factor analysis (EFA),41 “polycor” package for calculating tetrachoric correlations for EFA,42 “mirt” package for item-response theory analysis,43 and “ggplot” package for data visualization and figure generation.44
Exploratory and Confirmatory Factor Analyses
In the training sample, a unidimensional model of the SGI was compared with the 4-factor correlated model from the original SGI study using CFA.1 CFA was conducted using the weighted least squares mean and variance adjusted estimator (WLSMV in “lavaan” package), which is the estimator commonly used for categorical data.45 Fit indices selected to evaluate CFA and EFA models included root mean squared error of approximation (RMSEA), Tucker–Lewis Index (TLI), and the chi-square test statistic (mean/variance adjusted, cf. 40). Adequate model fit is reflected in a RMSEA <0.08 and TLI >0.94.46,47 Traditionally, the field viewed an adequate model as including a nonsignificant chi-square; however, recent studies have indicated that multiple statistics be considered together given that this criteria is not realistic in larger samples, which may have a significant chi-square in models with very good fit based on other indices.45
Additionally, the loading patterns and variance explained by factors was examined using an EFA with bifactor rotation and tetrachoric correlations.48 EFA with a bifactor rotation allows for a closer examination of the prominence of the general factor in the SGI by partitioning variance into a general factor and specific orthogonal factors.48 This provides for a useful comparison with the presented CFA models and an intuitive method to quantify the saturation of the general factor in the SGI.
Item Reduction and Item-Response Theory
Reduction of the SGI was completed with the consideration of 3 goals for the brief version: (1) high internal consistency,49 (2) preservation of the content breadth of the original SGI,50 and (3) drastically reduce administration time. A unidimensional graded response model aided in item evaluation and, subsequently, reduction. Graded response models provide a discrimination parameter, analogous to a factor loading, that indicates the strength of the relationship between the item and the latent dimension.51 In addition, the model provides threshold parameters (ie, ability or severity) that indicate the latent severity level at which a participant is expected to transition between response patterns. Given that the SGI uses a 0–5 Likert scale, there are 6 response options and therefore 5 thresholds. The SGI was reduced by choosing items that highly discriminate across severity levels (ie, threshold values). Of these highly discriminating items, careful attention was paid to select items that cover the breadth of content in the original SGI (eg, the 4 constructs, perceptual domains, and attributes). Items were selected to replicate a similar proportion of items from each subscale as in the full SGI.
Validation Measures
The resulting briefer version of the SGI (SGI-Brief, or SGI-B) was validated by correlating SGI-B total scores with selected PID-5 measures and sensory tasks: DS-CPT and Dichotic Listening Task. Eight subscales of the PID-5 were selected to cover a wide range of personality constructs. The perceptual dysregulation, psychoticism, and unusual beliefs subscales were selected to provide convergent validity on the relationship between sensory gating abnormalities and personality traits commonly associated with perceptual psychotic spectrum disorders. Distractibility, anxiousness, and disinhibition subscales were selected to examine the association between the SGI-B and other highly relevant personality constructs that, theoretically, are linked to perceptual aberrations and psychotic spectrum disorders. Finally, attention-seeking and rigid perfectionism subscales were selected to provide evidence of divergent validity in that it is assumed the SGI-B should be less robustly related to these constructs.
For the sensory measures, DS-CPT and Dichotic Listening, variables of interest included the standard signal detection index, d-prime or d′, the rate of hits, and the rate of false alarms. These measures were computed for each subject in each task (Supplementary table 1).
Results
Confirmatory Factor Analysis
As expected, the unidimensional model showed below adequate fit (χ 2(594) = 6351.86, TLI = 0.91, RMSEA = 0.10) and the 4-factor correlated model fit the data adequately (χ 2(587) = 3917.59, P < .001, TLI = 0.94, RMSEA = 0.08) (see Supplementary table 2 for factor loadings and Supplementary table 3 for correlations between latent factors in the correlated factor model). Importantly, the correlation between all factors was ≥0.75 and ≥0.85 between the PM factor and all other factors. All items were robust indicators of the unidimensional latent factor as well as their corresponding correlated factors in each model, respectively (Supplementary table 2).
Exploratory Factor Analysis
The bifactor EFA fit the data adequately or below adequately per the selected fit statistics (χ 2(492) = 2120.23, P < .001, TLI = 0.91, RMSEA = 0.06; see Supplementary table 4 for factor loadings). Most importantly, all items were robust indicators of the general factor, which accounted for 47% of the total variance. The 3 remaining specific factors each account for 5% or less (Supplementary table 4). Together, the CFA and EFA results point to the SGI as being heavily saturated with a general factor that serves as the primary influence of item responses across subscales. Furthermore, there is very limited subscale-specific variance. Taken together, it appears the SGI is best conceptualized as measuring a single multifaceted construct, which lead to the creation of the unidimensional SGI-B.
SGI-B Item Selection and Group Means
The SGI-B (figure 1) is composed of 10 total items: 4 PM, 2 DI, 2 OI, and 2 FS subscale items. All items selected were highly discriminating, but with varied threshold values and content (table 2). The SGI-B showed excellent reliability with a Cronbach’s alpha of 0.92, as did the full measure (alpha 0.97). Although there is a modest reduction in reliability, the lower alpha value is likely more desirable as very high alpha values can be indicative of redundant items and suggest that the measure should be shortened.52
IRT Parameters
| Item # | a | b1 | b2 | b3 | b4 | b5 | Item |
|---|---|---|---|---|---|---|---|
| 4 | 0.92 | −1.96 | −0.75 | 0.53 | 2.01 | 3.16 | The silliest little things that are going on interest me |
| 23 | 1.32 | −1.88 | −0.87 | −0.05 | 0.71 | 1.69 | I seem to always notice when automatic appliances turn on and off (like the refrigerator or the heating & cooling system) |
| 15 | 0.95 | −1.43 | −0.58 | 0.32 | 1.31 | 2.34 | When I am driving at night, I am bothered by the bright lights of oncoming traffic |
| 13 | 1.89 | −1.36 | −0.44 | 0.41 | 1.17 | 1.88 | I am easily distracted |
| 16 | 2.11 | −1.27 | −0.4 | 0.29 | 1.02 | 1.74 | It is hard to keep my mind on one thing when there’s so much else going on |
| 3 | 1.62 | −1.22 | −0.36 | 0.42 | 1.34 | 2.14 | I find it hard to concentrate on just one thing |
| 25 | 1.43 | −1.19 | −0.37 | 0.4 | 1.2 | 2.08 | When I am tired, the brightness of lights bothers me |
| 21 | 1.59 | −1.1 | −0.38 | 0.34 | 1.27 | 1.93 | Not only the color of things fascinates me but all sorts of little things, like markings in the surface, attract my attention, too |
| 28 | 2.18 | −1 | −0.2 | 0.44 | 1.22 | 1.89 | At times I have trouble focusing because I am easily distracted |
| 30a | 1.88 | −0.98 | −0.12 | 0.57 | 1.39 | 2.26 | I cannot focus on visual images when I am tired or stressed |
| 6a | 1.81 | −0.94 | −0.12 | 0.58 | 1.39 | 2.28 | There are times when I can’t concentrate with even the slightest sounds going on |
| 34 | 1.81 | −0.84 | −0.15 | 0.52 | 1.21 | 2.07 | I seem to hear the smallest details of sound |
| 17a | 2.09 | −0.79 | 0.08 | 0.64 | 1.4 | 2.15 | When I am in a group of people I have trouble listening to one person |
| 14 | 2.25 | −0.76 | −0.1 | 0.42 | 1.08 | 1.83 | It seems like I take in too much |
| 32a | 2.12 | −0.76 | −0.09 | 0.54 | 1.23 | 2.08 | Maybe it’s because I notice so much more about things that I find myself looking at them for a longer time |
| 9 | 1.82 | −0.76 | −0.09 | 0.47 | 1.14 | 1.95 | I notice background noises more than other people |
| 1 | 1.29 | −0.75 | 0.09 | 0.94 | 2.28 | 2.84 | Every now and then colors seem more vivid to me than usual |
| 22 | 2.73 | −0.75 | 0 | 0.59 | 1.16 | 1.85 | I find it difficult to shut out background noise and that makes it difficult for me to concentrate |
| 20 | 2.24 | −0.74 | −0.13 | 0.52 | 1.36 | 2.03 | Sometimes I notice background noises more than usual |
| 36 | 2.22 | −0.63 | −0.1 | 0.4 | 0.95 | 1.68 | It seems that sounds are more intense when I’m stressed |
| 31 | 2.3 | −0.58 | 0.13 | 0.66 | 1.24 | 1.98 | I have more trouble concentrating than others seem to have |
| 2 | 1.62 | −0.57 | 0.26 | 0.92 | 1.97 | 2.92 | Sometimes I find it difficult to focus on one visual sight to the exclusion of others |
| 33a | 2.09 | −0.56 | 0.21 | 0.78 | 1.35 | 2.22 | Everything grips my attention even though I am not particularly interested in any of it. |
| 35a | 2.18 | −0.52 | 0.1 | 0.66 | 1.28 | 1.97 | When I’m tired sounds seem amplified |
| 19 | 2.02 | −0.45 | 0.29 | 0.87 | 1.44 | 2.11 | It’s not bad when just one person is speaking but if others join in, then I can’t pick it up at all. I just can’t get into tune with that conversation |
| 27 | 2.57 | −0.38 | 0.34 | 0.93 | 1.57 | 2.18 | I can’t focus on one sound or voice to the exclusion of others |
| 29a | 2.98 | −0.32 | 0.28 | 0.8 | 1.44 | 1.95 | Background noises are just as loud or louder than the main noises |
| 8 | 1.61 | −0.27 | 0.44 | 0.92 | 1.87 | 2.54 | There are days when indoor lights seem so bright that they bother my eyes |
| 7 | 2.62 | −0.22 | 0.31 | 0.77 | 1.52 | 2.22 | Sometimes it seems like someone has turned the volume up—things seem really loud |
| 26a | 3.08 | −0.14 | 0.46 | 0.91 | 1.57 | 2.09 | There have been times when it seems that sounds and sights are coming in too fast |
| 10 | 2.52 | −0.13 | 0.53 | 0.98 | 1.68 | 2.19 | I hear sounds but I can’t make sense of them all because it’s like trying to do sgi_2 or 3 things at once |
| 5 | 2.24 | −0.08 | 0.55 | 0.96 | 1.65 | 2.42 | At times I have feelings of being flooded by sounds |
| 12 | 2.73 | 0 | 0.54 | 0.96 | 1.6 | 2.15 | It seems like I hear everything at once |
| 24a | 2.32 | 0.07 | 0.75 | 1.21 | 1.92 | 2.46 | I have feelings of being flooded by visual experiences, sights, or colors |
| 18 | 2.43 | 0.15 | 0.79 | 1.24 | 1.85 | 2.38 | My hearing is so sensitive that ordinary sounds become uncomfortable |
| 11a | 2.77 | 0.18 | 0.69 | 1.1 | 1.67 | 2.07 | For several days at a time I have such heightened awareness of sights and sounds that I cannot shut them out |
Note: a, item discrimination; b, thresholds. Thresholds indicate the expected trait level where the individual is expected to endorse the next response category (eg, b1 is threshold between the first and second response category). The table is organized based on the first threshold value from low to high.
aBolded items were selected for the brief measure.
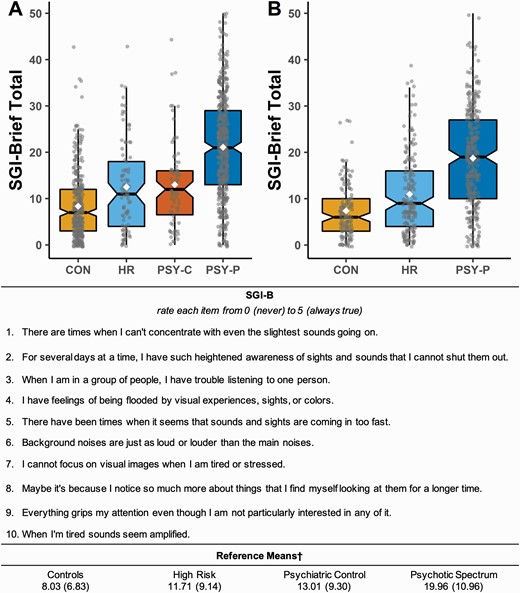
Upper panel depicts SGI-Brief (SGI-B) total group means for the (A) Bloomington sample and (B) Minneapolis sample. Black lines through the boxplot indicate the median of the distribution, while the white diamonds indicate the mean. Middle panel provides the SGI-B in its entirety, including rating scale and instructions. Lower panel provides reference means for ease of use for the diagnostic groups of interest. Groups included nonpsychiatric controls (CON), psychosis “high risk” (HR), psychiatric controls (PSY-C), and psychosis spectrum (PSY-P) as defined in the main text. †Means are based on the combined sample. Printable measure with scoring instructions and reference means available as a supplement.
Reliability coefficients can be used to get a rough estimate of the likely impact of validity of the item reduction (cf. 50). Consult equation 1 (from 53), where r(sc) is the estimate correlation of the short-form measure and an external criterion, r(fc) is the correlation of the long-form and the external criterion, sα is the reliability of the short form, and fα is the reliability of the full form. Accordingly, if the original SGI correlates with an external criterion of r = 0.50, the SGI-B is expected to have a correlation of 0.47 (see equation 2).
In addition, based on the literature using the original SGI, the SGI-B exhibited expected group difference in each sample (figures 1A and 1B). Namely, nonpsychiatric controls had the lowest endorsement of items on the SGI-B and the schizophrenia-spectrum group exhibited the highest endorsement. High-risk and psychiatric controls had an intermediate endorsement rate.
External Validation
The items selected for the SGI-B also showed excellent reliability in the validation sample (alpha = 0.92), as did the full measure (alpha = 0.97). The SGI-B showed strong convergent validity with personality traits associated with psychotic spectrum disorders such as perceptual dysregulation, psychoticism, and unusual beliefs (table 3) and was robustly related with other theoretically relevant personality traits, including distractibility, anxiousness, and disinhibition. The SGI-B, as expected was only modestly associated with attention-seeking showing good divergent validity. Surprisingly, the SGI-B was moderately correlated with rigid perfectionism, this may be because sensory gating problems appear robustly related to internalizing personality constructs (eg, anxiousness), albeit not as strongly as personality constructs associated with thought disorders (eg, unusual beliefs). In addition, scores on the SGI-B had a moderate, positive correlation with symptom-based measures including general (BPRS), negative (SANS), and positive (SAPS) symptomatology (table 4). SGI-B scores were also modestly correlated with sensory task performance, including a negative correlation with d′ and a positive correlation with the false alarm rates on DS-CPT, as well as a negative correlation with hit rates on Dichotic Listening.
Correlation of Brief SGI Score With Selected PID-5 Subscales
| Scale | 1 | 2 | 3 | 4 | 5 | 6 | 7 | 8 | 9 | 10 |
|---|---|---|---|---|---|---|---|---|---|---|
| 1. Brief SGI | 1 | — | — | — | — | — | — | — | — | — |
| 2. SGI-36 | 0.97 | 1 | — | — | — | — | — | — | — | — |
| 3. Perceptual Dysregulation | 0.66 | 0.66 | 1 | — | — | — | — | — | — | — |
| 4. Psychoticism | 0.66 | 0.66 | 0.91 | 1 | — | — | — | — | — | — |
| 5. Unusual Beliefs & Experiences | 0.58 | 0.59 | 0.80 | 0.92 | 1 | — | — | — | — | — |
| 6. Disinhibition | 0.46 | 0.47 | 0.6 | 0.59 | 0.47 | 1 | — | — | — | — |
| 7. Anxiousness | 0.5 | 0.53 | 0.61 | 0.6 | 0.49 | 0.33 | 1 | — | — | — |
| 8. Distractibility | 0.64 | 0.68 | 0.71 | 0.7 | 0.58 | 0.7 | 0.63 | 1 | — | — |
| 9. Attention Seeking | 0.18 | 0.18 | 0.30 | 0.38 | 0.3 | 0.47 | 0.17 | 0.29 | 1 | — |
| 10. Rigid Perfectionism | 0.47 | 0.49 | 0.53 | 0.53 | 0.45 | 0.08n.s. | 0.51 | 0.44 | 0.23 | 1 |
Note: PID-5, Personality Inventory for DSM-5; SGI, Sensory Gating Inventory. n.s., not significant, all other correlations significant at P < .001.
Correlation of Brief and Original SGI Score With Selected Measures and Tasks
| n | SGI-B | SGI-36 | |
|---|---|---|---|
| Psychotic symptoms measures | |||
| BPRS total score | 613 | 0.39** | 0.40** |
| SAPS global negative | 458 | 0.39** | 0.37* |
| SANS global positive | 461 | 0.44** | 0.44** |
| DS-CPT task indices | |||
| d′ | 420 | −0.14** | −0.12* |
| False alarm rate | 420 | 0.16** | 0.12* |
| Hit rate | 420 | −0.06n.s. | −0.06.n.s. |
| Dichotic listening task indices | |||
| d′ | 169 | −0.22* | −0.21* |
| False alarm rate | 169 | 0.17* | 0.14n.s. |
| Hit rate | 169 | −0.19* | −0.18* |
Note: BPRS, Brief Psychiatric Rating Scale; DS-CPT, Degraded Stimulus-Continuous Performance Task; SANS, Scale for the Assessment of Negative Symptoms; SAPS, Scale for the Assessment of Positive Symptoms; SGI, Sensory Gating Inventory; SGI-B, SGI-Brief.
*P < .05, **P < .01, n.s., not significant.
Discussion
The current study fills a need within the field for a briefer measure of self-reported sensory gating aberrations that are central to the phenomenology of psychotic disorders and evident in other forms of psychopathology. Using a data-driven approach, the findings indicated that the original SGI is best modeled as reflecting a single multifaceted construct. Accordingly, a briefer, unidimensional version of the measure was created, consistent with the underlying empirical structure of the SGI; as results indicated, there was quite limited subscale-specific variance. Past efforts have shortened the SGI by selecting items that had face-valid associations to a construct of interest, such as ADHD5; such an approach, along with significant psychometric concerns, does not adequately maintain the content of the original transdiagnostic construct as assessed in the original SGI. This limits the validity and utility of the measure to assess the construct in diverse diagnostic samples. In the current study, items were selected not only for the most desirable psychometric properties, but also to proportionally sample from the breadth of content of the original SGI.50 This creates confidence in the ability of the SGI-B to capture the construct assessed in the original SGI across diagnostic categories.
In fact, both samples reflected a clear spectrum of self-reported sensory gating deficits in the SGI-B, with nonpsychiatric controls endorsing the least aberrations, high-risk individuals exhibiting an intermediate response rate, and psychosis-spectrum groups endorsing the highest levels of gating difficulties (figure 1). This pattern of gating difficulty is consistent with the literature21 and, along with external validity analyses, underscores the important theoretical relationship between sensory gating and psychosis-spectrum disorders. Interestingly, the intermediate response rate of relatives and subthreshold individuals (ie, “high risk” group) is consistent with McGhie and Chapman’s original discussion of the possible importance of these phenomena in understanding less chronic and severe manifestations of psychosis.15 Importantly, SGI-B scores were also higher than controls in nonpsychosis psychiatric controls and were robustly related to a diverse group of maladaptive personality traits (eg, anxiousness and disinhibition). This stresses the importance of conceptualizing sensory gating abnormalities as transdiagnostic processes that span broadly across forms of psychopathology. Future work may seek to elucidate the common and/or disparate processes that underlie sensory gating abnormalities across diagnoses, such as endorsing aberrations in certain sensory systems (eg, vision, sight) or processing features (eg, discrimination, flooding, etc.) (cf. 54). Accordingly, the current study provides clinical means to contextualize performance on the SGI-B (figure 1), but importantly the study did not design the measure to serve as a diagnostic screener for any specific diagnosis.
While the briefer format resulted in a modest loss of variance (equation 2), the SGI-B allows for a significant reduction in administration time. Assuming it takes an individual 30 s per question, the SGI-B takes ~5 min to be administered compared to ~18 min for the original SGI.50 Within a large research assessment battery or fast-paced clinical setting, reduction of participant/patient burden is of the utmost importance, especially when assessing clinical populations. We believe the drastic decrease in administration time will make the inclusion of a sensory gating measure much more feasible for both researchers and clinicians. Importantly, given the psychometrically rigorous item-selection process, this time reduction comes at very little cost to the administrator as the SGI-B appears to reflect essentially no loss in external validity, including personality, symptoms and task performance (tables 3 and 4).
The presented work should be considered in light of its limitations. Construction and validation of the SGI-B primarily involved assessment of individuals on the psychosis spectrum given the preponderance of literature on sensory processing deficits in this population (eg, 21). Importantly, it is likely that the diagnostic makeup of the sample used influenced which items were ultimately selected (ie, the most discriminating). This is an important consideration more broadly in the development of transdiagnostic measures, as it is not feasible to collect a completely diagnostically representative sample for the creation of every measure. Therefore, in the future, it will be critical to validate the SGI-B across a broader spectrum of psychopathology. This would require not only the examination of mean differences, but also differences in item structure (eg, differential ordering of items by severity) and endorsement patterns across and within diagnostic groups (cf. 55). However, the intentional sampling across the breadth of content of the original SGI should mitigate these concerns. Furthermore, the current sample had a wide range of impairment, allowing the measure to be calibrated for large severity ranges. Lastly, the SGI-B should provide researchers an efficient means to assess self-reported sensory abnormalities in pursuit of understanding links to more fine-grained dimensional features (eg, sensory domains, frequency, etc.) within and across clinical disorders such as attention, stress, and/or vigilance for which there is work already done with the SGI (eg, ADHD, Tourette’s syndrome, panic disorder).5,6,9 Given the extensive research on sensory gating deficits in psychopathology, future work may benefit from establishing task, personality, demographic, or neural features related to self-endorsement of these deficits on the SGI-B. Moreover, while correlations with tasks in the current work provide further evidence of convergent validity of the SGI-B to capture meaningful sensory gating abnormalities, these correlations were modest. This may reflect an important difference between the self-report construct of sensory gating issues, which includes diverse phenomenology, and perhaps more fundamental sensory process disturbances captured in task performance.
Taken together, the SGI-B provides the field a brief measure of self-reported sensory gating abnormalities that shows both excellent psychometric properties and demonstrates external validity. Results provide strong confidence in the ability of the SGI-B to capture the multifaceted construct of the original SGI that has shown important theoretical and empirical associations with psychotic spectrum disorders and other forms of psychopathology. We believe the creation of this brief measure provides a valuable tool for dimensional and transdiagnostic examination of sensory gating abnormalities within clinical science research.
Funding
This work was supported by the National Institute of Mental Health (T32 MH103213 to W.P.H., A.J.B., and A.B.M.; U01 MH108150 and R01 MH112583 to S.R.S.; R01 MH074983 and R21 MH118617 to W.P.H.), the National Institute on Drug Abuse (T32 DA024628 to A.J.B. and T32 DA050560 to S.D.K.), the Mental Health Patient Service Line at the Minneapolis VA Health Care System (S.R.S.), the Veterans Health Administration Clinical Science Research and Development Program (Merit Review #2I01CX000227 to S.R.S.), and Indiana Clinical and Translational Sciences Institute (TL1 TR001107 and UL1 TR001108 to A.B.M.). The content of this article does not represent the views of the U.S. Department of Veterans Affairs or the United States Government.
Acknowledgments
We wish to thank the patients and their families for participation in this study as well as the support of the staff and administration of Larue D. Carter Memorial Hospital (Indianapolis, IN) and the Minneapolis VA (Minneapolis, MN).
Conflict of Interest
The authors have declared that there are no conflicts of interest in relation to the subject of this study.
