


Abstract
Functional magnetic resonance imaging was used to evaluate the neural basis of framing effects. We tested the reflexive and reflective systems model of social cognition as it relates to framing. We also examined the relationships among frame susceptibility, intelligence and personality measures. Participants evaluated whether personal attributes applied to themselves from multiple perspectives and in positive and negative frames. Participants rated whether each statement was descriptive or not and endorsed positive frames more than negative frames. Individual differences on frame decisions enabled us to form high and low frame susceptibility groups. Endorsement of frame-consistent attributes was associated with personality factors, cognitive reflection and intelligence. Reflexive brain regions were associated with positive frames while reflective areas were associated with negative frames. Region of Interest analyses showed that frame-inconsistent responses were associated with increased activation within reflective cognitive control regions including the left dorsolateral prefrontal cortex (PFC), dorsomedial PFC and left ventrolateral PFC. Frame-consistent responses were associated with increased activation in the right orbitofrontal cortex. These results demonstrate that individual differences in frame susceptibility influence personal attribute evaluations. Overall, this study clarifies the neural correlates of the reflective and reflexive systems of social cognition as applied to decisions about social attributions.
INTRODUCTION
Framing effects refer to ‘discrepancies between choice problems that decision-makers, upon reflection, consider effectively identical’ (Kahneman, 2003). For example in Tversky and Kahneman’s (1981) famous Asian Disease Problem two versions of the same problem are presented. In a (‘lives saved’ version outcomes are described in terms of the number of lives that could be saved based on decisions, while a ‘lives lost’ version describes the number of lives that will be lost. In the ‘lives saved’ version, people favor the option assuring a specific number of lives saved. In contrast, people favor the riskier option (i.e. taking a chance to avoiding a sure loss) in the ‘lives lost’ version. This response bias reflects the strong impact of contextual frames on decisions. These effects are prevalent across the population, but individuals also vary in susceptibility to framing (Stanovich and West, 2000; DeMartino et al., 2006). Framing effects are both intriguing and important as they represent cases in which people decide differently toward logically equivalent descriptions of the same situation. Framing effects appear in high stakes domains including medicine, consumer behavior and education (Levin et al., 1998).
Attribute framing is another variation of a decision task that elicits framing effects (Levin et al., 1998). The aforementioned Asian Disease Problem represents risky-choice framing, as frames are presented in terms of gains and losses resulting in risk-related choices. Attribute framing describes the tendency to endorse choices described in terms of a positive attribute and to reject choices that are described in terms of a negative attribute. It is somewhat simpler compared to risky-choice paradigms, as decisions are dependent on the valence of attributes of interest rather than hypothetical outcomes. For example Levin et al. (1998) describe a scenario in which beef is positively framed as being 75% lean or negatively framed as being 25% fat. Participants reliably preferred the positively framed item. The reliability and relative simplicity of attribute framing is advantageous for neuroscience studies.
Framing effects may reflect the contributions of distinct processing systems acting in competition or in cooperation with each other, termed dual-process models (Stanovich and West, 2000; Kahneman and Frederick, 2002; Evans, 2008). Dual-process models separate reflexive, emotionally-driven processing and rational, logically-driven processing (Epstein, 1994; Sloman, 1996; Salas-Auvert and Felgoise, 2003; Lieberman, 2007). A social cognitive dual-process model was proposed that takes into account different neural systems that support the two processing modalities, termed the X- and C-Systems (Lieberman et al., 2002; Satpute and Lieberman, 2006; Lieberman, 2007). The Reflexive, or X-system provides quick associative responses, often based on valence. In contrast, the Reflective, or C-system provides cognitive control overriding the X-system when reflexive responses are contextually inappropriate. We sought to test this model using a social attribute framing paradigm.
Different brain regions are proposed to support the two systems. X-system areas including the amygdala, basal ganglia, lateral temporal cortex (LTC), ventromedial prefrontal cortex (VMPFC) and the dorsal anterior cingulate cortex (dACC) predominate during automatic information processing. The dACC, has been considered to be part of the X-system due to its involvement in non-symbolic tension processes (Eisenberger and Lieberman, 2004). In the current study, we consider the anterior cingulate cortex (ACC) to act primarily as a C-system component due to its role in cognitive control (Botvinik et al., 1999, 2001; Botvinick, 2007). C-system structures including the ACC, lateral prefrontal cortex (LPFC), posterior parietal cortex (PPC), hippocampus and medial temporal lobes (MTL) and the medial prefrontal cortex (MPFC) support controlled processing associated with conflict detection and memory (Lieberman et al., 2002; Satpute and Lieberman, 2006; Lieberman, 2007). Several studies have examined the neural effects of context on judgments (Deppe et al., 2005; Mobbs et al., 2006; Deppe et al., 2007) including risky-choice framing (Gonzalez et al., 2005; De Martino et al., 2006; Roiser et al., 2009; Talmi et al., 2010; Zheng et al., 2010). While two of these studies (De Martino et al., 2006; Roiser et al., 2009) reported amygdala activation associated with frame consistent responding, Talmi et al. (2010) reported intact framing effects in individuals with amygdala lesions. When individuals resist the framing manipulation, activation has been reported in areas including the DLPFC, ACC, right insula, right inferior frontal cortex and parietal cortex (Gonzalez et al., 2005; De Martino et al., 2006; Zheng et al., 2010). The ventromedial prefrontal cortex (VMPFC), orbitofrontal cortex (OFC) and ACC have been reported to mediate susceptibility to framing (De Martino et al., 2006).
Individuals vary in their susceptibility to framing. According to dual-process models, susceptibility to framing is due to a predisposition toward one type of processing (LeBoeuf and Shafir, 2003). Constructs hypothesized to influence frame susceptibility include need for cognition (Cacioppo et al., 1984), exposure to statistical thinking (Agnoli and Krantz, 1989), personality (Eisenberger et al., 2005; Levin et al., 2002) and intelligence (Stanovich and West, 2000). Reliance on different processing types can be impacted by priming, cognitive load and mood (Bless et al., 1996; Eisenberg 2000; Ferreira, et al., 2006; Satpute and Lieberman, 2006). We hypothesized that differential neural activation in X- and C-system areas would contribute to framing susceptibility.
In the current functional Magnetic Resonance Imaging (fMRI) study, we investigate X and C-system involvement in attribute framing in which participants are asked to evaluate personality traits. The traits were presented from a direct perspective (e.g. I believe I am honest) and from reflected perspectives (e.g. my best friend believes I am honest, or people in general believe I am honest). The perspective taking manipulation was included to maximize C-system involvement based on prior studies reporting MPFC activity, a C-System structure, associated with social attribution judgments from differing perspectives (Fossati et al., 2003; Ochsner et al., 2005; Mitchell et al., 2006; D’Argembeau et al., 2007; Schmitz and Johnson, 2007). We also investigate individual differences on cognitive and personality dimensions for their potential impact on frame susceptibility.
We hypothesized that positively framed items would be endorsed more than negatively framed items. We also predicted that frame-consistent responding (e.g. endorsing a positively framed item ‘I am honest’ or rejecting a negatively framed item ‘I am not honest’) would be associated with activation of X-System structures, specifically the amygdala, basal ganglia and OFC, as these areas support valence-based responses, which dominate when frames are endorsed. Conversely, we predicted that frame-inconsistent responding would be associated C-System activation, specifically within the DLPFC, VLPFC, ACC and MPFC. Increased activation within C-system areas and longer response times should be associated with frame-inconsistent responses (e.g. rejecting a positively framed item ‘I am honest’ or endorsing a negatively framed item ‘I am not honest’), as increased cognitive control is likely to be needed to override quick, valence-based frame-consistent responses. Lastly, we hypothesized that reflected perspective trials should show a reduced framing effect relative to self-directed trials.
METHOD
Participants
Twenty-one adults (10 females) between the ages of 19 and 41 years (M = 28.79) were recruited. We excluded two participants for medical reasons. One participant completed five of the eight experimental runs. All participants provided informed consent. Participants were compensated at a rate of 20 dollars per hour. Participants completed a questionnaire that identified gender, ethnicity, race, age, years of education and native language. This experiment was approved by the Institutional Review Boards of UT Dallas and UT Southwestern and performed in accordance with the ethical standards of the 1964 Declaration of Helsinki.
Procedure
Participants were administered the Wechsler Test of Adult Reading (WTAR) (Wechsler, 2001) and completed self-report questionnaires including the Need For Cognition scale (NFC) (Cacioppo et al., 1984), the Eysenck Personality Questionnaire Revised–Short form (EPQR-S) (Eysenck and Eysenck, 1994; Sato, 2005), the Experiences in Close Relationships scale (ECR) (Fraley et al., 2000) and the Cognitive Reflection Test (CRT) (Frederick, 2005).
The MRI task required participants to rate personality characteristics as either descriptive or not. Stimuli consisted of statements about the percentage of time that positive attributes are present or absent. We selected the 40 most positively rated attributes from Anderson (1968). Positively framed items described the percentage of time that a trait was present. Values ranged from 51% to 90%. Negatively framed items described the percentage of time that a trait was absent. Values ranged from 10% to 49%. Positively and negatively framed versions of each trait appeared in the task. For example, a trial required participants to respond to the statement ‘I am loyal at least 75% of the time’. Later in the experiment this same item appeared negatively framed as ‘I am not loyal at most 25% of the time’. The experiment was run using E-Prime software (Psychology Software Tools, Pittsburgh, PA, USA) (Schnieder et al., 2002) with stimuli presented via an MRI compatible display. After completing all pretest measures, participants completed an instructional program that provided practice trials from each condition and discussed restricting movement throughout the MRI procedure.
Participants evaluated attributes from their perspective (‘self condition’), the perspective of their best friend (‘best friend condition’) or the perspective of people in general (‘people in general condition’). We included a control condition during which participants simply reported whether the percentage value in a given problem was > or <50%. Figure 1 illustrates example trials from these experimental conditions.
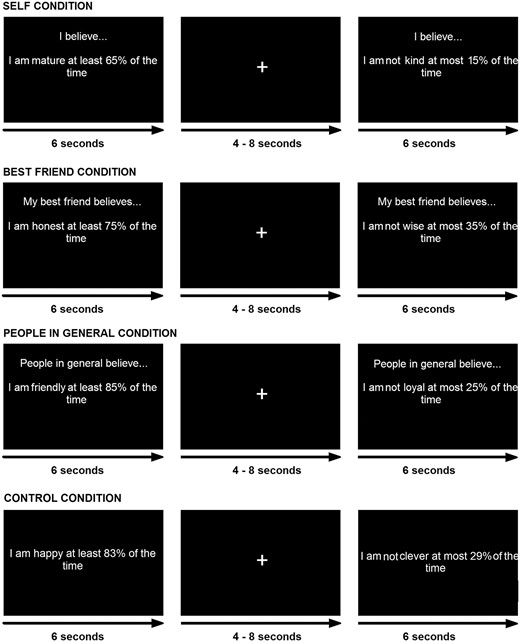
The attribute framing task as presented in the scanner. Participants indicated their judgment about whether the statement was descriptive or not at any point within the 6-s time window for each trial. Jittered ITI ranged from 4 to 8 s. Self condition judgments required evaluation of oneself. Best friend judgments required a reflected judgment about what one’s best friend thinks of the participant. People in general judgments were also a reflected decision about how people in general think of the participant. For control trials participants were asked to judge whether the percentage shown in the item was > or <50%.
The event-related task included eight blocks of 40 trials equally divided among the four conditions within each block. Condition order was counterbalanced across the blocks. An inter-trial interval (ITI) of 4–8 s (M = 6 s) was included. Participants were allowed 6 s to respond to each item after it first appeared. Responses were recorded using keypads in each hand, with the left button corresponding to descriptive/greater than 50% responses and the right button corresponding to not descriptive/less than 50% responses.
fMRI acquisition and data analyses
T2*-weighted echo planar images (EPI) sensitive BOLD contrasts were acquired with a Philips 3T scanner using a 1-shot gradient echo-EPI sequence optimized to maximize ventral brain coverage while maintaining signal in dorsal areas; Repetition Time (TR) = 1.5 s, Echo Time (TE) = 25 ms, flip angle = 60°. Axial slices (3 mm + 0.5 mm gap) were obtained providing whole-brain coverage (Weiskopf et al., 2007). MP-RAGE 3D T1-weighted anatomical scans were also acquired.
Images were reconstructed with distortion correction to reduce magnetic field inhomogeneities. Data were motion corrected with two iterations of a six-parameter, rigid body realignment and the time series of each voxel was normalized by its mean signal value to reduce between-run scaling differences. Data analyses were performed in MATLAB using Statistical Parametric Mapping 5 software (Wellcome Department of Imaging Neuroscience at www.fil.ion.ucl.ac.uk/spm/). Whole-brain analyses were initially conducted to evaluate specific task contrasts. The task minus control contrast was used to identify functionally defined regions of interest (ROIs) for subsequent analyses (Supplementary Materials).
The experiment was a 2 × 4× 2 factorial design. The first factor represented frame condition (positive frame, negative frame). The second represented perspective condition (self, best friend, people in general, control). The third represented behavioral decisions on a trial-by-trial basis during the task (Descriptive/Greater than 50% option, Not Descriptive/Less than 50% option). For whole-brain image analysis, several contrasts were examined to identify regions involved in the task. These included task minus control, positive frame minus negative frame, negative frame minus positive frame, frame consistent minus frame inconsistent, frame inconsistent minus frame consistent, direct minus reflected appraisals and reflected minus direct appraisals.
For whole-brain analyses, voxel-wise analysis was performed using a general linear model (GLM) for autocorrelated observations. Included within the model is an empirical estimate of intrinsic temporal autocorrelation, global signal change covariates and sine and cosine regressors for frequencies below that of the task. Participant-specific regressors of interest were assembled by convolving δ functions (corresponding to the trial onsets) with the SPM5 canonical hemodynamic response function used to model blood oxygen level-dependent (BOLD) responses to trial events. A t-statistic was generated for each voxel, and a subsequent map (an SPM) was displayed. Linear contrasts were used to test the relative activation associated with conditions of interest. SPM t-maps were calculated for the relative contrasts. Resulting contrast maps reflected differences in activation between the conditions at each voxel. Significant voxels met both a brain-wide P < 0.001, uncorrected threshold and a minimum familywise error-corrected cluster size threshold computed using the SPM data structure for each relevant contrast map (requiring minimum cluster sizes ranging from 69 to 88 contiguous voxels). ROI methods are described in Supplementary Materials.
RESULTS
Attribute framing performance
We tested for a main effect of attribute framing using a two-tailed, paired-samples t-test. The mean proportion of descriptive responses for positively framed items (M = 0.93, SD = 0.07) was significantly greater than for negatively framed items (M = 0.47, SD = 0.35), t(18) = 5.27, P < 0.001. Figure 2A depicts this attribute framing effect showing the mean proportion of descriptive responses for the positively and negatively framed conditions.
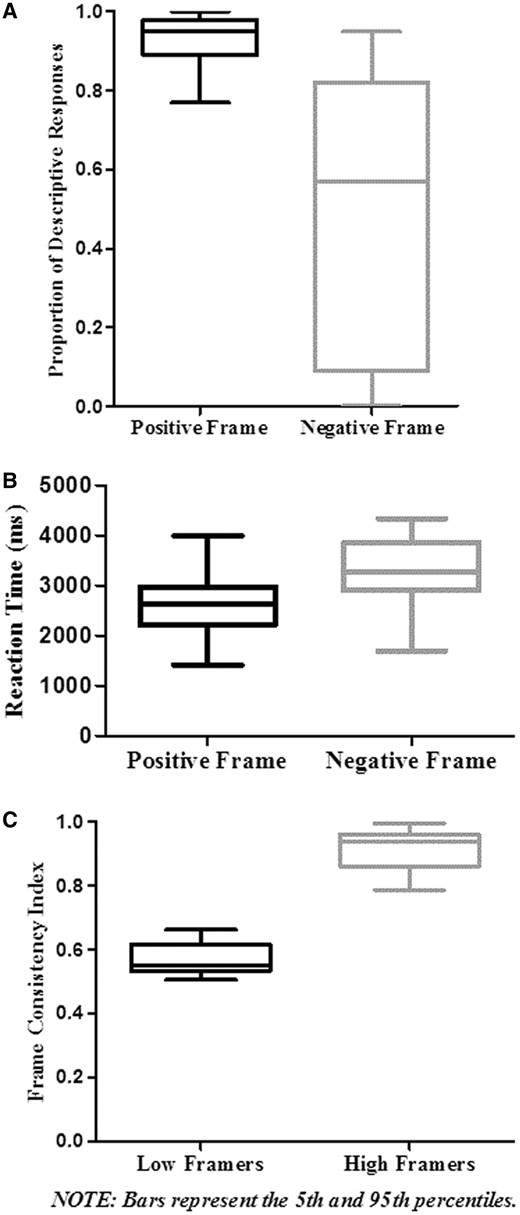
(A) We found an attribute framing effect in which participants endorsed positively framed items more than negatively framed items despite their logical equivalence (collapsed across perspective condition). (B) Participants evaluated positively framed items faster than positively framed items (rejecting them as not descriptive more often). (C) The high framing individuals showed a greater tendency to respond with-frame than the low framing individuals.
We employed a two-tailed paired-samples t-test to test for differences in average RT between the frame conditions. We eliminated responses with an RT two standard deviations below the group average (M = 2994.86, SD = 1089.17) prior to the RT analysis. Trials below this cut-off of 817 ms were excluded from further analyses (n = 13, 0.3%). An additional total of 92 trials (2.1%) were excluded due to absent responses. Mean RT results indicated that the positive frame condition (M = 2658.55, SD = 559.01) was significantly faster than the negative condition (M = 3344.40, SD = 653.08), t(18) = −8.59, P < 0.001 (Figure 2B).
Individual differences in attribute framing
We computed a Frame Consistency Index (FCI) to represent participants’ overall frame susceptibility. FCI is the proportion of trials for which a participant responded frame-consistently (e.g. choosing descriptive in a positive frame or not descriptive in a negative frame). The mean FCI score was 0.64 (range between 0.51 and 1) with a bimodal distribution.
Participants were divided into groups due to the bimodal FCI distribution. We selected an FCI value of 0.75 as a division point. Ten participants had FCI scores <0.75 (Low Framing group) and nine had scores >0.75 (High Framing group). An independent-samples t-test revealed that the Low Framing group (M = 0.57, SD = 0.05) was significantly lower in mean FCI than the High Framing group [M = 0.91, SD = 0.07, t(17) = −12.55, P < 0.001] (Figure 2C). Table 1 includes the mean FCI for both groups.
Descriptive statistics for demographic, pretest and performance based variables.
| Variable | Low Frame Group (n = 10) | High Frame Group (n = 9) | Total (n = 19) |
|---|---|---|---|
| Age | 27.5 (6.27) | 30.22 (8.83) | 28.79 (7.50) |
| Years of Education | 15.90 (2.47) | 13.75 (1.58) | 14.94 (2.34) |
| WTAR | 119.30 (7.32) | 108.22 (7.65) | 114.05 (9.22) |
| CRT | 1.44 (1.13) | 0 (0) | 0.72 (1.07) |
| NFC | 72.50 (9.63) | 66.78 (4.38) | 69.79 (7.97) |
| EPQR-P | −0.43 (0.95) | −0.16 (1.11) | −0.30 (1.01) |
| EPQR-E | −0.26 (1.01) | 0.77 (0.55) | 0.25 (0.95) |
| EPQR-N | −0.76 (0.78) | −0.60 (0.87) | −0.68 (0.81) |
| EPQR-L | −0.18 (0.68) | 0.47 (1.00) | 0.15 (0.89) |
| AR-Anx | 2.51 (1.14) | 2.26 (0.72) | 2.39 (0.95) |
| AR-Avo | 2.91 (0.98) | 2.56 (0.86) | 2.75 (0.91) |
| FCI | 0.56 (0.05) | 0.91 (0.07) | 0.73 (0.19) |
| FAI | −0.01 (0.02) | 0.01 (0.03) | −0.00 (0.03) |
Note. WTAR values represent standard scores. EPQR-S values represent z scores. All other variables are reported as raw scores. Values represent means with standard deviations in parenthesis.
We computed a Frame Adaptation Index (FAI) measuring adaptation to the framing effect over time. It represents the proportion of frame-consistent responses for each block of trials. These values were plotted in a regression analysis and the linear slope was extracted to represent framing adaptation. The mean FAI value for the sample was −0.0002 with a range of −0.03 to 0.08. Sample means and standard deviations for the FAI are included in Table 1. The distribution of FAI scores was not bimodal.
We further analyzed the experimental manipulations (perspective, task block and trial percentage range) and their influence on framing separately for the High and Low Framing groups due to the significant FCI differences. Proportion of frame-consistent responding for each condition was used as the dependent variable in a series of one-way repeated-measures ANOVAs for each group. This variable reduces behavioral responses into two categories, frame consistent and frame inconsistent, enabling a direct investigation of these variables on frame consistent responding.
We conducted ANOVAs to test for the effect of perspective, experimental block, and percentage ranges on proportion of frame consistent responding in each condition. The analyses for perspective and experimental block showed no significant differences, P > 0.05. No effect of percentage ranges on frame-consistent responding was observed for the High Framing group, but results indicated that Low Framing participants responded with-frame less often for percentage ranges 2 (21–30%; 70–79%) and 3 (31–40%; 60–69%), middle range values, than for percentage range 1 (11–20%; 80–89%) in which scores fell further out toward the extremes of the percentage scale F(3, 7) = 8.58, P < 0.01. A Holm’s sequential Bonferroni procedure was used to control for family-wise error rate across the six post-hoc comparisons at the P < 0.05 level.
We computed Spearman correlation coefficients relating the measures of personality and cognition to the FCI and FAI variables to assess how individual differences may contribute to framing susceptibility and adaptation over time. Significant correlations were identified between FCI and EPQR–L scores, r(16) = 0.556, P < 0.05, and between FCI and WTAR scores, r(17) = −0.478, P < 0.05. For the FAI, a positive correlation was observed with EPQR–E scores, r(16) = 0.535, P < 0.05. We examined the relationship of the CRT with the FCI and FAI using one-way ANOVAs due to the limited score range on the CRT (zero through three). For FCI values, a significant effect of CRT performance was observed, F(3, 14) = 6.07, P < 0.01, indicating that higher CRT individuals responded with-frame less often. The ANOVA for the FAI was not significant, F(3, 14) = 0.80, P = 0.514.
Functional MRI results
Whole-brain comparisons
For the contrast of all experimental task trials vs control trials, significant activation was observed in the bilateral posterior DMPFC proximal to the supplementary motor area (SMA) (x, y, z = −8, 18, 64), the left anterior DMPFC (−6, 48, 38), left VLPFC (−46, 16, 12), left DLPFC (−44, 14, 36), right middle cingulate cortex (MCC) (12, 22, 40), left MTL (−48, −38, 0), along with portions of the visual cortex and cerebellum. This contrast was also used for defining ROIs (Supplementary Materials).
To evaluate the framing manipulation, overall group contrasts were examined to investigate activation associated with each frame condition (positive frame minus negative frame and negative frame minus positive frame). Different patterns of activation were observed between frame types. In the positive minus negative frame contrast, significant activation was observed in the bilateral ACC (0, 18, −10), orbitomedial prefrontal cortex (OMPFC; −2, 48, −10) (Figure 3A) and left angular gyrus (−44, −78, 30). The reverse contrast (negative minus positive frame) revealed significant activation in the bilateral insula (right: 32, 28, 4; left: −32, 18, 2), left VLPFC (−56, 12, 24), right VLPFC/DLPFC (50, 16, 30), left posterior DMPFC/SMA (−8, 8, 54), bilateral portions of the parietal lobe (left: −34, −44, 36; right: 42, −42, 40), cerebellum (0,−68, −30) and right precuneus (28, −66, 36). Rendered images are presented in Figure 3B. To summarize, significant activation was dominated by X-system regions for positively framed items and dominated by C-system regions for negatively framed items, consistent with greater reflective cognitive control accompanying processing negative frames.
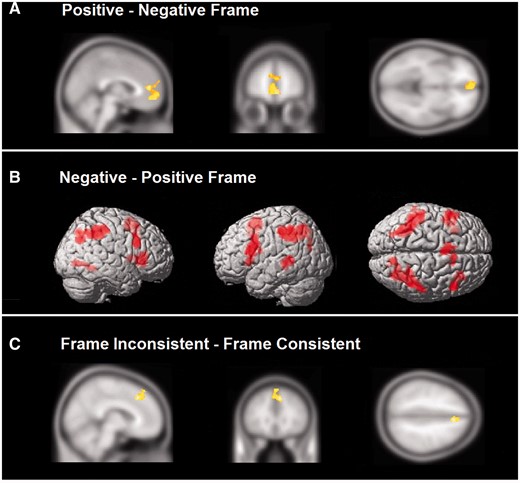
(A) Shown at the overall group level are regions involved in evaluating positively framed items over negatively framed items. This contrast resulted in a majority of regions that have been associated with reflexive processing. (B) The reverse contrast of negatively framed minus positively framed items elicited greater activation within reflective processing regions in lateral prefrontal and parietal cortex among other areas. (C) Region of the ACC associated with frame inconsistent responses and reflective processing.
Next we examined the frame inconsistent minus frame consistent and frame consistent minus frame inconsistent comparisons. The frame inconsistent minus frame consistent contrast showed significant activation in the bilateral posterior DMPFC/SMA (8, 28, 42) extending into the dorsal ACC (0, 26, 22). These results indicate that greater reflective cognitive control was present for trials in which participants decided against frame (Figure 3C). There were no significant differences for frame consistent minus frame inconsistent responding.
Comparisons of direct and reflected appraisals are described in the Supplementary Results along with ROI results.
DISCUSSION
We demonstrated a significant framing effect for social evaluations of oneself from multiple perspectives. Participants endorsed positively framed over negatively framed items across the three perspective conditions. Positively framed items were also endorsed faster than negatively framed items. These two patterns of results indicate that people tend to rapidly endorse desirable personal attributes when they are positively framed and are less willing to endorse equivalent descriptions when they are negatively framed. These results are consistent with the literature on attribute framing (Levin et al., 1998) and this robust attribute framing effect has high potential for use in future neuroscience studies.
The reaction time results indicate that counterframes are not necessarily processed in the same manner, despite intuitive notions regarding the equivalence of frames (Mandel and Vartanian, 2011). A previous argument that frames and counterframes may not be equivalent is based on the ambiguity of the wording of traditional risky-choice framing problems such as the Asian Disease Problem (Tversky and Kahneman, 1981). For example, to say that ‘200 people will be saved’ does not communicate whether this is a minimum or maximum value. Conversely, the response options in the current study did not include this ambiguity because we used the qualifiers ‘at least’ and ‘at most’. Response time differences between frames suggest that the perception and information processing associated with attribute frames differ at a deeper level.
Individual differences
Our sample could be split into significantly different groups based on framing susceptibility. High framing individuals tended to respond frame consistently, endorsing positively framed items and rejecting negatively framed items. In contrast, low framing participants were more rational in their responding and were less influenced by the framing manipulation. At the extremes, high framing individuals showed FCI levels close to 1, indicating almost complete guidance by frame type, while low framing participants approached 0.5, indicating a more balanced response pattern and frame resistance. Low framing participants responded with frame less often for middle percentage range items, over more extreme ranges indicating that highly desirable numbers (e.g. honest at least 89% of the time) and highly aversive numbers (e.g. not honest at most 11% of the time) had a higher influence in this group. This finding suggests that some individuals resist attribute framing much of the time, except with statements that involve extreme percentages of positive or negative attribute levels. Personality, intelligence and cognitive style all appear relevant to determining one’s susceptibility to framing.
Personality factors contributed significantly to framing susceptibility and adaptation to framing over time. The EPQ-R L subscale, measuring an individual’s tendency to deny common faults and flaws, was positively correlated with FCI, indicating that people who attempt to present themselves in an overly favorable light are more likely to endorse personality attributes consistent with frame. This relationship may be driven by socially desirable response biases. We also found a relationship between the EPQ-R E subscale (extraversion) with FAI in which individuals responding highly to social interest showed increases in resistance to framing over the course of the experiment. Such individuals appeared to catch on quicker that the items were equivalent despite the positive or negative framing, consistent with reports on exposure to counter-framed items (Kühberger, 1998). Another previous study linked extraversion with greater efficiency in reflective processes (Eisenberger et al., 2005). Adaptation to framing may also be influenced by cognitive factors.
Higher intelligence and cognitive style were found to influence frame susceptibility. Intelligence, as estimated by the WTAR, was related to more resistance to the framing effect (lower FCI) and higher CRT performance was found to be correlated with lower susceptibility to the framing effect. This suggests that intellectually rigorous individuals are led by attribute framing less often. It is important to note that our sample scored relatively high on the WTAR for their demographic range, so in the broader population there may be a greater number of people who are led by attribute frames. Prior studies have also reported individuals with higher CRT scores show more resilience against heuristics and biases including risky-choice framing (Cokely and Kelley, 2009; Toplak et al., 2011). We extend these results to attribute framing and support previous studies indicating that the CRT is an effective screening tool to identify individuals with a diminished susceptibility to framing (Toplak et al., 2011). This finding is also consistent with other literature linking higher intellectual functioning to higher efficiency in controlled processing (Evans, 2008).
We did not find a significant perspective taking effect and this did not significantly influence FCI. This is somewhat surprising, as we hypothesized that reflecting about oneself from different perspectives would produce a diminished amount of frame consistent responding. The failure to find a perspective effect stands in contrast to prior data from our laboratory (Murch, 2009) and is difficult to explain given the lack of relevant studies examining such a context effect. One possible explanation relates to the statistical power of the analyses employed. Dividing the sample into two groups reduced our statistical power.
Neural regions involved in attribute framing
The fMRI results support dissociations between reflective and reflexive responding that are differentially linked to attribute framing. The overall task minus control comparison revealed a set of areas commonly observed in decision making and social cognition. We observed activation in PFC (posterior DMPFC, left anterior DMPFC, left VLPFC and left DLPFC) regions previously associated with cognitive control and reflective processing (Ochsner et al., 2004; Badre et al., 2009; Dixon and Christoff, 2012; Krawczyk, 2012). Additionally, we observed activation of the MCC, which has been associated with social cognitive decisions (Chiu et al., 2008) and the left MTL, which has been linked to long term and working memory (Eldridge et al., 2000; Niki and Luo, 2002; Jenkins and Ranganath, 2010; Rugg et al., 2012).
The contrast between positively and negatively framed items revealed differentially active reflexive regions. The positively framed items were more commonly endorsed as descriptive and led to quicker average responding over negatively framed items, consistent with reflexive processing. Activation associated with positively framed items also suggested a greater emphasis on reflexive processing. Active regions associated with positive frames included the angular gyrus and the OMPFC. Notably the OMPFC has previously been linked to risky-choice financial decision making (Bechara et al., 1997, 2000) and performing social evaluations (Behrens et al., 2008; Zaki et al., in press). This area is also considered part of the X-system, associated with fast, automatic responses. The presence of ACC activation in this condition suggests a role for this area in the X-system, though it has also been implicated in cognitive control in prior studies (Botvinick et al., 1999, 2001). It has been associated with the X-system previously in social cognition (Lieberman, 2007).
We observed predominantly reflective processing regions supporting responses to negatively framed over positively framed items, consistent with their longer response time. Negative frames activated the bilateral insula, a region commonly reported in association with negative affect (Harris and Fiske, 2006; Krendl et al., 2006) and disgust (Phillips et al., 1997; Wicker et al., 2003; Jabbi and Keysers, 2008). Negatively framed items in our task may have evoked an aversive emotional reaction as they required responses toward a socially undesirable statement about oneself. We also observed regions associated with negative framed items including the right VLPFC/DLPFC, left posterior DMPFC, bilateral parietal lobe, cerebellum, all of which are areas associated with aspects of reflective cognitive control (Lieberman, 2007). Activation in reflective brain regions would likely have been involved in the greater tendency to reject attribute statements when they are framed negatively. Lastly, we observed right precuneus activation toward negative frames. The precuneus has been previously associated with processing attributes from the perspective of oneself and others (Ochsner et al., 2005; D’Argembeau et al., 2007; McAdams and Krawczyk, in press).
We found neural evidence that greater reflective cognitive control was exerted on trials in which participants decided against frame. Several of the areas associated with cognitive control, the bilateral posterior DMPFC, left anterior DMPFC, ACC and VLPFC, were more active for frame inconsistent over frame consistent responses. On these trials, participants were able to avoid being led by frame, which would likely involve C-system areas. Unlike prior studies of framing (DeMartino et al., 2006), which have reported DLPFC activation associated with deciding against risky frames, we found a more ventral PFC region along with the ACC, often associated with processing conflict (Botvinick et al., 2001, Botvinick, 2007). This difference may be due to the greater social emphasis of our study.
CONCLUSIONS
We demonstrated that attribute framing elicits different behavioral and neural results when comparing positively framed to negatively framed personal attributes. Participants rapidly endorsed positive positively framed attributes as descriptive of themselves and engaged brain regions associated with reflexive processing, particularly the VMPFC. Conversely, participants took longer to process negatively framed attribute statements, frequently rejecting them as not descriptive of themselves. Activation of reflective control regions (MPFC, left DLPFC, left VLPFC) was observed in association with negatively framed items. Our participants showed individual differences in frame susceptibility and this was related to personality traits including desirability and extraversion along with intelligence and tendency toward cognitive reflection. Consistent with dual-processing models, individuals more susceptible to framing showed greater activation within reflective PFC regions when they decided against-frame. Additionally, the OMPFC, associated with reflexive processing, was more active when participants chose with-frame (refer to Supplementary Data). Our results clarify the cognitive and neural roots of reflexive and reflective processing associated with attribute framing.
The results of this study are relevant to other aspects of social and potentially clinical psychology. Individuals are prone to judge themselves more positively, which may be adaptive for mental health like other cognitive illusions (Alloy and Abramson, 1982). The ability to examine one’s own behavior and social attributes logically; however, appears to vary based on both intelligence and personality factors, as well as activation within certain brain regions. Similar brain areas are also relevant to disorders of self-perception such as anorexia (McAdams and Krawczyk, in press). The ability to maintain a positive perception of oneself, while also being able to assess oneself honestly is important in social cognition and our results indicate that people have a blind spot for self-assessment when the valence of their description varies. We also suggest that some individuals are more resilient than others toward this blind spot.
Conflict of Interest
None declared.
We thank Michelle McClelland for assistance with data analysis, Matt Chansard for technical assistance in design and implementation, as well as Monty Evans, Mujeeb Shad, Linda Hynan and Wendy Ringe for their valuable insights.
Funding for this research was provided by internal funds from The University of Texas at Dallas.
