


Abstract
Alexithymia has been characterized as an impaired ability of emotion processing and regulation. The definition of alexithymia does not include a social component. However, there is some evidence that social cognition may be compromised in individuals with alexithymia. Hence, emotional impairments associated with alexithymia may extend to socially relevant information. Here, we recorded electrophysiological responses of individuals meeting the clinically relevant cutoff for alexithymia (ALEX; n = 24) and individuals without alexithymia (NonALEX; n = 23) while they viewed affective scenes that varied on the dimensions of sociality and emotional valence during a rapid serial visual presentation task. We found that ALEX exhibited lower accuracy and larger N2 than NonALEX in the perception of social negative scenes. Source reconstruction revealed that the group difference in N2 was localized at the dorsal anterior cingulate cortex. Irrespective of emotional valence, ALEX showed stronger alpha power than NonALEX in social but not non-social conditions. Our findings support the hypothesis of social processing being selectively affected by alexithymia, especially for stimuli with negative valence. Electrophysiological evidence suggests altered deployment of attentional resources in the perception of social-specific emotional information in alexithymia. This work sheds light on the neuropsychopathology of alexithymia and alexithymia-related disorders.
Introduction
Alexithymia is a subclinical personality trait characterized by an impaired ability to identify, describe and regulate one’s feelings (Luminet et al., 2018). Accounting for 10% in the general population (Honkalampi et al., 2001), alexithymia is thought to be a transdiagnostic risk factor for various psychiatric disorders. This holds for depression and anxiety (Hendryx et al., 1991; Li et al., 2015), substance abuse disorders (Cruise and Becerra, 2018), posttraumatic stress disorder (Frewen et al., 2006), somatic symptom disorders (Cerutti et al., 2020), eating disorders (Marsero et al., 2011) and psychotic disorders (Van der Velde et al., 2015), amongst others. Substantial evidence has demonstrated that difficulties in emotion processing are at the core of alexithymia (Lane et al., 2000; Swart et al., 2009; Van der Velde et al., 2013). Meta-analysis of emotion processing studies has identified key neural correlates of alexithymia in the anterior cingulate cortex, the amygdala, the insula and the prefrontal cortex (Van der Velde et al., 2013). Specifically, individuals with alexithymia show deficits in the implicit processing of emotional stimuli, especially those with negative valence (for a review, see Donges and Suslow, 2017).
In addition to deficits in emotion perception, individuals with alexithymia also show impairments in social cognition and functioning, such as less altruistic behaviors (FeldmanHall et al., 2013), abnormal anticipation of social rewards (Goerlich et al., 2017), reduced physiological activations to moral decision (Cecchetto et al., 2018) and poor interpersonal relationships (Spitzer et al., 2005; Grynberg et al., 2010). Higher levels of alexithymia have also been observed in people with autism spectrum disorders (Bird and Cook, 2013), with alexithymia predicting poor emotion recognition from faces (Cook et al., 2013). A previous meta-analysis of the structural neuroanatomical changes in alexithymia has also suggested deficits in ‘social brain’ structures such as the insula, amygdala and orbitofrontal cortex (Xu et al., 2018). Recently, a new framework of the self to other model of empathy has been proposed to understand abnormal social behaviors in alexithymia, contending that the impairment of the affective representation system results in abnormal social behaviors (Bird and Viding, 2014). For example, alexithymia has been observed to be associated with reduced responses of the dorsal anterior cingulate cortex (dACC) to social rejection in the Cyberball game, indicating that individuals with alexithymia may fail to benefit from emotional signals to adapt their behaviors in social contexts (Chester et al., 2015). These findings beg the question whether impairments of emotion perception in alexithymia are social-specific.
Previous studies have shown that social-specific abilities, of importance for navigation of our social environment, were impaired in individuals with alexithymia (for mirror neuron system, see Moriguchi et al., 2009; for action imitation, see Sowden et al., 2016; for empathy, see Geoffrey Bird et al., 2010; Moriguchi et al., 2007; and for theory of mind, see Moriguchi et al., 2006), suggesting specific impairments of self-to-other neural circuits. Notably, social-specific impairments of empathic reactions in people with alexithymia point to the relevance of the socio-emotion dimension (Moriguchi et al., 2007; Bird et al., 2010).
Although studies of facial expressions consistently show abnormal emotion processing in alexithymia (for a meta-analysis, see Van der Velde et al., 2013), there is also evidence in support of intact emotion processing in alexithymia, especially for processing non-facial stimuli (Lundh and Simonsson-Sarnecki, 2002; Silani et al., 2008; Walker et al., 2011). For instance, no significant correlation with alexithymia was observed for emotion-related event-related potentials (ERPs) when attending to negative scenes (Walker et al., 2011). Although scenes used in Walker et al. (2011) consisted of both scenes with people and scenes without people, their study was not focused on social/non-social emotional stimuli processing. Sociality may be a potential moderator contributing to these discrepancies. Specifically, scenes depicting people are classified as social stimuli, whereas scenes without people are regarded as nonsocial stimuli (Britton et al., 2006; Powers et al., 2013). Accurate perception of socially relevant information such as facial affect, body posture, etc., especially regarding negative cues signaling anger and threat, is a crucial ability promoting survival (Baumeister and Leary, 1995). Given the evidence from neuroimaging for the involvement of brain structures considered to belong to the ‘social brain’ in alexithymia, we hypothesized that social-specific emotion perception, especially for negative emotion, is selectively impaired in alexithymia.
A body of evidence suggests that attention plays an important role in implicit emotion processing (Hodsoll et al., 2011) as well as in social processing (Gardner et al., 2000). The attention-appraisal model of alexithymia suggests that individuals with alexithymia have a low ability to focus attention on emotional information [conceptualized as externally orientated thinking (EOT)], especially when rapid processing is required (Preece et al., 2017). Indeed, excessive demands of attention resource allocation to emotional events have been observed in individuals with alexithymia (Franz et al., 2004; Pollatos and Gramann, 2011; Donges and Suslow, 2017). Electroencephalogram (EEG) is a sensitive technique to capture the neural basis underlying automatic attention processes (Luo et al., 2010; Zhang et al., 2014). The frontal-central N2, generated by the dACC, is positively correlated with cognitive demands that are employed to decode emotional information (Folstein and Van Petten, 2007; Nittono et al., 2007). In addition to phase-locked ERPs, the non-phase-locked posterior alpha-band power is considered crucial for the deployment of attention (Michels et al., 2008; Min et al., 2013), with stronger alpha power reflecting more recruitment of neural resources (Ciesielski et al., 2007; Segrave et al., 2012). Taken together, the N2 and alpha oscillations can be used to examine neurophysiological processes underlying socio-emotion.
The aim of the current study was to test the processing of social-specific emotion perception and the underlying neural signatures in alexithymia. We hypothesized that alexithymia is associated with social-specific deficits of emotion perception, which may be more pronounced for information of negative valence than for positive valence. Given excessive attentional demands to emotional stimuli in alexithymia (Franz et al., 2004; Pollatos and Gramann, 2011; Donges and Suslow, 2017), we predicted that individuals with high alexithymia would perform worse than those low in alexithymia. At the electrophysiological level, we expected larger N2 amplitudes and stronger alpha power in individuals with high vs. low alexithymia in the social negative condition.
Methods and materials
Participants
Fifty healthy adults from a pool of 549 students at Shenzhen University participated in the experiment while recording EEG. Each participant in the pool completed the Chinese version of the 20-item Toronto Alexithymia Scale (TAS-20; Bagby et al., 1994; Zhu et al., 2007). In light of the international cutoff to assess clinically relevant alexithymia based on TAS-20 scores (Taylor et al., 1988), individuals with TAS-20 scores higher or equal to 61 (14.21% of the pool) were identified as individuals with alexithymia (ALEX), while those with TAS-20 scores lower or equal to 51 (54.10% of the pool) were classified as individuals without alexithymia (NonALEX). The randomly selected 50 right-handed students from each of the two groups had normal or corrected-to-normal vision and no history of neurological and psychiatric disorders or head injury. After excluding three participants (intolerant to EEG cap; tired; bad signal-to-noise ratio), the final sample consisted of 47 participants (28 females; age = 20.91 ± 1.95, mean ± s.d.; Table 1 for group-specific information). This study was approved by the Ethics Committee of Shenzhen University, and informed written consent was obtained from each participant.
Demographics and questionnaire scores of participants
| ALEX (24; 15 females) | NonALEX (23; 13 females) | t | P | |||
|---|---|---|---|---|---|---|
| Mean (s.d.) | [min, max] | Mean (s.d.) | [min, max] | |||
| Age | 20.67 (1.63) | [19, 24] | 21.13 (2.20) | [19, 26] | −0.82 | 0.415 |
| TAS-20 | 65.92 (4.33) | [61, 76] | 36.35 (4.15) | [29, 43] | 23.87 | <0.001 |
| DIF | 23.08 (2.76) | [18, 30] | 11.09 (2.50) | [7, 16] | 15.57 | <0.001 |
| DDF | 18.54 (1.91) | [15, 23] | 8.61 (2.04) | [5, 13] | 17.24 | <0.001 |
| EOT | 24.29 (2.42) | [19, 30] | 16.35 (3.05) | [12, 23] | 17.24 | <0.001 |
| SAS | 45.25 (8.48) | [30, 63] | 36.57 (5.29) | [30, 51] | 4.19 | <0.001 |
| SDS | 36.08 (6.79) | [24, 50] | 29.26 (4.30) | [24, 41] | 4.10 | <0.001 |
ALEX, individuals with alexithymia; NonALEX, individuals without alexithymia; TAS-20, 20-item Toronto Alexithymia Scale; DIF, difficulty identifying feelings; DDF, difficulty describing feelings; EOT, externally oriented thinking; SAS, self-rating anxiety scale; SDS, self-rating depression scale.
Self-report questionnaires
The TAS-20 measures three facets of alexithymia: (i) difficulty identifying feelings (DIF; seven items); (ii) difficulty describing feelings (DDF; five items) and (iii) externally oriented thinking (EOT; eight items). Based on self-report, each item is rated on a 5-point Likert scale ranging from 1 (‘strongly disagree’) to 5 (‘strongly agree’), with five items being negatively scored. For analysis, the negatively keyed items are reverted, and item scores for each respective dimension are summed up. The total score is calculated as the sum of all items. High scores represent high levels of alexithymia (Bagby et al., 1994). Importantly, the Chinese version of the TAS-20 has been established with acceptable reliability and validity (Zhu et al., 2007). To control for potential confounding effects of depression and anxiety, participants also completed the self-report depression scale (SDS; Zung, 1965) and the self-report anxiety scale (SAS; Zung, 1971).
Statistical power
The sample size of the current study was determined based on a medium effect size by G*power (version: 3.1; Faul et al., 2007). Twenty-three participants per group were needed to detect a reliable effect [Cohen’s f = 0.25, α = 0.05, 1 − β = 0.8, repeated measures analysis of variance (ANOVA), within-between interaction; Faul et al., 2007]. In line with previous findings (Hendryx et al., 1991; Li et al., 2015), significant correlations of TAS-20 with SAS (r = 0.488, P = 0.001) and SDS (r = 0.479, P = 0.001) were found in the current study. It has been recommended that controlling for anxiety and depression is of importance and necessary to better understand neural correlates of alexithymia (for reviews, see Van der Velde et al., 2013; Goerlich, 2018). To control for the effects of anxiety and depression on alexithymia, we therefore performed repeated-measures analyses of covariance (ANCOVAs) with SAS and SDS scores as covariates in the next analysis. Please note that even the final sample size in this study (n = 47) was close to the sample sizes of previous studies on emotional processing in alexithymia, which controlled for affective factors and showed strong effects (n = 50; Cohen’s d = 0.56/1.20; Heinzel et al., 2010; Delle-Vigne et al., 2014).
Picture stimuli
Materials consisted of 3 upright house stimuli, 12 scrambled pictures (SPs) and 36 emotional pictures from the Chinese Affective Picture System (CAPS; Lu et al., 2005). Regarding the emotional pictures, we manipulated dimensions of valence (negative, neutral and positive) and sociality (social and non-social). Specifically, sociality was defined by whether the emotional pictures depicted any people (Britton et al., 2006; Powers et al., 2013). Consequently, there were six stimulus categories: social negative (e.g. refugee), social neutral (e.g. street), social positive (e.g. happy children), non-social negative (e.g. snake), non-social neutral (e.g. plant) and non-social positive (e.g. night scene). We provide descriptions of the social negative stimuli in the Supplementary Materials. Please note that empathy, as a crucial type of social emotion, may be elicited from these social negative scenes (Van der Velde et al., 2013). Pictures significantly differed from one another only in terms of valence [ANOVA with valence and sociality as between-subject variables showed a significant main effect of valence: F(2,54) = 306.038, P < 0.001, ηp2 = 0.919; positive > neutral > negative; a non-significant main effect of sociality: F(1,54) = 2.080, P = 0.155, ηp2 = 0.037; a non-significant interaction effect between valence and sociality: F(2,54) = 0.604, ηp2 = 0.022; Table 2]. We also controlled for arousal [ANOVA with valence and sociality as between-subject variables in arousal revealed a non-significant main effect of valence: F(2,54) = 2.814, P = 0.069, ηp2 = 0.094; a non-significant main effect of sociality: F(1,54) = 0.809, ηp2 = 0.015; a non-significant interaction effect between valence and sociality: F(2,54) = 0.567, ηp2 = 0.021; Table 2]. These data support an effective manipulation of valence and sociality while controlling for arousal. SPs, randomly swapping non-social neutral pictures (control), had the same rectangular shape, size, luminance and spatial frequency as the emotional pictures (adjusted using Adobe Photoshop CS5). The viewing angle was 6 × 3.38°. All materials were gray-scaled and displayed in the center of the screen.
Emotional information of affective scenes selected from the Chinese Affective Picture System (CAPS)
| Valence | Arousal | |||
|---|---|---|---|---|
| Social | Non-social | Social | Non-social | |
| Positive | 6.03 (0.33) | 6.11 (0.22) | 5.04 (0.18) | 5.00 (0.08) |
| Neutral | 5.06 (0.49) | 5.13 (0.39) | 4.81 (0.42) | 4.92 (0.25) |
| Negative | 2.71 (0.25) | 3.03 (0.67) | 4.98 (0.12) | 5.09 (0.33) |
Descriptive data are presented as mean (s.d.).
Task and procedure
We adopted the classic rapid serial visual presentation (RSVP) paradigm (Figure 1), with the core frame of two targets (T1 and T2), two questions (Q1 and Q2) and a stimulus-onset asynchrony (SOA; 300 ms) between two targets. This paradigm has been widely used and shown to be sensitive to detecting the role of attention in emotion processing under limited attentional resources (due to attentional blink phenomenon elicited by T1; Luo et al., 2010; Zhang et al., 2014). At the beginning of each trial, following a white fixation cross of 500 ms, a blue fixation cross appeared in the center of the screen. Then, 12 pictures of SPs, 1 house stimulus and 1 emotional picture were displayed, with each picture lasting 100 ms. In line with previous studies using RSVP to examine emotion processing (Luo et al., 2010; Zhang et al., 2014), the T1 showed one of three upright houses with the same occurrence probability, appearing at the fourth, fifth, sixth or seventh positions of the pictures series, randomly and equiprobably. The T2 displayed pseudo-randomly one of six types of emotional pictures 300 ms after the onset of T1. We regarded the social neutral condition as the baseline condition for the social positive and social negative conditions, to eliminate superposed electrical activity elicited by T1 and to thus obtain a pure emotional effect elicited by T2, and the same for the nonsocial conditions (Sergent et al., 2005; Luo et al., 2010; Zhang et al., 2014). Such subtractions kept the factor of interest (social element). For example, subtraction of waves in the social neutral condition from those in the social negative condition can obtain the negative effect during social condition. After each picture series, participants were asked to respond to Q1 and Q2 as accurate as possible. Q1 and Q2 were presented in a fixed order without reaction time limitation. The Q1 was ‘Which house was presented in T1’ (press Key ‘1’, ‘2’ or ‘3’ to match the house presented before). The Q2 asked participants to judge the context of T2 (press Key ‘1’ if the context of T2 presented before was indoor; press Key ‘3’ if the context of T2 presented before was outdoor). Take note that the indoor and the outdoor stimuli have the equal number for each category. The questions disappeared once responded. At the end of each trial, a black screen appeared for 100 ms. Please note that we asked the task-irrelevant (i.e. emotional content) question of Q2 to assess implicit processing of emotional information. The experiment included 360 trials (60 trials per block) and 60 trials per condition (each emotional picture was repeated six times). Participants completed several practice rounds before the formal experiment started. All experimental procedures were presented using E-prime 2.0 (Psychology Software Tools Inc. Pittsburgh, PA, USA).
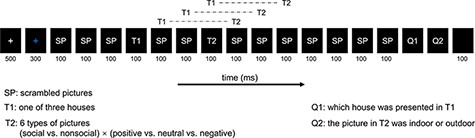
Experimental design of the rapid serial visual presentation (RSVP) task.
EEG recording and preprocessing
We recorded EEG data from a 64-electrode scalp cap according to the international 10–20 system (Brain Products, Munich, Germany), with the reference to the channel FCz. The electrooculogram (EOG; vertical) was recorded with electrodes placed below the right eye. Electrode impedances of EEG and EOG were maintained <10 kΩ. All electrodes were amplified using a 0.01–70 Hz online bandpass filter and continuously sampled at 1000 Hz per channel for offline analysis.
EEG data were preprocessed with EEGLAB 14.1.2b (Delorme and Makeig, 2004) in Matlab 2014b. It comprised the following steps: (i) low-pass filtering of 30 Hz by finite impulse response (FIR) filter; (ii) resampling to 250 Hz; (iii) re-referencing offline to the average of TP9 and TP10; (iv) manually rejecting salient muscle artifacts and bad channels (if any); (v) Independent Component Analysis; (vi) visually inspecting and rejecting artifact components (horizontal and vertical eye movements and muscle component); (vii) interpolating bad channels (if any); (viii) epoching from 500 ms before to 1000 ms after the T2 onset (300 ms SOA) and (ix) baseline correction (−500 to −300 ms). We defined the baseline as the period of −500 to −300 ms rather than −500 to 0 ms, given potential electrophysiological activities by T1 during the period of −300 to 0 ms (x) rejecting trials in which EEG voltages were out of range [−80, 80] μV. Please note that numbers of trials for each stimulus were 56.64 ± 5.92 (mean ± s.d.) for social positive, 56.81 ± 5.96 for social neutral, 56.57 ± 6.11 for social negative, 57.09 ± 5.14 for non-social positive, 56.94 ± 6.35 for non-social neutral and 56.87 ± 6.29 for non-social negative, while the number of rejected trials for each stimulus were 3.36 ± 5.92 (mean ± SD) for social positive, 3.19 ± 5.96 for social neutral, 3.43 ± 6.11 for social negative, 2.91 ± 5.14 for non-social positive, 3.06 ± 6.35 for non-social neutral and 3.13 ± 6.29 for non-social negative.
Behavioral and electrophysiological statistics
Statistical analyses were conducted using SPSS 17.0 (IBM Inc). We set the significance level at P = 0.05. Greenhouse–Geisser corrections were used whenever appropriate. Simple effect analyses were Bonferroni adjusted. Note that anxiety and depression have been demonstrated to co-occur with alexithymia (Hendryx et al., 1991; Li et al., 2015). In our sample, we found significant correlations of TAS-20 with SAS (r = 0.488, P = 0.001) and SDS (r = 0.479, P = 0.001). Thus, we included SAS and SDS scores as covariates in the ANCOVAs.
Accuracy
In line with previous studies using the RSVP paradigm to effectively elicit attentional blink (Luo et al., 2010; Zhang et al., 2014), we defined accuracy as the common accuracy of T1 and T2 for the behavioral index. We conducted a three-way ANCOVA on accuracy with group (ALEX/NonALEX) as a between-subject factor, sociality (social/non-social) and valence (positive/negative) as within-subject factors, and with SAS and SDS scores as covariates.
N2
The current study focused on the N2, a stimulus-locked average ERP component over frontal-central electrodes. Visual detection on the grand-averaged waveform and the topography confirmed the N2 time window (Figure 3A, B). The N2 was identified in a window of 280–330 ms over frontal-central electrodes [(Fz + FCz)/2; (Folstein and Van Petten, 2007; Nittono et al., 2007; Wu et al., 2014)]. T2-locked average waveforms under social positive and social negative conditions were computed separately for each participant as differences between social emotional conditions and the social neutral condition and the same for those of the non-social conditions. A 2 (ALEX/NonALEX) × 2 (social/non-social) × 2 (positive/negative) repeated-measures ANCOVA was conducted for the N2 with SAS and SDS scores as covariates.
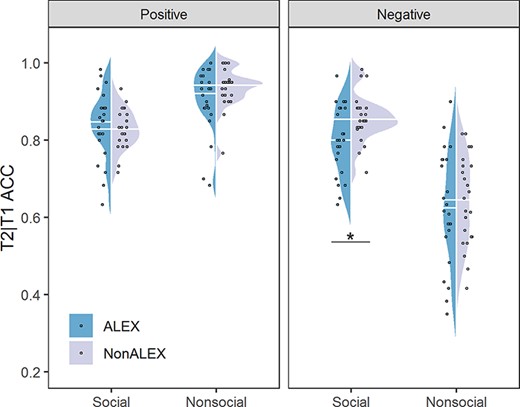
Behavioral results. Abbreviations, ALEX, individuals with alexithymia; NonALEX, individuals without alexithymia; ACC, common accuracy of T1 and T2. *P < 0.05.
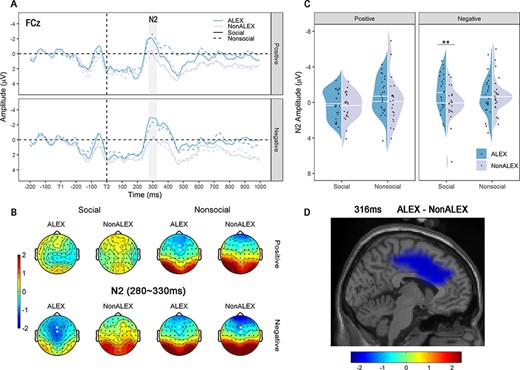
N2 results. (A) Time course at FCz electrode for each condition. Baseline from −200 to 0 ms at the onset of T1 was used. (B) Topographic maps of N2 for each condition. Electrodes marked with enlarged white dots were used to evaluate amplitudes of N2. (C) Mean amplitudes of N2. (D) Source localization of N2. Abbreviations: ALEX, individuals with alexithymia; NonALEX, individuals without alexithymia; **P < 0.01.
Alpha power
Time-frequency distributions of each trial were computed by a short-time Fourier transform. With a hanning window of 250 ms and the method of trend, we computed power for each point at the time domain (−500 to 1000 ms; steps: 4 ms) and frequency domain (1 to 30 Hz; steps: 1 Hz). After baseline correction (−500 to −300 ms), T2-locked average time-frequency power under social and non-social emotional conditions was computed separately for each participant as differences between social emotional conditions and the social neutral condition, and the same for that of the non-social conditions. Frequency band of interest in the current study was the central-parietal alpha oscillation [8–12 Hz; (CPz + Pz)/2; (Sarlo et al., 2005; Michels et al., 2008; López Zunini et al., 2013; Min et al., 2013)]. Regarding time domain, the 1000 ms stage of T2 processing was collapsed into 10 time windows with a duration of 100 ms each. We then conducted a 4-way repeated-measures ANCOVA for alpha power with sociality (social/nonsocial), valence (positive/negative) and time windows as independent variables, with group (ALEX/NonALEX) as the dependent variable and with SAS and SDS scores as covariates.
Source analysis
We used the minimum norm estimate (MNE) approach to localize the source of the N2 component with FieldTrip (Oostenveld et al., 2011) in Matlab 2013a. This source estimation algorithm recovers a source distribution with minimum overall power that produces data consistent with the measurement (Dale et al., 2000). The processes of MNE are as follows: (i) constructing a leadfield matrix based on the current electrical locations and the 1 cm resolution grid with three-shell boundary element head model, (ii) re-referencing to average, (iii) computing the average over trials and noise-covariance estimation and (iv) inverse solution execution. We performed MNE source analyses for each participant to examine the source activity of N2 differences. Differences in source activities between conditions were further entered into independent samples t-tests with group (ALEX/NonALEX) as the between-subject variable and with SAS and SDS scores as covariates, which was corrected by cluster-based permutation test (α = 0.025, two-tailed, 1000 times).
Regression analysis
To examine the dominant contributors in sub-dimensions of alexithymia to behavioral and electrophysiological differences between ALEX and NonALEX, we conducted step-wise regression analyses with DIF, DDF and EOT as independent variables, with SAS and SDS scores as covariates, and with the dependent variable of accuracy, N2 and alpha power elicited by social negative stimuli, respectively.
Results
Behavioral results
For accuracy (common accuracy of T1 and T2), the three-way ANCOVA revealed a significant interaction effect among sociality, valence and group (F(1,43) = 8.377, P = 0.006, ηp2 = 0.163). However, marginally significant interactions among sociality, valence and SAS/SDS were also found (sociality × valence × SAS, F(1,43) = 3.998, P = 0.052, ηp2 = 0.085; sociality × valence × SDS, F(1,43) = 3.821, P = 0.057, ηp2 = 0.082), which violated the assumption of ANCOVA that covariates should not influence the effect of interest (Miller and Chapman, 2001). We thus performed an ANOVA for accuracy with group as between-subject variable and with sociality and valence as within-subject variables. This three-way repeated-measures ANOVA revealed significant main effects of sociality and valence [sociality, F(1,45) = 21.176, P < 0.001, ηp2 = 0.320, social > non-social; valence, F(1,45) = 222.800, P < 0.001, ηp2 = 0.832, positive > negative], as well as a significant interaction effect between sociality and valence [F(1,45) = 196.378, P < 0.001, ηp2 = 0.814]. Importantly, we observed a significant interaction effect among group, sociality and valence [F(1,45) = 4.199, P = 0.046, ηp2 = 0.085; Figure 2]. Based on simple effect analyses, ALEX showed significantly lower accuracy than NonALEX only when perceiving social negative stimuli [F(1,45) = 6.919, P = 0.012, ηp2 = 0.133; Table 3], but not for other stimuli (Ps > 0.130). No other significant effect was found for accuracy (ps > 0.157).
Behavioral accuracy and electrophysiological responses in each experimental condition of each group
| Valence | Sociality | Group | ACC | N2 (μV) | Alpha (dB) |
|---|---|---|---|---|---|
| Positive | Social | ALEX | 0.839 (0.087) | −0.199 (1.600) | 0.094 (0.280) |
| NonALEX | 0.839 (0.052) | 0.411 (1.576) | 0.014 (0.274) | ||
| Non-social | ALEX | 0.905 (0.083) | −0.752 (2.073) | 0.012 (0.276) | |
| NonALEX | 0.937 (0.052) | −0.427 (2.757) | 0.047 (0.307) | ||
| Negative | Social | ALEX | 0.798 (0.089) | −1.132 (2.039) | 0.108 (0.232) |
| NonALEX | 0.857 (0.062) | 0.142 (2.007) | −0.100 (0.312) | ||
| Non-social | ALEX | 0.624 (0.145) | −0.604 (2.047) | −0.008 (0.314) | |
| NonALEX | 0.643 (0.115) | −0.925 (2.014) | 0.012 (0.193) |
Descriptive data are presented as mean (s.d.). ALEX, individuals with alexithymia; NonALEX, individuals without alexithymia; ACC, common accuracy of T1 and T2.
N2 results
With regard to the amplitude of the N2, the three-way ANCOVA revealed a significant interaction effect among sociality, valence and group [F(1,43) = 6.744, P = 0.014, ηp2 = 0.133; Figure 3C; Table 3]. Based on simple effect analyses, ALEX showed a significantly larger N2 than NonALEX only when perceiving social negative stimuli [F(1,43) = 10.107, P = 0.003, ηp2 = 0.190; Table 3] but not for other stimuli (Ps >0.456). No other significant effect was found for the N2 (Ps > 0.072). A similar pattern was observed when removing outliers in each condition [out of mean ± 3 × SD; one participant of NonALEX group]. Again, a significant interaction effect among valence, sociality and group was found [F(1,42) = 6.027, P = 0.018, ηp2 = 0.125]. Simple effect analyses revealed a larger N2 in ALEX than NonALEX for social negative stimuli [F(1,42) = 9.709, P = 0.003, ηp2 = 0.188] but not for other conditions (Ps > 0.539). Tracking the group difference of N2 in the source space using the MNE approach, we observed decreased activation of the dACC at 316 ms in ALEX compared to NonALEX (Figure 3D).
Alpha power results
The four-way ANCOVA revealed a significant interaction effect between sociality and group [F(1,43) = 8.301, P = 0.006, ηp2 = 0.162; Figure 4; Table 3]. Simple effect analyses showed significantly stronger alpha power in ALEX than NonALEX in response to social stimuli only [F(1,43) = 9.741, P = 0.003, ηp2 = 0.185]. No significant group difference was found in the non-social conditions [F(1,43) = 0.009, P = 0.926, ηp2 < 0.001]. No other significant effect in alpha power was found (Ps > 0.055). A similar pattern was observed when removing outliers in each condition (out of mean ± 3 × SD; two participants of ALEX). The significant interaction effect between sociality and group remained [F(1,41) = 8.553, P = 0.006, ηp2 = 0.173]. Simple effect analyses revealed significantly stronger alpha power in ALEX than NonALEX evoked by social conditions [F(1,41) = 6.271, P = 0.016, ηp2 = 0.133] but not by non-social conditions [F(1,41) = 2.133, P = 0.152, ηp2 = 0.049].
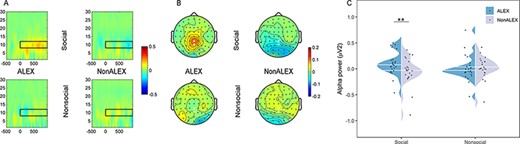
Alpha power results. (A) Time–frequency maps at CPz electrode. (B) Topographic maps. Electrodes marked with enlarged white dots were used to evaluate power values. (C) Mean power values. Abbreviations: ALEX, individuals with alexithymia; NonALEX, individuals without alexithymia; **P < 0.01.
Regression results
Step-wise regression analyses revealed that DIF significantly predicted accuracy (beta = −0.411, t = −2.554, P = 0.014; Figure 5A; Table 4), and EOT scores significantly predicted the N2 component and alpha power in face of social negative stimuli (N2: beta = −0.541, t = −3.832, P < 0.001; alpha power: beta = 0.532, t = 3.657, P = 0.001; Figure 5B; Table 4). We also found a significant partial correlation between N2 and alpha power with the SAS and the SDS as covariates [r(43) = −0.529, P < 0.001; Figure 5B].
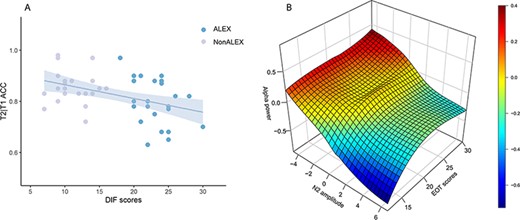
Regression Results. A) Correlation between DIF scores and T2|T1 ACC. B) Correlations among EOT scores, N2 amplitudes, and alpha power. Abbreviations: ALEX, individuals with alexithymia; NonALEX, individuals without alexithymia; DIF, difficulty identifying feelings; ACC, common accuracy of T1 and T2; EOT, externally orientated thinking.
Step-wise regressions of alexithymia facets
| Independent variables | Dependent variable | R2 | Coefficient (beta) | T | P | 95% confidence interval |
|---|---|---|---|---|---|---|
| DIF | ACC | 0.240 | −0.411 | −2.554 | 0.014 | [−0.009, −0.001] |
| EOT | N2 | 0.261 | −0.541 | −3.832 | < 0.001 | [−0.358, −0.111] |
| EOT | Alpha power | 0.243 | 0.523 | 3.657 | 0.001 | [0.014, 0.049] |
DIF, difficulty identifying feelings; EOT, externally oriented thinking; ACC, common accuracy of T1 and T2.
Discussion
The current study examined social-specific deficits of emotion perception in clinically relevant alexithymia and the underlying electrophysiological substrates. ALEX showed lower accuracy, an increased N2 originating in dACC and higher alpha power in response to social stimuli with negative valence (but not to other emotional stimuli), compared to NonALEX. Regarding the alexithymia facets, DIF predicted poorer behavioral performance, whereas EOT predicted larger N2 amplitudes and higher alpha power during the processing of negative social stimuli. Our findings support the hypothesis that deficits in emotion perception in individuals with alexithymia are social-specific, especially for negative emotions. The oscillation results suggest that alexithymic individuals mobilize attentional sources to a stronger degree in order to process social emotional information (Knyazev et al., 2006).
We observed that ALEX performed worse than NonALEX only in processing negative social stimuli, suggesting that alexithymia predominantly hampers the processing of negative social emotions. Although several studies have reported alterations in the processing of negative emotion in relation to alexithymia (Mériau et al., 2006; Van der Velde et al., 2013; Donges and Suslow, 2017), the facial expression stimuli used in these studies (Kano et al., 2003; Mériau et al., 2006) were also social stimuli per se (i.e. perceiving others’ emotions through facial cues; Powers et al., 2013). Moreover, several studies failed to identify alexithymia-related differences in response to non-social negative stimuli (e.g. negative emotion words, Lundh and Simonsson-Sarnecki, 2002; negative images without consideration of sociality, Walker et al., 2011). Although exemplar stimuli used in Walker et al. (2011) contained social information (e.g. mutilation, individuals held at gunpoint, images of starvation and car accidents), differences between social and nonsocial emotional stimuli processing in alexithymia were not examined in their study. The possibility could be raised that these discrepancies may be due to non-analyzed differences in sociality. Here, we systematically manipulated valence and sociality in an orthogonal design (Powers et al., 2013) to test whether deficits in emotion in alexithymia are social-specific. The current results confirm this hypothesis. This may have important implications for the treatment of alexithymia-related disorders. However, the observed deficits were associated with depression and anxiety and should thus be interpreted with caution. Our results are consistent with a study measuring physiological responses (i.e. skin conductance responses, SCRs) in people with and without alexithymia (Martínez-Velázquez et al., 2017). This study reported lower amplitudes of SCRs to pictures with social than without social relevance in people with high alexithymia scores, whereas the opposite pattern was observed for people with low alexithymia scores.
To the best of our knowledge, we are the first to report on electrophysiological brain activity differences between people with and without alexithymia in relationship to social vs. non-social emotional stimuli. The larger N2 of ALEX than those of NonALEX only showed in the social negative condition rather than other conditions, indicating enhanced N2 in alexithymia in response to social negative scenes. Increased N2 amplitudes have been linked to more difficulties in decoding stimuli (Nittono et al., 2007) and more attentional resources required during early information processing (Ito and Urland, 2003; Wu et al., 2014). Previous EEG studies suggested that individuals with alexithymia engage in greater cognitive control to deploy attention to emotional stimuli (Franz et al., 2004; Pollatos and Gramann, 2011; Donges and Suslow, 2017). In line with these findings, the larger N2 in alexithymic individuals may reflect greater demands of attention resource allocation to decode social negative information.
In accordance with previous findings (Folstein and Van Petten, 2007), source analysis revealed that the larger N2 for the group difference originated in the dACC. Although the activation of the dACC in alexithymia literature was controversial with both increased (Mériau et al., 2006) and decreased (Kano et al., 2003; Moriguchi et al., 2007) activation in separate studies, Van der Velde et al. (2013) proposed a reversed U-shape activation pattern depending on task difficulty to explain these discrepancies regarding dACC activation. Specifically, lower activation in the dACC would be associated with alexithymia during tasks that required additional cognitive processing of emotion-laden stimuli and vice versa (Van der Velde et al., 2013). In combination with previous findings regarding emotion processing based on dual-task RSVP designs eliciting an attentional blink (Luo et al., 2010), the current result of lower activation in the dACC supports a U-shape pattern depending on difficulty. On the other hand, Lane et al. (1997) proposed the ‘blindfeel’ hypothesis, arguing that—in analogy to ‘blindsight’—reduced conscious awareness of emotional feelings in alexithymia results from ACC dysfunction. Indeed, a number of functional magnetic resonance imaging studies have reported altered dACC activation during emotion processing in alexithymia (for a meta-analysis, see Van der Velde et al., 2013). Therefore, larger responses of N2 from the dACC in the current study suggest that individuals with alexithymia need to call upon more attentional resources to decode social negative information.
Stronger alpha power of ALEX than NonALEX was observed in social conditions regardless of valence. Alpha power has been linked to the recruitment of neural resources (Ciesielski et al., 2007; Segrave et al., 2012), while increased alpha power has been specifically associated with enhanced attention (Knyazev et al., 2006). Therefore, consistent with the results of N2, the current increased alpha power in ALEX during social processing may reflect the mobilization of additional attentional resources for processing social-emotional information.
Given that different facets of alexithymia exert distinctive roles in socio-affective functions, we also tested the contribution of sub-dimensions of alexithymia to behavioral and electrophysiological differences between groups (Goerlich-Dobre et al., 2014, 2015; Goerlich, 2018). We found that DIF was predictive of behavioral accuracy, whereas EOT predicted the N2 amplitude and alpha power during the perception of negative social stimuli. This is consistent with previously documented associations of DIF and EOT with emotion perception measures (Donges and Suslow, 2017). According to the attention-appraisal model of alexithymia, EOT manifests as difficulty to focus attention on emotional information, especially during rapid emotion processing such as employed here (Preece et al., 2017). At the appraisal stage, DIF and DDF are conceptualized as difficulty to understand the content and significance of emotional stimuli (Preece et al., 2017). Thus, the current results suggest that an EOT style contributes to difficulties at the attentional stage (larger N2, stronger alpha power) of processing social information especially of negative valence, while DIF contributes to difficulties at the appraisal stage, resulting in problems to accurately identify negative social information. Notably, there might be a cultural difference in the prevalence of alexithymia. Ten percent was reported and replicated on the basis of western populations in a 12-month follow-up study (Honkalampi et al., 2001; Lukas et al., 2019), which has been shown to be stable over 11 years (Hiirola et al., 2017). However, in the present study, we found a percentage of 14.21% of a pool of 549 Chinese participants. This prevalence rate is consistent with our previous studies that show a prevalence of 13% of 246 Chinese participants (Wang et al., 2021b) and 14.9% of the 543 Chinese participants (Wang et al., 2021a). Together, these results suggest that culture (and/or questionnaire language usage and interpretation) may affect prevalence rates in alexithymia (Wang et al., 2021b).
Our results add to the mounting evidence for social-specific impairments in alexithymia in both cognition (mirror neuron system, action imitation and theory of mind; Moriguchi et al., 2006, 2009; Sowden et al., 2016) and emotion (empathy; Geoffrey Moriguchi et al., 2007; Bird et al., 2010) domains. However, before the engagement of these high-level social-specific mental activities, implicit emotion processing arises at the initial presentation of the stimulus (Phillips et al., 2003). The current results, regarding neural correlates for implicit social-emotional processing, support the view of specific impairments of self-to-other neural circuits in alexithymia (Bird and Viding, 2014). This may not be limited to empathy (given the nature of our social negative stimuli, see Supplementary Materials for descriptions). Indeed, our study showed more general social-specific impairments of emotion perception in alexithymia. These results are also consistent with aberrant responses to certain social situations, e.g. blunted responses of the dACC to social rejection in people with alexithymia (Chester et al., 2015). The exact nature of the relationship between emotion processing and other areas of social cognition and functioning in alexithymia remains to be elucidated. For example, this could primarily be due to disrupted affective representations in alexithymia, or conversely deficient social processing may affect emotion recognition and regulation.
Several limitations of the present study are worth mentioning. First, we did not balance gender in groups of ALEX and NonALEX, although no significant gender difference in alexithymia was found in Chinese samples (Zhu et al., 2007) and all current group-related effects held while controlling for gender differences (see Supplementary Materials). Second, given that participants were recruited from a student population, which is more homogeneous than the general population, the generalizability of the existing findings remains an important area for future investigation (Henrich et al., 2010). Third, because the human brain is characterized by a dynamic interaction among spatially distributed regions through a large-scale network (Hassan and Wendling, 2018), future studies should examine in more detail the brain networks underlying socio-affective perception in alexithymia, e.g. using different tasks of social-emotional processing. They may also link this to everyday social functioning. Next, we only controlled for anxiety and depression in the current study. Potential influences of other personality traits on alexithymia (e.g. autism; Bird and Cook, 2013) should be clarified in future studies. Finally, although the international cutoff TAS-20 scores of 61 and 51 are widely adopted in studies on both western and eastern populations (Kano et al., 2003; Gong, 2008), whether and to what extent these cutoffs can be applied to healthy Chinese individuals needs further investigation. Initial cross-cultural validation has been performed for the Chinese version of the TAS-20 (Zhu et al., 2007; Ling et al., 2016). Of note, in our study, group with alexithymia and group without alexithymia are completely separable. Future studies are necessary to examine cutoff scores for the TAS-20 in Chinese populations.
To conclude, this study provides behavioral and electrophysiological evidence that emotion processing impairments in clinically relevant alexithymia are social-specific and more pronounced for negative emotions. These findings may have important implications for the diagnosis and treatment of alexithymia-related affective disorders.
Funding
This study was supported by the National Natural Science Foundation of China (31920103009 and 31871137), the Major Project of National Social Science Foundation (20&ZD153), Young Elite Scientists Sponsorship Program by China Association for Science and Technology (YESS20180158), Guangdong International Scientific Collaboration Project (2019A050510048), Guangdong Key Basic Research Grant (2018B030332001), Shenzhen-Hong Kong Institute of Brain Science-Shenzhen Fundamental Research Institutions (2019SHIBS0003), Shenzhen Science and Technology Research Funding Program (JCYJ20180507183500566) and Shenzhen-Hong Kong Institute of Brain Science-Shenzhen Fundamental Research Institution (2019SHIBS0003).
Conflict of interest
The authors declared no conflict of interest.
Data availability
The data that support the findings of this study are available from the corresponding author upon reasonable request.
Ethics approval
This study was approved by the Ethics Committee of Shenzhen University and informed written consents were obtained from all participants.
Supplementary data
Supplementary data are available at SCAN online.
