


Abstract
Our ability to infer a speaker’s emotional state depends on the processing of acoustic parameters such as fundamental frequency (F0) and timbre. Yet, how these parameters are processed and integrated to inform emotion perception remains largely unknown. Here we pursued this issue using a novel parameter-specific voice morphing technique to create stimuli with emotion modulations in only F0 or only timbre. We used these stimuli together with fully modulated vocal stimuli in an event-related potential (ERP) study in which participants listened to and identified stimulus emotion. ERPs (P200 and N400) and behavioral data converged in showing that both F0 and timbre support emotion processing but do so differently for different emotions: Whereas F0 was most relevant for responses to happy, fearful and sad voices, timbre was most relevant for responses to voices expressing pleasure. Together, these findings offer original insights into the relative significance of different acoustic parameters for early neuronal representations of speaker emotion and show that such representations are predictive of subsequent evaluative judgments.
Introduction
It is well established that listeners readily infer a speaker’s emotional state based on the speaker’s voice acoustics (Banse and Scherer, 1996; Juslin and Laukka, 2003). Yet, after over 30 years of research, and in some contrast to the accuracy with which listeners infer vocal emotions, the identification of emotion-specific acoustic profiles has been only partially successful (Banse and Scherer, 1996; Juslin and Laukka, 2003; Brück et al., 2011). Specifically, it remains uncertain how different vocal cues such as fundamental frequency and timbre are processed in the listener’s brain to inform emotional inferences (Frühholz et al., 2016; Frühholz and Schweinberger, 2021). Here, we review past efforts and identify important conceptual and methodological challenges (Scherer, 1986; Gobl, 2003; Patel et al., 2011). We address these challenges by complementing earlier work with a parameter-specific voice morphing approach that specifically manipulates individual vocal cues. We focus on fundamental frequency contour and timbre to understand the mechanisms by which they influence neural integration and subsequent behavioral responses in vocal emotions.
The role of different acoustic parameters in vocal emotion perception
That listeners can infer emotions from voices with remarkable accuracy has prompted the assumption that different emotions are characterized by distinct patterns of acoustic parameters (Banse and Scherer, 1996; Juslin and Laukka, 2003; Paulmann and Kotz, 2018). To date, the literature has focused on four groups of parameters including (i) fundamental frequency contour (F0), (ii) amplitude, (iii) timbre and (iv) temporal aspects. Indeed, all these parameters have been found to be important in signaling emotional quality (Juslin and Laukka, 2003). However, despite enormous efforts, a potential mapping of vocal parameters to specific emotions remains elusive. For instance, anger, fear and happiness have all been linked to a high F0 mean and variability, a large amplitude and a fast rate of articulation, whereas the opposite was found for sadness (Banse and Scherer, 1996; Juslin and Laukka, 2003; Brück et al., 2011; Lima and Castro, 2011; Lausen and Hammerschmidt, 2020). These findings seem to reflect that vocal parameters signal unspecific arousal rather than more differentiated emotional states and thus fail to account for listener performance (Brück et al., 2011). Here, we consider this apparent paradox, suggesting that methodological challenges inherent in the study of natural speech may preclude insights into the functional significance of different acoustic parameters. In what follows, we will outline these challenges focusing on difficulties associated with the interpretation of correlational data, the selection of relevant parameters and the partial redundancy of vocal cues.
Past research typically measured a set of acoustic parameters and used the obtained measures to study differences between emotional categories or to predict listener responses (Banse and Scherer, 1996; Juslin and Laukka, 2003; Lima and Castro, 2011). However, this approach is intrinsically correlational and does not allow for causal inference. Therefore, Arias et al. (2021) explicitly called for voice manipulation techniques to gain control over the acoustic properties expressing vocal emotions. An experimental elimination of the natural covariation between specific auditory parameters and emotion quality could prove particularly beneficial in research on event-related potentials (ERPs), where dissociating sensory from emotional responses poses a major challenge (Paulmann et al., 2013; Schirmer et al., 2013). Parameter-specific voice morphing has been recently established as a suitable tool to study how different acoustic cues facilitate the perception of speaker age, gender and identity (Skuk et al., 2015, 2020; Kawahara and Skuk, 2019). Applications in the domain of vocal emotion perception are still sparse but offer great potential (Nussbaum et al., 2022; von Eiff et al., 2022).
When choosing the vocal parameters under study, the majority of research focused on measuring F0, a perceptually dominant parameter, which is relatively easy to measure. However, it has been widely acknowledged that other parameters, in particular timbre, may be equally important but have been rarely considered (Banse and Scherer, 1996; Gobl, 2003; Patel et al., 2011). Defined as ‘the difference between two voices of identical F0, intensity and temporal structure’ (ANSI, 1973), timbre reflects a complex combination of several parameters, including formant frequency and bandwidth, high spectral energy and spectral noise (Juslin and Laukka, 2003; Lima and Castro, 2011). Timbre perception is likely based on an integration of all its features (Piazza et al., 2018), and previous works that studied timbre suggest a central role of this parameter in voice processing (Gobl, 2003; Skuk et al., 2015; Tursunov et al., 2019; Nussbaum et al., 2022). In particular, Grichkovtsova et al. (2012) found that both timbre and prosodic contour carry unique information for different emotions.
Finally, the idea that universal acoustic patterns signal discrete emotions discounts a central aspect of our perceptual system: flexibility. In fact, Spackman et al. (2009) showed that marked vocal and expressive differences between speakers have little impact on listeners’ ability to infer emotions, suggesting that listeners flexibly adapt their inferential processes to a speaker’s overall vocal profile. Conceptually, this flexibility is captured in Brunswiks’ lens model (Brunswik, 1956), in which acoustic cues are understood as probabilistic and partly redundant. Crucially, decoders are thought to rely on these cues in a partly interchangeable manner (Juslin and Laukka, 2003). Thus, simply comparing different acoustic parameters with respect to their significance or predictive value for emotional judgments can be very misleading if their contribution is implicitly assumed to be non-redundant. Instead, this can be made explicit by exploring to which degree a particular vocal parameter carries unique information that cannot be transported by other parameters. Notably, this may be achieved by creating voices expressing emotions through only one parameter while other parameters are held at a non-informative neutral level.
Electrophysiological correlates of vocal emotion perception
Although distinct neural networks involved in the processing of different acoustic parameters have been discussed for voice and speech perception, e.g. a lateralization of pitch and timing information (Poeppel, 2001; Belin et al., 2011), this has rarely been linked to emotional processing. Likewise, while current models on the neural processing of vocal emotions emphasize the importance of monitoring and integrating relevant acoustic cues in real time (Frühholz et al., 2016), it is not yet understood how this takes place for specific vocal parameters in different emotions. To this point, research using electroencephalography (EEG) highlights different processing stages that unfold dynamically across time (Schirmer and Kotz, 2006; Paulmann and Kotz, 2018). The initial analysis of acoustic features presumably already modulates the N100 component, whereas subsequent emotional salience has been linked to later processes at around 200 ms following stimulus onset as indexed, for example, by the P200 (Schirmer et al., 2005; Paulmann and Kotz, 2008; Paulmann et al., 2013; Pell et al., 2015; Schirmer and Gunter, 2017). Finally, top-down and goal-directed vocal analyses seem to involve mechanisms associated with the N400 or the late positive component (Paulmann and Kotz, 2018). All these ERP components, especially the N100 and the P200, are sensitive to changes in vocal parameters such as pitch and loudness, but to date, it is unclear how these acoustics are integrated specifically to derive emotional meaning (Paulmann and Kotz, 2018).
Aims of the present study
Although the importance of individual acoustic parameters for emotion perception is widely recognized, these parameters have been rarely pursued experimentally and, to the best of our knowledge, not in the context of functional neuroimaging. The present study sought to address this gap and to answer the following two questions: (1) What are the unique contributions of F0 vs timbre to the perception of specific vocal emotions and (2) how does the neural processing of these parameters unfold in time? To this end, we used parameter-specific voice morphing to create F0-only and timbre-only morphs, which contained emotional information in only one of these parameters. Additionally, we created Full morphs, which encompassed emotional information from both F0 and timbre. Participants listened to all stimuli in random order and were asked to classify speaker emotion, while their EEG was being recorded.
For the emotion classification performance, we predicted that compared to a condition with full emotional information, accuracy in both parameter-specific conditions would be inferior since both F0 and timbre carry unique information important for successful emotional decoding. However, we speculated that the relative importance of F0 vs timbre would differ as a function of emotion. With respect to the EEG, we were particularly interested in evidence regarding the temporal pattern of F0 vs timbre processing. In an exploratory cluster-based permutation analysis, we examined a time range from 0 to 500 ms following voice onset to detect potential modulations in both earlier (N100/P200) and later (N400) ERP components, speculating that such modulations could be relevant in predicting parameter-specific behavioral responses.
Method
Listeners
Based on prior behavioral data (Grichkovtsova et al., 2012), we conducted a power analysis using the R-package ‘Superpower’ (Lakens and Caldwell, 2019) with a medium effect size f= 0.13, an alpha level of 0.05 and a power of 0.80 for the interaction of Emotion and Morph Type on recognition accuracy, resulting in a required sample size of 36. We collected data from 44 healthy native German speakers with no hearing impairments, as confirmed by a short audio test (Cotral-Labor-GmbH, 2013). All participants were students at the Friedrich Schiller University of Jena. Sessions lasted about 2.5 h. Participation was compensated with course credit or 8.50€/h. The experiment was approved by the ethics committee of the Friedrich Schiller University of Jena.
The data from five participants had to be excluded (three had >3% of missing trials and two had <80% correct in the word naming task). The final sample consisted of 39 participants [27 females and 12 males, aged 18–29 years (M = 22.41; Mdn = 22; SD = 2.92), 2 left-handed].
Stimuli
Original audio recordings
We selected original audio recordings from a database of vocal actor portrayals provided by Sascha Frühholz from the Department of Cognitive and Affective Neuroscience of the University of Zurich, similar to the ones used in Frühholz et al. (2015). For the present study, we used three pseudowords (/molen/, /loman/ and /belam/) with expressions of happiness, pleasure, fear, sadness and neutral. We opted for two positive and two negative emotions for various reasons, including that previous studies often focused on happiness as the only positive emotion and that comparing only one positive and one negative emotion would have enabled only valence-based (i.e. positive vs negative) insights. Stimuli were validated after applying the voice morphing procedure in an independent rating study with 20 raters, including more emotions and morph levels. Based on these ratings, we selected two positive and two negative emotions with different degrees of intensity [happiness vs pleasure: t(19) = 9.57, p < 0.001, with M = 3.40 ± 0.06 and M = 2.88 ± 0.07; fear vs sadness: t(19) = 6.58, p < 0.001, M = 3.01 ± 0.06 and M = 2.78 ± 0.07; on a rating scale ranging from 1 to 4]. For the complete documentation of the rating study, refer to Supplemental Material on https://osf.io/sybrd/.
Voice morphing
Using the Tandem-STRAIGHT software (Kawahara et al., 2008, 2013), we created morphing trajectories between each emotion and the neutral expression of the same speaker and pseudoword. After manual mapping of time and frequency anchors at key features of a given utterance pair (e.g. onset and offset of vowels), vocal samples on an emotion/neutral continuum were synthesized via weighted interpolation of the originals; for a more detailed description see Kawahara and Skuk (2019). Crucially, Tandem-STRAIGHT allows independent interpolation of five different parameters: (i) F0 contour, (ii) timing, (iii) spectrum level, (iv) aperiodicity and (v) spectral frequency; the latter three are summarized as timbre.
Three types of morphed stimuli were created (Figure 1). ‘Full-Morphs’ were stimuli with all Tandem-STRAIGHT parameters taken from the emotional version (corresponding to 100% from the emotion and 0% from neutral), with the exception of the timing parameter, which was taken from the neutral version (corresponding to 0% emotion and 100% neutral). ‘F0-Morphs’ were stimuli with the F0 contour taken from the emotional version, but timbre and timing taken from the neutral version. ‘Timbre-Morphs’ were stimuli with all timbre parameters taken from the emotional version, but F0 and timing from the neutral version. In addition, all original neutral stimuli were included as an extra non-emotional reference category. Note that the timing was kept constant across all conditions to allow a pure comparison of F0 vs timbre. In total, this resulted in 8 (speakers) × 3 (pseudowords) × 4 (emotions) × 3 (morphing conditions) + 24 neutral (8 speakers × 3 pseudowords) = 312 stimuli. For analysis purposes, we collapsed data across speakers and pseudowords.
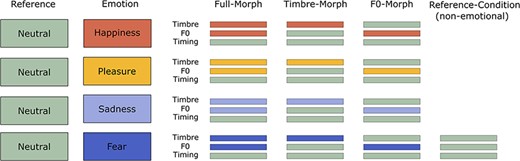
Schematic illustration of the different parameter-specific voice morphs.
Using Praat (Boersma, 2018), we normalized all stimuli to a root mean square of 70 dB sound pressure level (duration M = 670 ms, min = 411 ms, max = 878 ms). Please refer to https://osf.io/sybrd/ for a detailed summary of acoustic parameters, some examples of the sound files and a rating study validating the stimuli.
Design
Experimental setup and EEG recording
After providing informed consent and completing a short audio test (Cotral-Labor-GmbH, 2013), participants were prepared for the EEG-recording and subsequently started the emotion classification experiment using E-Prime 3.0 (Psychology Software Tools, Inc., 2016). The EEG was recorded using a 64-channel BioSemi Active II system (BioSemi, Amsterdam, Netherlands) with electrodes being attached with a cap on the 10–20 system (for EEG channel locations refer to https://osf.io/sybrd/). This system works with a ‘zero-ref’ setup with a common mode sense/driven right leg circuit instead of ground and reference electrodes (for further information, https://www.biosemi.com/faq/cms&drl.htm). The horizontal electrooculogram (EOG) was recorded from two electrodes at the outer canthi of both eyes, and the vertical EOG was monitored with a pair of electrodes attached above and below the right eye. All signals were recorded with direct current (120 Hz low-pass filter) and sampled at a rate of 512 Hz. During the EEG recording, participants were seated in a dimly lit, electrically shielded and sound-attenuated cabin (400-A-CT-Special, Industrial Acoustics™, Niederkrüchten, Germany) with their heads on a chin rest to ensure a constant distance of 90 cm to the computer screen. The sound stimuli were presented via in-ear headphones (Bose® MIE2 mobile headset).
Experimental task
The participants’ task was to classify the stimulus emotion as happiness, pleasure, fear or sadness. There was no neutral response option; to avoid that, participants would choose neutral whenever they were unsure about their response. Assignment of response keys and response hands to emotion categories was counterbalanced across participants, using four different key mappings (Supplementary Table S2 on https://osf.io/sybrd/).
Each trial started with a white fixation cross centered on a black screen. After 1000 ± 100 ms, the cross changed into green and a vocal stimulus started playing. Behavioral responses were recorded from voice onset until 3000 ms after voice offset. As soon as a response was given, the fixation cross changed to gray, signaling the logging of the response. The cross remained on screen until the end of the response window. In case of no response (omission error), the final trial slide (500 ms) was a feedback screen prompting participants to respond faster; otherwise, the screen turned back. Then the next trial started.
Because emotion judgments are subjective, judgment accuracy may not be ideal to gauge a participant’s conscientiousness. Therefore, we added a second task on 10% of the trials. Here, participants were prompted to identify the last pseudoword by pressing one of four response options (/molen/, /namil/, /loman/ and /belam/). Please note that we added the /namil/-response option to have a label for each of the four keys on screen. In fact, we only used three different pseudowords, so /namil/ was never the correct response. A participant’s data entered data analysis only if word identification accuracy was 80% or more. The experiment started with 10 practice trials presenting stimuli not used for the actual task. Subsequently, all 312 experimental stimuli were presented once in random order and then again in a different random order, resulting in 624 trials. Individual self-paced breaks were encouraged between blocks of 78 trials. The total duration of the experiment was about 50–60 min. After the experiment, participants completed a set of questionnaires that entered an exploratory analysis reported in https://osf.io/sybrd/.
Data processing and analysis
Trials with omitted or preemptive responses (<200 ms) were excluded from the analysis of behavioral data. Mean accuracy and confusion data were analyzed using R version 4.0.2 (R Core Team, 2020).
All trials entered EEG data analysis, which was done using EEGLAB (Delorme and Makeig, 2004) in Matlab R2020a (MATLAB, 2020). Raw EEG recordings were downsampled to 250 Hz and re-referenced to the average reference. Then the data were low-pass filtered at 30 Hz, high-pass filtered at 0.1 Hz (both filters −6 dB/octave, zero-phase shift) and epoched using a time interval of −200 to 1000 ms relative to voice onset. Epochs were then visually scanned for noisy channels and other unsystematic artifacts, such as drifts or muscle movements. The cleaned data were 1 Hz high-pass filtered and subjected to an independent component analysis. The resulting component structure was applied to the preprocessed data with the 30 to 0.1 Hz filter settings. Components reflecting typical artifacts (e.g. eye movements, eye blinks or ECG activity) were removed before back-projecting information from component space into EEG channel space. Next, the data were baseline corrected with a window of −200 to 0 ms relative to stimulus onset, and channels that had been removed earlier due to noise were interpolated using a spherical spline procedure (one channel in two participants and two channels in two participants). The resulting data were again scanned visually and residual artifacts and epochs were removed. Remaining epochs were submitted to a current source density (CSD) transformation using the CSD toolbox in EEGLAB (Kayser, 2009; Kayser and Tenke, 2006). This transformation returns essentially reference-free data which optimize the segregation of spatially overlapping sources (Kayser and Tenke, 2015). An analysis with the original average-referenced data replicates the results reported here and can be found in the aforementioned OSF repository. ERPs were derived by averaging epochs for each condition and participant. A minimum of 40 trials and an average of 47.48 trials per condition (out of a possible maximum of 48) and participant entered statistical analysis.
In order to assess the effects of F0 and timbre on the ERPs, we calculated difference waves by subtracting from the Full condition either F0 or timbre conditions, for each emotion separately. This resulted in two difference waves per emotion (DiffFull-F0 and DiffFull-Timbre) and was done to enable a more meaningful visual examination of the data and of how the removal of only one parameter affected the ERP when compared with the full condition. Please note that a comparison between DiffFull-F0 and DiffFull-Timbre is mathematically equivalent to a simple comparison of F0 and timbre conditions. To explore the divergence between DiffFull-F0 and DiffFull-Timbre for both topography and time course of ERP deflections, we performed a cluster-based permutation test on all 64 electrodes using the FieldTrip toolbox (Maris and Oostenveld, 2007; Oostenveld et al., 2011). The latency range was set from 0 to 500 ms, which offsets before the participants’ mean behavioral response (MRT = 1489 ms, with 99% of trials between 697 and 2911 ms). The analysis was done separately for each emotion using the Monte Carlo method with 1000 permutations and minimum cluster size of two channels. Based on the obtained cluster results, we then selected a frontocentral region of interest (ROI) including nine channels [F1, Fz, F2, FC1, FCz, FC2, C1, Cz and C2] in latency ranges of the P200 [150, 250] and an N400-like negativity [300, 400] for further visualization and exploration. The behavioral and preprocessed EEG data together with respective analysis scripts are accessible on https://osf.io/sybrd/.
Note that averages included trials with both correct and incorrect emotion identifications, while previous studies used correct trials only (Schirmer et al., 2013). In the current dataset, the rate of misclassifications was fairly high, and an exclusion of these trials would have resulted in a substantial reduction of signal-to-noise ratio and statistical power. However, to ensure that our results were not biased by the inclusion of incorrect trials, we also repeated analyses based on correct trials only. The results replicated the pattern based on all trials, except that the difference in the N400-like negativity was slightly reduced for fearful stimuli. For a detailed report of effects sizes in different subsets of trials, please refer to the materials on https://osf.io/sybrd/.
Results
Behavioral data—proportion of correct classifications
The mean proportion of correct responses was averaged separately for Emotion, Morph Type and participants. As there was no response option for ‘neutral’, neutral stimuli were excluded from analysis. An initial 4 × 3 analysis of variance with the within-subject factors Emotion and Morph Type revealed main effects of Emotion; F(3, 114) = 45.42, p < 0.001, ω2 = 0.53, 95%-CI [0.40, 0.62], εHF = 0.983; and Morph Type; F(2, 76) = 295.67, p < 0.001, ω2 = 0.88, 95%-CI [0.83, 0.91], εHF = 0.896; which were further qualified by an interaction; F(6, 228) = 57.80, p < 0.001, ω2 = 0.59, 95%-CI [0.52, 0.64], εHF = 0.753 (Figure 2). Post hoc comparisons of the different Morph Types for each Emotion revealed the following pattern: For all emotions, performance in the Full condition was better than in the F0 and timbre conditions, |ts(38)| ≥ 4.41, p values ≤ 0.001, Cohens d > 0.72 [0.36, 1.07]. The only exception was the F0-sadness condition which differed from the Full-sadness condition only marginally, t(38) = 1.88, p = 0.067, d = 0.31 [−0.02, 0.63]. Importantly, the relative contributions of F0 and timbre differed. Specifically, comparing F0 vs timbre revealed a larger impact of F0 on recognizing happiness, t(38) = 10.48, p < 0.001, d = 1.70 [1.20, 2.19]; fear, t(38) = 5.98, p < 0.001, d = 0.97 [0.58, 1.35]; and sadness, t(38) = 2.06, p = 0.046, d = 0.33 [0.01, 0.66]. In contrast, a larger impact of timbre was seen for pleasure, t(38) = −3.28, p = 0.002, d = −0.53 [−0.19, −0.87].
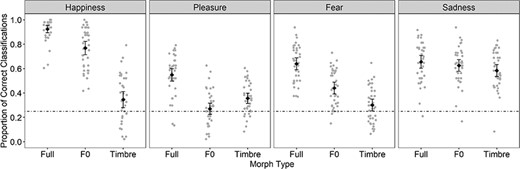
Mean proportion of correct responses per Emotion and Morph Type.
In addition to the proportion of correct responses, we calculated confusion data for each Emotion per Morph Type, this time including the neutral stimuli. The response matrices are displayed in Figure 3. The full statistical analysis is provided on https://osf.io/sybrd/.
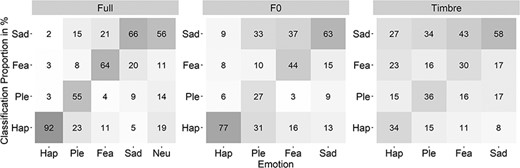
Confusion data for each Emotion separately for the three Morph Types.
ERP data
Nonparametric cluster-based permutation test
Cluster-based permutation tests were run to compare the Full minus F0 and Full minus Tbr difference waves separately for each emotion in a time window from 0 to 500 ms. The results are visualized in Figure 4. For happiness, the cluster-based permutation test revealed a significant difference between the F0 and the Timbre condition (p < 0.05), in a pronounced frontocentral cluster between 130 ms and the end of the analyzed time range at 500 ms. Additionally, two bilateral temporal clusters appeared at an onset latency of around 230 ms. For pleasure, a frontocentral cluster was observed in the time range of 150–200 ms and for fear in a later time range of 300–400 ms, which seemed lateralized to the left. For sadness, no clusters of significant differences were observed. Please note that the spatial-temporal pattern of these clusters has to be interpreted with caution, since cluster-based permutation tests do not allow a definite conclusion about where an effect begins and ends in space and time, but only indicate that there is a difference within a given spatiotemporal window (Maris and Oostenveld, 2007).
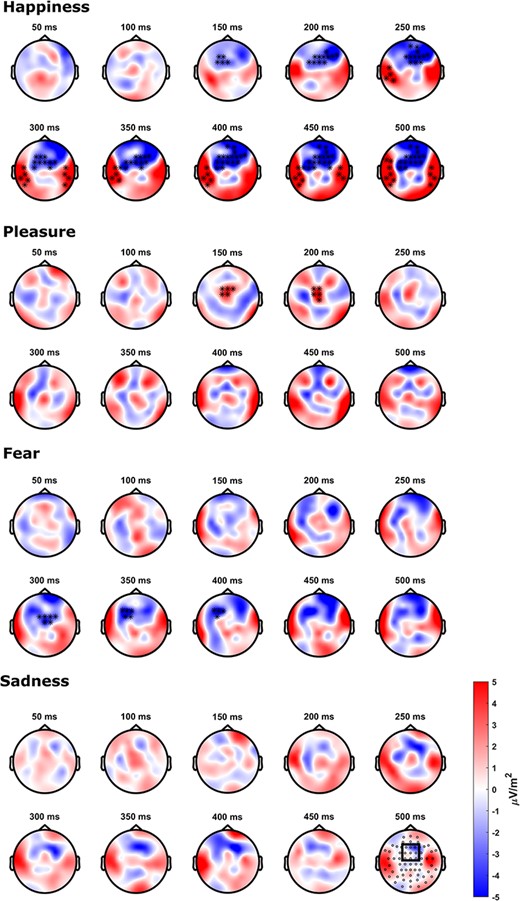
Scalp topographies of the contrast between the difference waves DiffFull-F0 and DiffFull-Timbre for each emotion separately from 50 to 500 ms.
Analysis of the frontocentral ROI
To explore the frontocentral cluster in more detail, ERPdata were averaged across an ROI of nine channels [F1, Fz, F2, FC1, FCz, FC2, C1, Cz and C2] (Figure 5). The difference between F0 and timbre was quantified by comparing mean amplitudes in the time windows of the P200 [150, 250] and the N400-like negativity [300, 400]. To compare the contrasts across emotions, we quantified them in terms of effect sizes (Cohen’s d). Since the ROI was preselected based on significant clusters, we refrained from further null hypothesis significance testing.
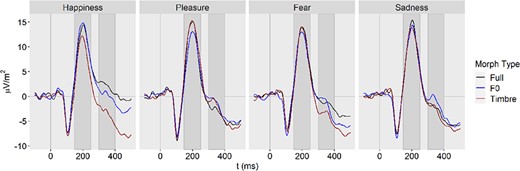
ERPs separately for Emotion and Morph Type, averaged across nine channels.
P200.
The contrast of F0 vs timbre revealed a strong effect for happiness, d = 0.70, 95%-CI: [0.34, 1.05] and an effect in the opposite direction for pleasure, d = −0.53 [−0.19, −0.86], whereas effects for fear and sadness were negligibly small, with d = −0.05 [−0.36, 0.27] and d = 0.03 [−0.28, 0.34], respectively.
N400-like negativity.
In the time window of the N400-like negativity, the strong effect in happiness persisted, d = 0.87 [0.50, 1.24], while the effect in pleasure ceased, d = 0.10 [−0.21, 0.41]. For fear and sadness, medium effects were observed, with d = 0.41 [0.08, 0.73] and d = 0.38 [0.06, 0.70], respectively.
Parameter effects on ERP amplitude predict parameter effects on behavior.
To model the relationship between behavior and ERPs, we calculated performance and amplitude differences between F0 and timbre for corresponding stimuli and averaged them across the two stimulus presentations. A cumulative link mixed model (calculated with the ‘oridinal’ Package in R, Christensen, 2015) with the syntax AccuracyF0-Timbre ∼ Emotion + P200F0-Timbre + N400F0-Timbre + (Emotion+ P200F0-Timbre + N400F0-Timbre|Participant) revealed that parameter differences in the amplitude of the N400-like negativity predicted the relative predominance of F0 over timbre in emotion recognition (β = 0.004 ± 0.002, z = 2.042, p = 0.041). Thus, the bigger the F0 vs timbre amplitude difference in the N400-like negativity, the bigger was the performance difference between F0 and timbre. In additional exploratory analyses, we split the N400-like negativity into an early [300–350] and later [350–400] interval and observed that the predictive power was driven by the later interval (β = 0.004 ± 0.002, z = 2.336, p = 0.019), but not the early one (β = 0.002 ± 0.002, z = 1.277, p = 0.202). The P200 effect was non-significant (P200: β = −0.002 ± 0.002, z = −1.004, p = 0.315).
Discussion
This study explored the relative contributions of timbre and F0 to the perception of vocal emotions and pursued the temporal course underpinning emerging vocal representations. Task performance and the ERPs underlined the importance of both parameters, while revealing their unique processing contributions as a function of emotion. The following paragraphs outline these contributions and present a discussion of how they inform extant models of vocal emotion perception.
The unique contribution of F0 and timbre in vocal emotion processing
While much research has pursued the functional significance of F0, considerably less attention has been directed to timbre (Banse and Scherer, 1996; Juslin and Laukka, 2003). Yet, based on the recurring finding that F0 correlates with perceived arousal (Brück et al., 2011), timbre was suggested to signal valence. This view was supported by machine-based classification approaches and behavioral data from nonverbal vocalizations (Tursunov et al., 2019; Anikin, 2020). The present data disagree with this perspective. A functional link between F0 and arousal should have led to more confusions across valence in the F0-only condition. In other words, participants should have mixed up high arousal emotions with other high arousal emotions (i.e. happiness and fear) and low arousal emotions with other low arousal emotions (i.e. pleasure and sadness; refer to the rating data on https://osf.io/sybrd/). Likewise, a functional link between timbre and valence should have led to more confusions across arousal in the timbre-only conditions. Mix-ups should have happened primarily within rather than across positive (i.e. happiness and pleasure) and negative emotions (i.e. fear and sadness). Neither pattern was observed in the present confusion data (Figure 3). Instead, all emotions tended to be confused most often with sadness.
Other proposals exist that better match the available evidence. For example, Gobl (2003) speculated that F0 expresses stronger emotions, while timbre may more effectively signal milder affective states. While the present data cannot directly speak to this, they accommodate such functionality. F0 effects were most pronounced for happiness and fear, which were rated high in intensity (for details, refer to the rating data in https://osf.io/sybrd/). For emotions of lower intensity, such as sadness and pleasure, F0 effects were either reduced or absent. Similarly, Grichkovtsova et al. (2012) found prosody contour (including F0) to be more important for the recognition of happiness, whereas timbre seemed more important for sadness. Although our findings slightly diverge, they align with the fact that timbre seemed more relevant for weaker emotions.
Nevertheless, we reason that a framework linking F0 and timbre to rigid functional meanings is overly simplistic. Such a framework fails to account for the variability and flexibility in producing and perceiving vocal emotions. Very different styles of emotional expression can result in comparable recognition performance (Gobl, 2003; Spackman et al., 2009), underlining the perceivers’ ability to adjust reliance on different vocal parameters when extracting emotional meaning. Another important aspect is the potential interaction of vocal parameters. Timbre and F0 naturally co-vary (Arias et al., 2021). Thus, when studied in isolation, one does not only eliminate the impact of the controlled vocal parameter but also their joint contribution. On the one hand, this would be particularly detrimental if important changes in one vocal parameter depend on coherent changes in the other (Grichkovtsova et al., 2012). On the other hand, one could also assume that one parameter is particularly important for emotional signaling while the other is naturally less informative. If so, the importance of timbre in the present pleasure stimuli could be partly due to the natural lack of information in F0 contour (Anikin, 2020).
Electrophysiological correlates of F0 vs timbre processing
How are vocal parameters analyzed and integrated in the brain to extract the emotional salience of voices? Although much debated, this process is still poorly understood (Paulmann and Kotz, 2018). We sought to shed light on this question by explicitly comparing the divergence of the two parameter-specific conditions from the Full emotion condition to study the relative importance of F0 vs timbre.
We found that happy voices elicited a smaller P200 amplitude in the timbre relative to the F0 condition, whereas vocal pleasure elicited an opposite effect, in line with the observed performance data. For the N400-like negativity, parameter-specific effects were observed for happiness, sadness and fear, with larger amplitudes for timbre relative to F0, again in line with the behavioral results. Of importance is that the N400 amplitude difference between timbre and F0 positively predicted the associated performance difference in the behavioral data.
These findings add to our understanding of the functional significance of the P200 and the N400. With emotional quality and acoustic cues being confounded in natural stimuli, it has been difficult to ascertain whether these components reflect emotional processing or are subject merely to basic acoustic influences (Paulmann et al., 2013; Schirmer and Gunter, 2017). In the present study, we employed stimuli with controlled acoustics and the intriguing resemblance between the behavioral and ERP results implies that emotional rather than acoustic processes shaped the P200 and the N400. Together, these findings agree with conclusions drawn from acoustically uncontrolled studies (Paulmann and Kotz, 2008; Schirmer et al., 2013) and corroborate existing models of vocal emotional processing (Schirmer and Kotz, 2006; Frühholz et al., 2016). Moreover, the finding that amplitude differences in the N400 (but not the P200) predicted overt emotion identification suggests that this process was fairly independent from early automatic responses and shaped instead by later more controlled processes such as conceptual processing of emotional meaning (Paulmann and Kotz, 2018). Note that for this study we adopted an exploratory approach and identified components based strictly on their timing and polarity. Moreover, regarding the N400, we wish to clarify that although this component was originally described in the context of lexical integration and semantic incongruity (Kutas and Hillyard, 1980), it has since been pursued more broadly including, for example, in the context of perceptual and semantic picture priming (Barrett et al., 1988; Barrett and Rugg, 1989), face processing (Wiese et al., 2017) and emotional processing (Paulmann and Pell, 2010). Thus, somewhat different N400 components, varying with regard to timing and scalp topography, have been documented and linked to a range of processes. For a more detailed discussion of this, please refer to Kutas and Federmeier (2011).
The observed ERP modulations suggest an emotion-specific time course in the neural processing of voices, with an earlier onset of emergent representations for happiness and pleasure when compared with sadness and fear. Similarly effects have been reported for static faces (Schindler and Bublatzky, 2020). However, in contrast to static faces, the acoustics in voices evolve over time and may unfold their emotional information simply as a function of when and how a given cue becomes available. Thus, to what extent the latency differences we observed in this present study reflect relative differences in the ease or accessibility of positive and negative emotions or are tied strictly to acoustic stimulus constraints awaits further research.
Directions for future research
The present study presents a novel approach to the long-standing question of how the brain represents a speaker’s emotional state. While it offers important new insights, it also generates a number of important questions. One such question concerns potential considerations associated with voice morphing. Although this technique results in stimulus materials of high quality, it also inevitably leads to parameter combinations that are unlikely to occur in natural voices, potentially making morphed stimuli sound less natural or human-like (Grichkovtsova et al., 2012; Skuk et al., 2015). Note that this concern is not specific to parameter-specific voice morphing but is equally prevalent in experiments using parameter-specific facial morphs (Sormaz et al., 2016). The extent to which both facial and vocal naturalness can be perceived and might influence emotion processing deserves further research. Another question concerns whether and how a listeners’ goals might shape parameter-specific processes. For example, it would be interesting to investigate under which circumstances the present effects replicate. Would they be still observable if participants were not instructed to explicitly identify the emotions? Based on the present findings, one would expect the N400 to be more malleable to task effects than the P200. Finally, an interesting direction for future research would be to pursue individual differences. For example, Schneider et al. (2005) distinguished ‘fundamental pitch listeners’ and ‘spectral listeners’ with profound structural and functional differences in the auditory cortex. Likewise, there may be ‘F0 listeners’ and ‘timbre listeners’ who rely to different degrees on these parameters in vocal emotions.
Summary and conclusion
The present study demonstrated that the relative contributions of timbre and F0 to vocal emotion processing vary as a function of emotional category, with F0 being more important for happy, fearful and sad expressions and timbre being more important for pleasure. Furthermore, the relative importance of vocal cues for behavioral performance was mirrored in the ERPs at time points overlapping with the P200 and the N400. Indeed, N400 effects significantly predicted overt judgments delineating an important link between parameter-specific neural and behavioral processes. Thus, future research may leverage on parameter-specific voice morphing as a useful tool when studying how the human brain translates voice acoustics into emotional meaning.
Acknowledgements
We thank Bettina Kamchen and Kathrin Rauscher for their support with the data collection and Jürgen M. Kaufmann, Verena G. Skuk, Ayaka Tsuchiya and Romi Zäske for helpful suggestions on the data analysis and the manuscript. The original voice recordings that served as a basis for creating our stimulus material were provided by Sascha Frühholz. The rating study was developed together with Andrea E. Kowallik. We are grateful to all participants of the study.
Conflict of interest
The authors declared that they had no conflict of interest with respect to their authorship or the publication of this article.
Data availability
Supplemental figures and tables, analysis scripts and raw data can be found on the associated OSF repository (https://osf.io/sybrd/).
Credit author statement
C.N.—conceptualization, methodology, software, visualization, formal analysis and writing—original draft.
A.S.—methodology, writing—review and editing and supervision.
S.R.S.—conceptualization, writing—review and editing and supervision.
References
Author notes
C.N. has been supported by the German National Academic Foundation (“Studienstiftung des Deutschen Volkes”).
